

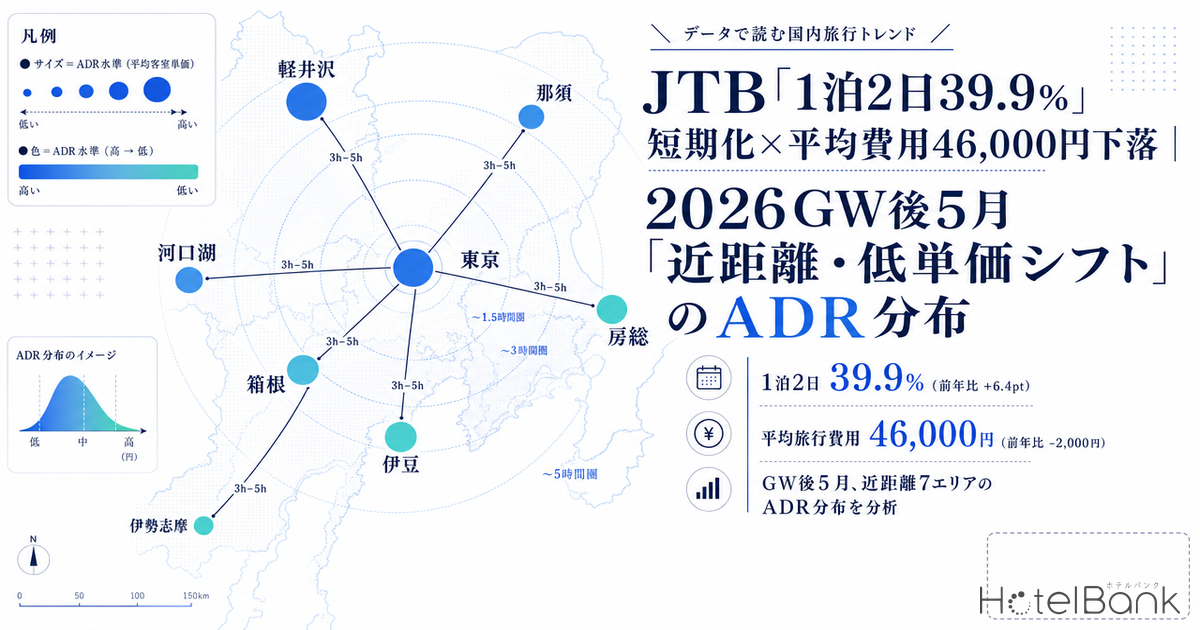
According to JTB’s “2026 Golden Week (April 25 – May 7) Travel Outlook” released on April 2, 2026, domestic travelers will reach 23.9 million (101.7% YoY, a slight increase), while average travel spending will fall to ¥46,000 (down ¥2,000 from the previous year). In terms of stay length, “1 night / 2 days” trips became the most common at 39.9%, up 6.4 points YoY. This article examines how this “shorter stays × lower spend” trend is showing up in the post-GW May (5/7 – 5/31) short-haul resort market, using OTA published-rate data covering roughly 1,300 properties across seven areas within a 3–5 hour reach of the Tokyo metropolitan region (Izu, Hakone, southern Boso, Nasu, Karuizawa, Lake Kawaguchi, and Ise-Shima).
Metric Definitions Used in This Article
- ADR (Average Daily Rate): Average of selling prices published on OTAs and other channels. This differs from actual transacted rates (when cross-checked against REIT-disclosed data, the OTA average tends to run +25–30% higher than transacted ADR. Higher-priced plans that fail to sell remain on OTAs, structurally pushing the average of published prices above the transacted level). Per-room rate (tax included) for 2 adults in 1 room, averaged across all plans (room-only through meal-inclusive).
- Sellout rate: The share of plans that had stopped accepting reservations on OTAs at the time of survey. This differs from a property’s overall room occupancy rate.
- Seven short-haul resort areas: Resort clusters within roughly a 3–5 hour drive or rail reach of the Tokyo metropolitan area (measured from Tokyo Station). Izu (entire peninsula, N=825), Hakone (N=242), southern Boso (N=175), Nasu (N=181), Karuizawa (N=145), Lake Kawaguchi (N=226), and Ise-Shima (N=210). Extracted by geographic coordinates from the active properties tracked by MetroEngines Research (メトロエンジンリサーチ).
- Data sources: MetroEngines Research (OTA published rates, survey period: early May 2026); JTB press release (released April 2, 2026)
Three Structural Shifts in JTB’s Survey: Slight Headcount Gain, Spending Decline, Shorter Stays
JTB’s April 2, 2026 release on the 2026 GW (April 25 – May 7) travel outlook overturned the prior assumption that “average spending would remain elevated.” Domestic travelers came in at 23.9 million (101.7% YoY, only marginally higher), while average per-person travel spending fell to ¥46,000 (97.9% YoY, roughly ▲¥2,000) — a clear decline. Total domestic travel spending was ¥1,099.4 billion (99.5% YoY), essentially flat YoY, as the headcount gain was offset by lower per-person spending.
The most notable change is in the mix of stay lengths. In JTB’s tabulation, “1 night / 2 days” became the largest segment at 39.9%, up a substantial 6.4 points YoY. Meanwhile, “2 nights / 3 days” dropped to 32.0% (▲0.7pt) and “3 nights / 4 days” to 16.2% (▲3.6pt) — every multi-night pattern declined, for a combined drop of 6.5 points. Behind this, JTB itself points to “destination selection centered on areas close to home, shorter durations, and shorter-distance travel by private car.” For verification of how JTB’s reported “23.4% travel intention” aligns with actual OTA booking data, see Is JTB’s 23.4% Travel Intention Real? Verifying GW2026 with OTA Booking Data.
Source: JTB “2026 Golden Week Travel Outlook” (released April 2, 2026); compiled by HotelBank Editorial Team
The impact of this “shortening” flows directly into hotel-booking economics. Starting from the ¥46,000 average for a 1-night/2-day trip and subtracting round-trip transportation (¥8,000–¥12,000 for tolls and gasoline by private car, or rail round-trip) and roughly ¥15,000 for local food and sightseeing, the budget left for lodging is around ¥10,000–¥12,000 per person. For 2 adults in 1 room, that puts per-room ADR roughly at ¥20,000 or below — and in practical terms, around ¥15,000 represents the “comfortable budget zone.” This article uses “ADR under ¥20,000” as one threshold to examine the supply structure of the short-haul resort market.
What Happened Between GW Peak and Post-GW: A Three-Phase Comparison
First, we look at how ADR and sellout rates moved across three phases for the seven short-haul resort areas: GW peak (5/3 – 5/5), immediate post-GW (5/7 – 5/15), and late May (5/16 – 5/31). The contrast between GW peak and post-GW quantifies the magnitude of the post-peak demand reversal.
Source: MetroEngines Research; compiled by HotelBank Editorial Team
All seven areas saw ADR drop more than 20% immediately after GW. The decline was largest in higher-rate areas: Karuizawa fell from ¥94,700 to ¥59,300 (▲37%), Hakone from ¥94,900 to ¥71,800 (▲24%), and Izu from ¥72,800 to ¥52,000 (▲29%). Sellout rates also shifted dramatically, with Izu moving from 33.9% during GW to 19.4% post-GW (▲14.5pt) and Hakone from 46.8% to 34.3% (▲12.5pt) — peak-period inventory tightness eased rapidly.
| Area | GW Peak ADR | Post-GW ADR | Change | GW Peak Sellout | Post-GW Sellout |
|---|---|---|---|---|---|
| Hakone | ¥94,900 | ¥71,800 | ▲24% | 46.8% | 34.3% |
| Karuizawa | ¥94,700 | ¥59,300 | ▲37% | 24.4% | 12.9% |
| Ise-Shima | ¥76,300 | ¥54,900 | ▲28% | 22.0% | 17.3% |
| Izu | ¥72,800 | ¥52,000 | ▲29% | 33.9% | 19.4% |
| Southern Boso | ¥66,300 | ¥43,700 | ▲34% | 20.9% | 12.9% |
| Lake Kawaguchi | ¥64,300 | ¥51,800 | ▲19% | 31.3% | 20.2% |
| Nasu | ¥61,300 | ¥40,400 | ▲34% | 14.6% | 9.9% |
Source: MetroEngines Research; compiled by HotelBank Editorial Team
Notably, ADR remained essentially flat between immediate post-GW and late May (within ±5% in most areas). This indicates that the demand drop is not a temporary “GW reversal,” but rather a return to a “weekday baseline” that holds across May as a whole. The “shorter stays × lower spend” shift highlighted by JTB is in effect materializing during this post-GW lull. For a daily-level look at ADR declines and the timing of the Mother’s Day rebound across four major Tokyo-area cities during the same period, see Post-GW “Trough” Recovers in 3 Days: Daily ADR Trends in 4 Cities and the Mother’s Day Effect (May 2026).
By Area: Weekday/Weekend ADR and Sellout Rates
We summarize weekday/weekend ADR and sellout rates by area across the 25 days from 5/7 to 5/31. “Weekday” is defined as Monday through Friday, and “weekend” includes Friday-night stays (Sat/Sun checkout) and Saturday-night stays (the two days Saturday and Sunday).
Source: MetroEngines Research; compiled by HotelBank Editorial Team
Across all seven areas, weekday ADR was ¥53,200 with an 18.7% sellout rate, while weekend ADR was ¥58,700 with a 19.6% sellout rate — only an 11% spread between weekday and weekend rates. Many areas show sub-20% sellout rates even on weekends, indicating no demand pressure comparable to GW peak. Hakone stands out with sellout above 34%, but this reflects a structural feature: in this area’s high-end ryokan and luxury segment, reservations move quickly even on weekdays, so lower-priced plans sell out first and “the average of remaining published prices is pushed higher” (consistent with ADR in the ¥70,000s).
Conversely, Nasu and southern Boso have the lowest sellout rates at 10–14%, with ADR also at the lowest end of the range (¥40,000–¥45,000). These are areas where “weekday inventory has plenty of slack and price-led demand stimulation works well.” For travelers who match JTB’s “¥46,000 average, 1 night / 2 days” profile and have roughly ¥15,000 of the budget for lodging, these markets offer abundant realistic options.
Daily ADR Trends: Inter-Area Gap Stretches to Nearly 2x
Looking at daily ADR by area across the 25 days from 5/7 to 5/31, the highest range (Hakone in the ¥70,000s) and the lowest range (Nasu just under ¥40,000) consistently maintain a 1.7–1.8x gap. Saturday-night stays (5/9, 5/16, 5/23, 5/30) produce small peaks across all areas, but the upside is only ¥5,000–¥10,000, with no GW-style strong weekend premium evident.
Source: MetroEngines Research; compiled by HotelBank Editorial Team
This flat trajectory suggests the short-haul resort market has shifted into a “normal mode without peak-period upside.” Price levels are nearly identical between the first weekend after GW (Sat 5/9) and the last weekend of May (Sat 5/30). From the hotel side, even Saturday-night stays no longer carry enough demand pressure to support aggressive pricing.
Heatmap: Availability Rate of Properties Bookable Under ¥20,000 ADR
To visualize the actual supply meeting JTB’s “¥46,000 average, 1 night / 2 days” profile, we tabulated the share of properties with weekday-equivalent ADR under ¥20,000 that were still bookable, across an area × date matrix of 25 days. A higher value indicates a higher probability of finding a stay around ¥15,000 in that area on that date.
Source: MetroEngines Research; compiled by HotelBank Editorial Team
Three patterns emerge from the heatmap. First, southern Boso, Karuizawa, and Nasu have the highest share of “properties bookable under ¥20,000” at 30–40%, with southern Boso exceeding 40% on weekdays in late May. These rank as the short-haul resorts that best match JTB’s reported budget. Second, Hakone stays steadily around 7% throughout the period — low-rate options are structurally scarce (driven by a supply mix centered on luxury ryokan). Third, in every area this share dips a notch on Saturday-night stays (5/9, 5/16, 5/23, 5/30), confirming that lower-rate inventory sells through first on weekends.
ADR Distribution by Area: Property Composition by Price Band
To show the absolute count of options visible to “¥46,000 average” travelers, we organized the property mix by ADR band for each area (weekday basis: Mon–Fri).
Source: MetroEngines Research; compiled by HotelBank Editorial Team
Izu has the largest absolute property count at 564 properties — 102 of those are in the weekday ¥10,000s ADR band (¥10,000–¥19,999) alone, the largest pool of options across all seven areas. Southern Boso has only 113 properties, but the share of properties in the ¥10,000s band (¥10,000–¥14,999) is high at 12.4% (14 properties), making it geographically well aligned with JTB’s noted “private-car, short-distance, short-stay” trend.
By contrast, Karuizawa (14.1%) and Lake Kawaguchi (15.8%) have only 14–16% of properties in the ¥10,000s band, and Ise-Shima drops to 7.5%. These areas are dominated by mid-to-high-rate supply, with properties at ¥30,000+ accounting for 40–50% of inventory. In Hakone, properties in the ¥10,000s band are just 4.4% (7 properties) — for a “¥46,000 / 1 night, 2 days” traveler, options are effectively very limited.
Implications for Revenue Management: Capturing “Shorter × Lower-Spend” Demand
Reading JTB’s survey alongside the OTA real-market data in this article, clear “revenue opportunities” and “pricing-strategy decision points” emerge for the post-GW May market. We organize them by area type below.
| Type | Areas | Characteristics | RM Opportunity |
|---|---|---|---|
| Low-rate, deep supply | Southern Boso, Nasu | ADR in the ¥40,000s, sellout 10–14%, ¥10,000s-band properties at >15% | Core battleground for “¥46,000 average” travelers. Room to capture more demand via OTA reach plus stepwise last-minute price increases. |
| Mid-rate, dispersed | Izu, Lake Kawaguchi | ADR in the ¥50,000s, sellout around 20%, wide price-band spread | Use segment-tiered packages (breakfast-included / room-only / onsen plans) to differentiate ADR ranges and capture a wider demand base. |
| High-rate concentrated | Hakone, Karuizawa, Ise-Shima | ADR ¥55,000–¥75,000, properties above ¥30,000 account for ~50% | Distinct segment from the “¥46,000 layer.” Opportunity to maintain ADR by appealing to “special-occasion” or “annual treat” demand. |
Source: MetroEngines Research; compiled by HotelBank Editorial Team
The “low-rate, deep-supply” areas in particular align geographically with JTB’s noted shift to “private-car, short-distance” travel. Southern Boso is within 2 hours of the Tokyo metro area via the Aqua-Line, and Nasu is 2.5 hours via the Tohoku Expressway — both archetypal “spur-of-the-moment, 1-night/2-day” destinations. Their current sellout rates below 20% do not necessarily mean weak demand per se, but rather that “low-rate inventory remains plentiful in published-price data” — leaving meaningful headroom to capture additional bookings through the right promotional and channel-management approach.
High-rate concentrated areas, on the other hand, demand a different segmentation strategy. JTB’s “¥46,000 average” is an all-Japan, all-travel-style mean — the upper part of that distribution still contains durable high-spend demand. Hakone’s sellout rate above 34% indicates demand has held up consistently even on weekdays. The key decision: which segment your property positions for — going after the “¥46,000 layer” with price strategy, or preserving ADR by retaining the “special-occasion” segment.
Conclusion: The Post-GW Short-Haul Resort Market Has Shifted to a “Budget-Match” Mode
JTB’s GW travel outlook released April 2, 2026 clearly captured travelers’ “shorter × lower-spend” shift through the decline in average spending and the surge in the share of 1-night/2-day trips. Consistent with that pattern, the OTA real-market data in this article shows that, across the seven short-haul resort areas, the post-GW May market has reverted to a “normal mode with weak demand pressure” — weekday ADR around ¥53,000 with sellout rates just under 20%.
In particular, southern Boso, Nasu, and Karuizawa show that 30–40% of properties are bookable under ¥20,000, leaving plenty of realistic options for travelers in the “¥46,000 / 1 night, 2 days” budget profile JTB describes. Meanwhile, high-rate concentrated areas such as Hakone and Ise-Shima require a different segment strategy. From the supply side, the strategic choice — which type your property fits, and which segment to pursue — will be the key to capturing the May–June trough demand. For context, all of these short-haul resort ADR levels are higher than the national average (¥32,340), and the underlying CPI-driven and labor-cost pass-through dynamics are detailed in National Average ADR Hits Record ¥32,340 (May 2026).
Note on forward-dated ADR: ADR figures in this article reflect averages of OTA published selling prices at the survey time (early May 2026) and will fluctuate as check-in dates approach. Currently elevated rates may decline through last-minute discounting, while low-rate inventory may also be absorbed close to arrival. Please interpret these figures with both possibilities in mind.
References & Related Articles
[Sources & References]
– JTB “2026 Golden Week (April 25 – May 7) Travel Outlook” (released April 2, 2026)
– JTB Tourism Research & Consulting “Announcement of the 2026 Golden Week Travel Outlook“
– Japan Tourism Agency “Overnight Travel Statistics Survey”
- 2026 GW Travel Outlook: Domestic 23.9 Million Slight Increase, Shorter Stays and Spending Restraint
- Is JTB’s 23.4% Travel Intention Real? Verifying GW2026 with OTA Booking Data
Recommended Reading
- Is JTB’s 23.4% Travel Intention Real? Verifying GW2026 with OTA Booking Data
- 2026 GW Travel Outlook: Domestic 23.9 Million Slight Increase, Shorter Stays and Spending Restraint
- Post-GW “Trough” Recovers in 3 Days: Daily ADR Trends in 4 Cities and the Mother’s Day Effect (May 2026)
- Up to 44% Off Post-GW: Mid-May Hotel “Bottom Price” Complete Guide (2026 Data Analysis)
- National Average ADR ¥32,340 Hits Record High (May 2026): Inflation × Labor-Cost Pass-Through Behind a 3-Year +19%
- Summer Resort 3-Region Comparison 2026: Niseko, Okinawa, Karuizawa — ADR, Booking Pace, FX Sensitivity
- GW2026 Fastest-Sellout Family Hotels: 6,106 Properties Vanished by March, Implications for Next Year
- GW2026 Last-Minute Rush: Lead-Time-Based ADR Trends