

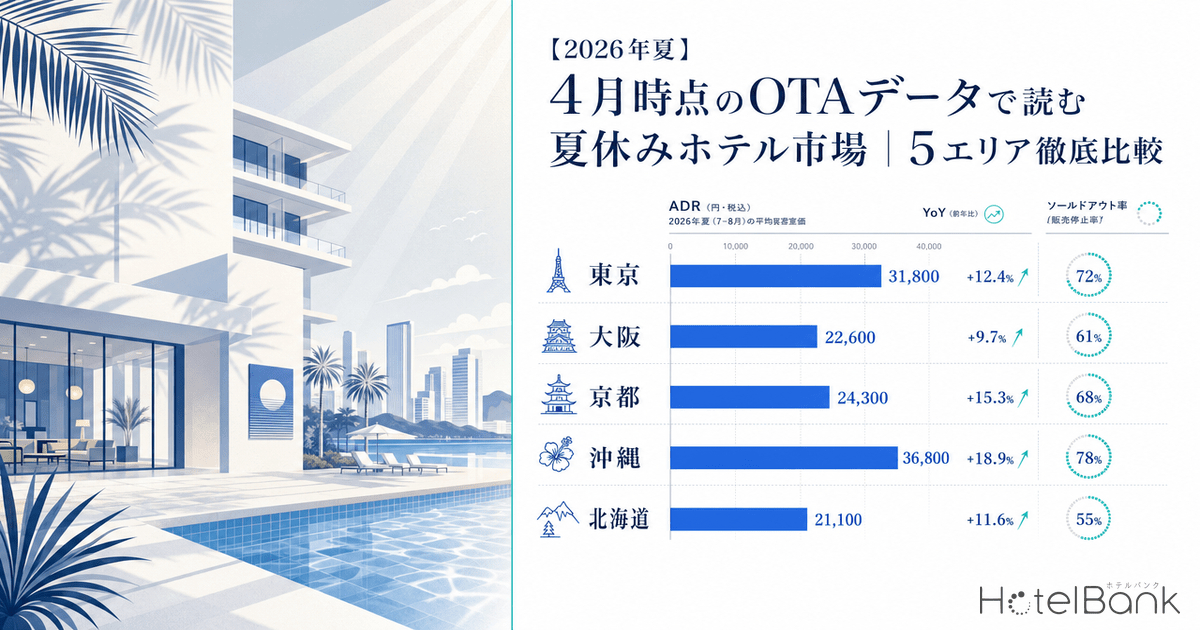

*Prices shown are per-room rates (tax included) for double occupancy, averaged across all plan types (room-only through meal-inclusive plans).
With approximately three months remaining until Japan’s summer holiday season (July 20 to August 31, 2026), we used MetroEngines Research data to aggregate and analyze publicly listed accommodation prices as of April 25, 2026. Our coverage spans five major regions—Tokyo, Hokkaido, Kyoto, Okinawa, and Nagano (including Karuizawa)—totaling more than 7,000 properties. By comparing these figures with the same point last year, we identify the structural shifts in this summer’s demand and pinpoint the dates that travelers should lock in now.
Metric Definitions Used in This Article
- ADR (Average Daily Rate): Average of publicly listed prices on OTAs for the surveyed properties. This differs from actual transaction prices. Per-room rate (tax included) for double occupancy, averaged across all plan types (room-only through meal-inclusive plans).
- Sold-Out Rate: Share of plans that had closed reservations on OTAs at the time of survey. This differs from overall room occupancy at the property level (direct sales and phone reservations are not included).
- Data Source: MetroEngines Research
Summer ADR Overview Across 5 Regions: Nagano +14.4% and Okinawa +10.4% Stand Out
First, let’s establish the big picture. The table below summarizes the average ADR and YoY change for the July 20–August 31 period in each of the five regions. The largest gain is in Nagano (which includes Karuizawa) at +14.4% YoY, followed by Okinawa at +10.4%. By contrast, Tokyo’s ADR increased only +2.8%, revealing a sharp divergence between urban demand and the price premiums commanded by summer-resort and mountain-retreat destinations.
| Region | 2026 ADR | 2025 ADR | YoY | Sold-Out Rate | Properties |
|---|---|---|---|---|---|
| Nagano | ¥53,100 | ¥46,400 | +14.4% | 11.9% | N=1,204 |
| Okinawa | ¥50,200 | ¥45,500 | +10.4% | 17.7% | N=1,571 |
| Hokkaido | ¥44,100 | ¥40,400 | +9.3% | 19.1% | N=1,436 |
| Kyoto | ¥42,100 | ¥39,500 | +6.6% | 16.4% | N=1,413 |
| Tokyo | ¥38,500 | ¥37,500 | +2.8% | 24.4% | N=1,475 |
Source: MetroEngines Research, compiled by HotelBank Editorial Team (publicly listed price data as of April 25, 2026)
Notably, Nagano—despite the highest ADR—has the lowest sold-out rate at 11.9% across all five regions. This indicates that resort areas centered on Karuizawa are pushing room rates substantially higher while inventory still has room. In short, prices are aggressive, but bookings are still ramping up toward peak. Conversely, Tokyo’s sold-out rate of 24.4% is the highest of the five regions, reflecting how steady business demand combined with inbound travelers is consuming inventory faster than in the other markets.
Source: MetroEngines Research, compiled by HotelBank Editorial Team
Daily ADR Trends: Obon Peak Drives Nagano to ¥64,900
Next, we look at ADR trends on a daily basis. The chart below plots the daily ADR for each of the five regions across the entire July 20–August 31 window. Every region exhibits a clear “weekend spike”—prices surge on Fridays and ease on Sundays through Mondays—but a distinctive feature is that during the Obon period (August 8–16), elevated rates persist even on weekdays.
Nagano hit a period high of ¥64,900 on Saturday, August 8, with a nine-day Obon average of ¥62,100. Okinawa also climbed to ¥55,500 over the same period. Tokyo’s Obon ADR, however, was just ¥39,700, showing none of the standout gains seen in resort regions. Tokyo tends to “empty out” in summer due to homecoming travel, giving it the opposite supply-demand structure of resort destinations.
Source: MetroEngines Research, compiled by HotelBank Editorial Team
Sold-Out Rates as a Tightness Gauge: Tokyo Tops 32% on Saturdays, Nagano “Still Has Room”
Beyond ADR, the sold-out rate (the share of properties already fully booked at the time of survey) is a critical leading indicator. The chart below plots the daily sold-out rate trajectory.
Tokyo reached its peak sold-out rate of 32.8% on Saturday, July 25, with subsequent August Saturdays running roughly 25–28%. Having more than 30% of properties already closed for sales as of April vividly illustrates the speed of Tokyo’s booking pace. Hokkaido, by contrast, peaked at 24.7% on Wednesday, August 13, reflecting how demand concentrates on Obon weekdays in that region.
Nagano’s sold-out rate stays low throughout—in the 8–17% range. The fact that the region with the highest ADR also has the lowest sold-out rate can be interpreted as: “Bookings have not caught up precisely because prices are high.” Conversely, this leaves room for last-minute price cuts, making it worthwhile to monitor pricing trends from July onward.
Source: MetroEngines Research, compiled by HotelBank Editorial Team
Weekly YoY Trends: Price Growth Peaks in Early August
Next, we visualize YoY price changes on a weekly basis, splitting the period into six weeks for all five regions.
Nagano recorded a standout +18.4% YoY in the first week of August (8/3–9). Beyond the relatively low base from the same period in 2025, aggressive resort pricing centered on the Karuizawa area appears to have spread in 2026. Hokkaido also posted +12.3% in that same week, showing that pricing pressure peaks in early August when summer-retreat demand fully kicks in.
Tokyo, meanwhile, stayed in a narrow +0.1% to +5.1% range across all weeks, with mild price movement overall. Notably, the final week of August (8/24–31) recorded the period’s highest YoY at +5.1%. This likely reflects a rebound from a steep year-ago discount as the 2025 summer holiday wound down, suggesting that inbound demand is now providing year-round price support in 2026.
Source: MetroEngines Research, compiled by HotelBank Editorial Team
Demand Structure and Booking Strategy by Region
Building on the analysis above, we summarize the demand characteristics of each region.
| Region | Demand Profile | Obon ADR | Obon YoY | Booking Pace |
|---|---|---|---|---|
| Tokyo | Inbound + business base. Obon eases as residents travel home. | ¥39,700 | +1.5% | Fast |
| Hokkaido | Summer-retreat demand concentrated late July to early August. Obon ADR ¥47,900. | ¥47,900 | +10.2% | Moderate |
| Kyoto | Summer is the off-season, but inbound demand provides support. Gion Festival (July) effect as well. | ¥46,000 | +4.6% | Slow |
| Okinawa | Peak summer top season. Early August ADR in the ¥57,000 range. | ¥55,500 | +10.9% | Moderate |
| Nagano | High-priced resort demand from Karuizawa. Obon peak around ¥62,100. | ¥62,100 | +14.1% | Slow |
Source: MetroEngines Research, compiled by HotelBank Editorial Team
Recommended Dates and Regions to Book Now
Finally, we offer recommendations for “high cost-performance dates” based on the data as of April 25. The judgments below combine both the YoY ADR change and the sold-out rate for an integrated view.
Sweet Spot 1: Tokyo, August 17–23 (Weekday Stays)
After Obon, Tokyo’s sold-out rate eases to 23–24%, and ADR settles around ¥35,500—roughly 10% below Obon. With inbound demand keeping a steady year-round floor, dramatic price collapses are unlikely, but YoY for this week is just +3.5%, so the price increase is also limited. For Tokyo travel, post-Obon weekday stays offer the best balance.
Sweet Spot 2: Kyoto, August 17–26
Kyoto is in its summer off-season due to the heat, which keeps the sold-out rate low at 14.8–15.9%. ADR is also relatively contained at ¥38,300–40,200—modest for August. While YoY is up at +7.9–+8.3%, this is an opportunity to enjoy a quieter Kyoto in between inbound peaks, after the Gion Festival has wound down.
Sweet Spot 3: Okinawa, August 24 Onward
Okinawa’s ADR drops sharply in late August. The average ADR from August 24 onward is ¥45,600—roughly 20% below the period peak (¥57,000 on August 8). Sold-out rates ease to 15–17%, and if you can lock in dates right before the September school term begins, the cost benefit is substantial.
Caution Required: Nagano, Obon (August 8–15)
Despite Nagano’s Obon ADR being the highest of the five regions at ¥62,100, the sold-out rate sits at just 14.6%. This suggests prices may be set ahead of demand. If inventory fails to fill ahead of the date, last-minute discounts are possible—so we recommend reconfirming pricing in June or July rather than booking early. That said, popular Karuizawa properties often sell out early, so strategy will depend on the specific facility.
Book Early: Hokkaido, Early August (especially 8/8–13)
In Hokkaido, the sold-out rate spikes to 24.7% on Wednesday, August 13 (Obon). Having a quarter of properties already booked as of April is a remarkably fast pace for a resort region. ADR is also on the rise at around ¥48,300, and given the +10.2% YoY momentum, popular areas (Furano, Otaru, Hakodate, etc.) call for early reservations.
Macro Backdrop: ¥2.3 Trillion in Inbound Spending and the Weak Yen
For context on this summer’s price gains, it’s worth noting the macro environment. According to the Japan Tourism Agency, inbound travel spending in Q1 2026 (January–March) hit ¥2.3378 trillion, a record high for any quarter. JNTO statistics also show 3.46 million inbound visitors in February 2026 (+6.4% YoY), indicating sustained strength.
This structural increase in inbound demand is lifting per-room rates particularly along the “Golden Route” of Tokyo, Kyoto, and Hokkaido. Meanwhile, with rising prices and lagging real wages, domestic travelers are increasingly choosing “near and short” trips—JTB’s survey reported only a marginal rise to 23.9 million domestic GW 2026 travelers.
A similar pattern is expected for the summer holidays: domestic travelers will shorten their trips while shifting toward higher-value experiences—”if we’re going, let’s stay somewhere nice”—and this is likely to continue pushing resort-region ADRs upward.
Conclusion
From the MetroEngines Research data as of April 25, our five-region analysis of the 2026 summer hotel market reveals three key findings.
First, price increases in resort-type regions (Nagano, Okinawa, Hokkaido) are pronounced, with YoY gains in the +9 to +14% range—near double-digit growth. Second, Tokyo has the highest sold-out rate and the fastest booking pace, but ADR growth is mild at +2.8%, making the polarization between urban and resort markets increasingly stark. Third, despite Nagano’s high pricing, its sold-out rate remains low—leaving room for price adjustments depending on how reservations develop from here.
For travelers planning summer accommodations, late August in Okinawa and Kyoto—avoiding the Obon peak—offers the best price advantage, while popular areas in Hokkaido reward early booking. HotelBank will continue to provide updates based on the latest data in June and July.
Note on Future-Date ADRs: The ADRs in this article reflect the average of prices publicly listed on OTAs at the time of survey (April 2026), and they will continue to fluctuate as check-in dates approach. In particular, Kyoto may face the rebound effect from the demand boost generated by Expo 2025 Osaka-Kansai (the so-called “Expo loss”). Be aware that prices set high now could fall through last-minute discounts.