

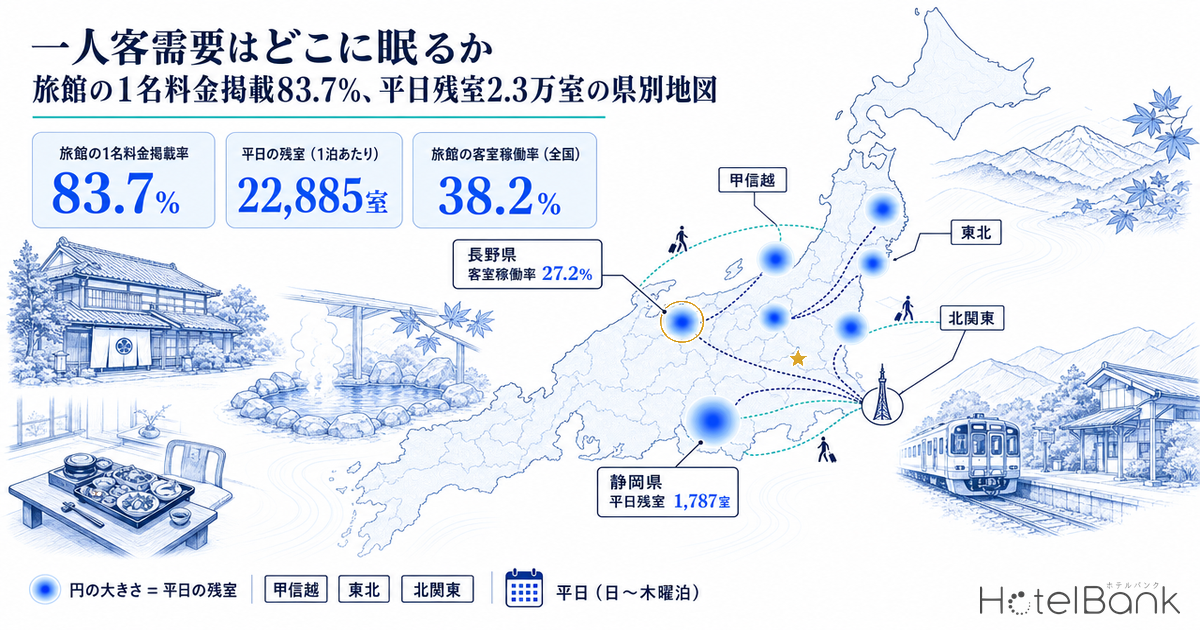
Japan’s domestic lodging demand has entered a phase where its composition matters more than its total volume. According to the Japan Tourism Agency (JTA) Overnight Travel Statistics Survey (2025 annual, final figures), overnight stays by Japanese residents fell 2.7% year on year to 481.18 million guest nights, while the room occupancy rate of ryokan (traditional Japanese inns) that year stood at just 38.2% — roughly half that of business hotels (75.3%). How well is the accommodation type with the most empty rooms actually capturing solo travelers? This article combines 8,536,571 guest reviews from the last 24 months, listed 1-guest and 2-guest rates for 33,656 properties, and inventory trends for a fixed panel of 3,387 ryokan to quantify, by prefecture and property type, where and how much solo-guest demand remains untapped.
Metric Definitions Used in This Article
- Solo-travel mention rate: The share of guest reviews posted in the last 24 months (October 2024 – September 2026) that speak positively in a solo-travel / traveling-alone context. It measures how often solo stays are talked about, not a rating score; a higher or lower mention rate does not imply higher or lower satisfaction. Reviews include languages other than Japanese.
- 1-guest rate listing rate: For the 14 nights with check-in from October 19 to November 1, 2026, the share of properties listing a 1-guest rate for at least one night among properties listing a 2-guest rate for seven or more nights (listings as of September 29, 2026).
- 1-guest / 2-guest rate ratio: The property-level median of the lowest listed 1-guest rate divided by the lowest listed 2-guest rate over the same period. Both are listed per-room rates (tax included), not transacted prices.
- OCC (occupancy): The share of rooms sold relative to total rooms in the area (an estimate based on OTA sales inventory). Because it reflects how OTA-listed inventory is absorbed, it differs from a property’s actual overall occupancy. This article uses values observed on the day before check-in.
- Room occupancy rate (JTA): The figure published in the JTA Overnight Travel Statistics Survey. It reflects whole-property results and differs in definition and population from the estimated OCC above, so the two are not compared directly.
- Data sources: MetroEngines Research / HotelBank Editorial Team (NLP analysis of guest reviews) / Japan Tourism Agency
- — Ryokan 1.14% Across 8,536,571 guest reviews from the last 24 months, ryokan have a higher solo-travel mention rate than business hotels (0.81%). By raw count, business hotels lead with 31,140 mentions.
- — In-room dining, quiet, hot springs, value Solo-travel reviews of ryokan mention hot springs (18.61%), value for money (12.33%) and quietness (2.52%) — all more often than couple or family reviews do.
- — 83.7% The share of ryokan listing a 1-guest rate (check-in October 19 – November 1, 2026; N=6,770 properties). For ryokan with fewer than 10 rooms it is 73.4%, so the headroom is concentrated in small inns.
- — 62.8% The median 1-guest / 2-guest rate ratio for ryokan (business hotels: 75.3%). Rate design splits by price band, from 56.9% for ryokan under ¥20,000 to 91.4% for those at ¥80,000 and above.
- — 22,885 rooms Rooms still unsold the day before check-in per weekday night (Sunday–Thursday stays) across a fixed panel of 3,387 ryokan — about 4,300 more than on weekends, with the most room to grow in Nagano, Niigata, Iwate and Fukushima.
74,317 of 8,536,571 Reviews Come from Solo Guests — Volume at Business Hotels, Intensity at Capsules and Ryokan
Let us first outline the demand side. Of the 8,536,571 guest reviews from the last 24 months compiled by the HotelBank Editorial Team (42,394 properties nationwide), 74,317 — 0.87% of the total — spoke positively in a solo-travel or traveling-alone context. A figure below 1% may look small, but most reviews say nothing about companions or purpose, so what is captured here is limited to reviews that explicitly state the guest came alone. This ratio is therefore best read not as the actual number of solo guests, but as an indicator of how many touchpoints solo guests feel compelled to write about.
Broken down by property type, the picture becomes clear. Capsule hotels have the highest mention rate (3.23%), followed by hostels/guesthouses (1.26%) and ryokan (1.14%). Business hotels stand at 0.81%, resort hotels at 0.55% and city hotels at 0.47%. By count, however, business hotels account for 31,140 mentions — 41.9% of the total — far exceeding ryokan’s 16,786 (22.6%). In short, the volume of solo guests sits with business hotels, while the propensity to be talked about concentrates in capsule hotels and ryokan.
Source: HotelBank Editorial Team research (NLP analysis of guest reviews, October 2024 – September 2026, N=8,536,571 reviews / 42,394 properties)
| Property type | Properties | Reviews | Solo-travel mentions | Mention rate |
|---|---|---|---|---|
| Capsule hotels | 258 | 123,762 | 3,999 | 3.23% |
| Hostels / guesthouses | 5,237 | 483,825 | 6,104 | 1.26% |
| Ryokan | 8,825 | 1,476,269 | 16,786 | 1.14% |
| Business hotels | 8,574 | 3,826,712 | 31,140 | 0.81% |
| Resort hotels | 1,945 | 814,943 | 4,485 | 0.55% |
| City hotels (incl. deluxe) | 1,437 | 1,247,653 | 5,828 | 0.47% |
| Total (incl. other types) | 42,394 | 8,536,571 | 74,317 | 0.87% |
Source: HotelBank Editorial Team research (NLP analysis of guest reviews, October 2024 – September 2026)
That ryokan outscore business hotels on mention rate carries a strong message for operators. Ryokan are still widely seen as places for two or more guests, yet in reviews the presence of solo guests is already stronger than at business hotels. A national ranking of properties talked about in a solo context, and how that relates to price bands, is covered in our earlier nationwide map of solo-travel mentions; this article shifts the focus to supply-side readiness and how inventory is left unsold.
What Solo Ryokan Guests Talk About: In-Room Dining, Quiet, Hot Springs and Value
So what do solo guests value in a ryokan? We split ryokan reviews into three contexts — solo travel, couples and families — and compared how often related attributes are mentioned alongside each. There are 16,786 solo-travel reviews, 37,197 couple reviews and 94,296 family reviews. The number of attributes mentioned per review is nearly identical — 6.56 for solo, 6.66 for couples and 6.54 for families — so comparing attribute shares directly introduces little distortion from differences in review length.
The results were clear. In-room dining is mentioned in 3.06% of solo-travel reviews, ahead of couples (2.56%) and families (2.38%). Quietness reaches 2.52%, more than twice the family figure (1.20%). Hot springs (18.61%, vs. 14.64% for couples) and value for money (12.33%, vs. 9.77%) are likewise mentioned most by solo guests. Japanese-style (tatami) rooms come in at 2.75%, roughly level with families (2.69%). Conversely, private baths (7.74%) and breakfast buffets (4.99%) are attributes that families and couples talk about more.
Source: HotelBank Editorial Team research (ryokan guest reviews, October 2024 – September 2026; solo N=16,786, couples N=37,197, families N=94,296)
Reviews include comments such as “a solo trip to an inn with hot springs and two meals,” “an atmosphere where I could relax without worrying about others,” and “traveling alone, I treated myself to somewhere a little nicer…”. The combination of in-room dining — eating without being watched — a quiet setting and hot springs is, for solo guests, the very reason to choose a property. The standard ryokan layout, where everything through dinner is completed in a private tatami room, appears inherently well suited to solo demand. For where in-room dining survives, see also our nationwide survey of ryokan that still offer in-room dining.
Looking across property types, solo guests have one more axis of interest. Across all types, station proximity appears in 20.79% of solo-travel reviews — more than twice the couple figure (8.80%) and close to the business-trip context (24.45%). Even at ryokan, station proximity reaches 7.51% in solo reviews, more than double the couple rate (3.29%). For solo guests traveling by public transport, shuttle service and the route from the station are evaluation criteria even at ryokan.
Current Readiness — 83.7% of Ryokan List a 1-Guest Rate, 73.4% Among Those with Fewer than 10 Rooms
Next, the supply side: how far are properties set up to be booked by one person? For the 14 nights with check-in from October 19 to November 1, 2026, we took the 33,656 properties listing a 2-guest rate for seven or more nights as the population and checked whether a 1-guest rate was listed. Business hotels (99.7%), city hotels (99.6%), hostels/guesthouses (98.0%) and resort hotels (96.6%) can almost all be booked by a single guest. For ryokan, 5,666 of 6,770 properties did so — 83.7%.
Given that ryokan typically charge per person with two meals included and a certain number do not offer 1-guest rates at all, a level above 80% is arguably higher than expected. Readiness is already widespread; where differences appear is by size. The 1-guest rate listing rate is 73.4% for ryokan with fewer than 10 rooms, 81.2% for 10–19 rooms, 92.6% for 20–49 rooms, and around 97% for 50 rooms or more. It is natural for smaller inns to be more cautious about giving a whole room to one guest — and this is precisely where the headroom for welcoming solo guests is concentrated.
Source: Compiled by MetroEngines Research and the HotelBank Editorial Team (check-in October 19 – November 1, 2026; listings as of September 29, 2026; N=33,656 properties, of which 6,770 ryokan)
By day of week, ryokan 1-guest rates are more plentiful on weekdays. Among nights with a listed 2-guest rate, the share that also had a 1-guest rate was 82.0% for Sunday–Thursday stays and 78.0% for Friday–Saturday stays. This suggests a practice of prioritizing bookings of two or more on weekends while accepting single guests on weekdays has spread to some extent. Many plan names also feature “weekdays only” or “solo travel,” indicating that the idea of positioning solo guests as weekday demand is already becoming shared on the ground.
What Share of the 2-Guest Rate Is the 1-Guest Rate? Ryokan 62.8%, Business Hotels 75.3%
Differences by property type also show up in rate design. The median ratio of the lowest listed 1-guest rate to the lowest listed 2-guest rate (per room, tax included) was 62.8% for ryokan, 75.3% for business hotels, 80.0% for resort hotels, 81.9% for city hotels, 90.9% for hostels/guesthouses and 49.8% for capsule hotels. Hotels that price by the room charge a single guest 70–80% of the 2-guest rate, while ryokan, which price by the person, stay just above 60%. On that basis, the per-person price paid by a solo ryokan guest works out to about 1.26 times the per-person price when two stay together. Rebuilding room mix and pricing around the composition of the guest base — rather than treating the 2-guest rate as the default — is a natural next step for operators reading these figures.
Within ryokan, rate design varies widely by price band. For ryokan whose lowest 2-guest rate is under ¥20,000, the median 1-guest / 2-guest ratio is 56.9%, meaning single guests are taken at roughly the per-person rate. The ratio rises to 67.5% at ¥20,000–30,000, 78.7% at ¥30,000–50,000, 84.7% at ¥50,000–80,000 and 91.4% at ¥80,000 and above: the higher the price band, the closer the 1-guest rate is set to a full room’s worth. Higher-priced ryokan also have a relatively low 1-guest listing rate — 74.6% in the ¥30,000–50,000 band — so there is still room to refine how rates are set to welcome solo guests while protecting room revenue.
| Ryokan price band (lowest 2-guest rate, per room) | Properties | 1-guest rate listing rate | 1-guest / 2-guest ratio (median) |
|---|---|---|---|
| Under ¥20,000 | 3,195 | 90.0% | 56.9% |
| ¥20,000–30,000 | 1,506 | 81.6% | 67.5% |
| ¥30,000–50,000 | 1,314 | 74.6% | 78.7% |
| ¥50,000–80,000 | 479 | 76.0% | 84.7% |
| ¥80,000 and above | 219 | 82.2% | 91.4% |
Source: Compiled by MetroEngines Research and the HotelBank Editorial Team (check-in October 19 – November 1, 2026; listings as of September 29, 2026; price bands based on the lowest listed 2-guest rate; N=6,713 properties)
By prefecture, the business-hotel 1-guest / 2-guest ratio is high in Kyoto (89.7%), Tokyo (87.2%), Okinawa (85.4%) and Osaka (84.9%), and low in Shimane (62.6%) and Nagano (63.4%). The pattern is that in urban areas with strong demand, including from international visitors, 1-guest rates are also set with a “what can this room sell for” mindset.
Ryokan Inventory Left Unsold on Weekdays — 22,885 Rooms per Night in a Fixed Panel
How much room is there, in volume terms, to take in solo guests? For a fixed panel of ryokan whose inventory we track continuously (3,387 properties / 94,747 rooms, based on listings on major booking sites, covering 46 prefectures excluding Okinawa), we aggregated check-in dates from September 1 to 28, 2026, excluding the Silver Week holidays (September 19–23). Estimated OCC was 75.8% for Sunday–Thursday stays and 80.4% for Friday–Saturday stays, and rooms remaining the day before check-in averaged 22,885 per weekday night versus 18,600 per weekend night. In other words, about 4,300 more rooms per night are left in inventory on weekdays than on weekends.
These unsold rooms also depend on how inventory is allocated across sales channels and released, so they do not by themselves mean demand is weak. Even so, taken together with the JTA’s published ryokan room occupancy rate of just 38.2% (2025), they suggest considerable room to broaden readiness in ryokan weekday inventory. Solo guests include many who can travel on weekdays, and they rarely compete with weekend bookings of two or more. Opening vacant weekday rooms to single guests can be a way to build occupancy without cannibalizing existing demand.
Source: Compiled by MetroEngines Research and the HotelBank Editorial Team (fixed ryokan panel, check-in September 1–28, 2026, excluding September 19–23; weekday = Sunday–Thursday stays; top 10 prefectures by weekday unsold rooms)
Prefecture Map — Where Solo Guests Talk and Rooms Have Capacity
Finally, we overlay the demand side (ryokan solo-travel mention rate) and the supply side (JTA ryokan room occupancy rate and panel weekday unsold rooms) by prefecture. With ryokan room occupancy on the horizontal axis and the ryokan solo-travel mention rate on the vertical axis, the upper-left quadrant — prefectures where solo guests talk about stays often but room occupancy is below the median (39.8%) — can be positioned as the area with the greatest upside from broadening solo-guest readiness.
Source: Compiled from the JTA Overnight Travel Statistics Survey (2025 annual, final figures), HotelBank Editorial Team research (ryokan guest reviews, October 2024 – September 2026) and MetroEngines Research. Bubble size = unsold rooms per weekday night (fixed ryokan panel). Okinawa excluded due to the small number of ryokan in the panel.
Prefectures in this quadrant include Nagano, Niigata, Fukushima, Iwate, Akita, Ibaraki, Aichi, Nara, Kagoshima, Tokushima, Saga and Saitama. Nagano stands out: a ryokan room occupancy rate of 27.2%, a solo-travel mention rate of 1.24% and 1,066 unsold panel rooms per weekday night — all three indicators point to large upside. Niigata (occupancy 28.4% [January–December 2025, JTA], mention rate 1.39%, 551 weekday unsold rooms), Iwate (36.8%, 1.46%, 744 rooms) and Fukushima (37.1%, 1.34%, 574 rooms) show the same pattern. Hot-spring areas in Tohoku and Koshinetsu already have a foundation of being talked about by solo guests, along with spare weekday room capacity.
Shizuoka, meanwhile, has the most weekday unsold rooms in the country at 1,787 per night, and 45 of its 258 ryokan with 100+ reviews rank in the national top 10% for solo-travel mention rate (2.35% or higher). It is a prefecture with both a deep bench of properties solo guests talk about and a large volume of rooms available on weekdays. Gunma (36 properties in the top 10%, 1,043 weekday unsold rooms) and Kanagawa (34 properties, 853 rooms) are similar, suggesting a structure in which solo demand gathers at hot-spring areas reachable by public transport from the Tokyo metropolitan area.
| Prefecture | Ryokan solo-travel mention rate | Ryokan in top 10% by mention rate | Ryokan room occupancy (JTA) | Weekday estimated OCC | Weekday unsold rooms / night | 1-guest rate listing rate |
|---|---|---|---|---|---|---|
| Shizuoka | 1.28% | 45/258 | 42.4% | 78.5% | 1,787 | 79.8% |
| Tochigi | 1.11% | 20/152 | 44.9% | 79.4% | 1,157 | 81.8% |
| Nagano | 1.24% | 36/242 | 27.2% | 83.3% | 1,066 | 85.1% |
| Gunma | 1.48% | 36/146 | 45.9% | 81.0% | 1,043 | 77.4% |
| Hokkaido | 0.87% | 17/191 | 43.9% | 86.1% | 1,015 | 94.8% |
| Ishikawa | 0.96% | 5/73 | 35.2% | 72.0% | 985 | 91.5% |
| Kanagawa | 1.29% | 34/181 | 49.0% | 79.8% | 853 | 83.7% |
| Oita | 1.06% | 22/170 | 43.3% | 76.0% | 842 | 85.5% |
| Mie | 1.01% | 13/90 | 39.8% | 74.5% | 799 | 76.1% |
| Iwate | 1.46% | 21/70 | 36.8% | 78.3% | 744 | 94.2% |
| Yamanashi | 0.73% | 7/96 | 34.4% | 73.4% | 729 | 86.9% |
| Miyagi | 1.41% | 17/64 | 46.7% | 75.1% | 679 | 83.5% |
| Fukushima | 1.34% | 21/104 | 37.1% | 85.5% | 574 | 81.7% |
| Niigata | 1.39% | 14/90 | 28.4% | 83.0% | 551 | 84.0% |
| Yamagata | 1.58% | 22/100 | 40.2% | 81.4% | 520 | 86.6% |
Source: Compiled from the JTA Overnight Travel Statistics Survey (2025 annual, final figures), HotelBank Editorial Team research (ryokan guest reviews, October 2024 – September 2026) and MetroEngines Research. “Ryokan in top 10% by mention rate” = number of ryokan with 100+ reviews whose solo-travel mention rate is in the national top 10% (2.35% or higher) / number of ryokan with 100+ reviews. Weekday estimated OCC and weekday unsold rooms are from the fixed ryokan panel (Sunday–Thursday stays, check-in September 1–28, 2026, excluding September 19–23). Top 15 prefectures by weekday unsold rooms shown.
Notably, at the prefecture level there is almost no correlation between the 1-guest rate listing rate and the solo-travel mention rate (correlation coefficient −0.06). Prefectures with a higher share of properties bookable by one person are not necessarily the ones solo guests talk about. Offering readiness is only the entry point; whether solo guests actually choose a property appears to depend on what is designed into the stay — in-room dining, quiet, and the route from the station.
Operator and Investor Perspective — Three Issues in Turning Solo Guests into Weekday Occupancy
Based on the above, capturing solo-guest demand comes down to three issues. The first is making weekday acceptance of single guests explicit. Ryokan list 1-guest rates on 82.0% of weekday nights, but among small ryokan with fewer than 10 rooms the property-level listing rate is only 73.4%. Opening 1-guest rates only for vacant weekday rooms allows occupancy to be built without competing with weekend sales to parties of two or more.
The second is how rates are set. The median ryokan 1-guest / 2-guest ratio is 62.8%, but it ranges widely — 78.7% in the ¥30,000–50,000 band and 91.4% at ¥80,000 and above. The motive expressed in solo reviews — “treating myself to somewhere a little nicer” — shows that single-guest demand can hold up even at higher price points. There appears to be scope for designs tailored to each price band, such as setting 1-guest rates only on weekdays while protecting per-room rates.
The third is building what solo guests talk about into the product. In-room dining, quiet, hot springs and value for money were mentioned more in the solo-travel context at ryokan than by families or couples. Inns that retain in-room dining or have a quiet location can repurpose those assets directly into appeals aimed at solo guests. From an investment standpoint, in prefectures such as the hot-spring areas of Nagano, Niigata and Tohoku — where solo guests already talk about stays and room occupancy has spare capacity — operational improvements that help small ryokan accommodate single guests merit consideration as upside that requires little additional capital expenditure.
For properties: plan-naming hints for this theme
Common selling points in publicly listed ryokan × solo-travel plan names (N=1,070) ——
Solo travel 89%Kaiseki course 23%Open-air hot spring 22%Two meals included 20%Breakfast included 14%Early-bird discount 11%
Actual name examples (anonymized, translated):
- [Weekdays only] ¥3,300 off! Dinner & breakfast served in-room ◆ Last-minute deal [Kaiseki] Solo travel plan
- [A grown-up solo retreat] Detached room with private open-air bath and full ocean view — golden-eye snapper and seasonal kaiseki [dinner & breakfast in-room]
- [Weekdays only] Wi-Fi throughout the property ♪ Western-style room, room-only plan [business travelers, solo travelers and students welcome]
*Trends based on an aggregation of publicly listed plan names; they do not indicate that naming causes sales.
Summary
In reviews from the last 24 months, the share of reviews in a solo-travel context was 1.14% for ryokan, above business hotels (0.81%). Solo ryokan guests mention in-room dining, quiet, hot springs and value for money more than families and couples do, and the standard ryokan format is inherently well suited to solo demand. Readiness is also spreading — 83.7% of ryokan list a 1-guest rate — but among inns with fewer than 10 rooms the figure is 73.4%, and that is where the headroom lies.
On the supply-demand side, 22,885 rooms per weekday night remain unsold the day before check-in across the fixed panel of 3,387 ryokan — about 4,300 more than on weekends. In prefectures such as Nagano, Niigata, Fukushima and Iwate, where solo guests already talk about stays and room occupancy has spare capacity, designing for single guests on weekdays can be a realistic lever to build occupancy. Amid shrinking total domestic demand, solo guests are one of the few demand segments that pair easily with weekday rooms.
⚠ Note on listed rates for future dates: The 1-guest and 2-guest listed rates in this article are based on selling prices published as of the survey date (September 29, 2026) for check-in from October 19 to November 1, 2026. Please note that they may change as check-in approaches, due to new plans being added or prices being adjusted.
Methodology
Guest reviews compiled by the HotelBank Editorial Team were classified by NLP analysis into contexts such as solo travel, couples and families, and into attributes such as in-room dining, quietness, Japanese-style rooms and hot springs. The solo-travel mention rate counts only mentions in a positive context. Property types are based on each property’s registered type; hostels/guesthouses combine hostels, guesthouses, dormitories and youth hostels. Listed rates were aggregated per property for 1-guest and 2-guest occupancy for check-in from October 19 to November 1, 2026, for properties nationwide. Estimated OCC and unsold rooms are values as of the day before check-in for a fixed panel of ryokan whose inventory is tracked continuously (3,387 properties / 94,747 rooms, based on listings on major booking sites).
Frequently Asked Questions
Q. Which property type has the most solo-travel reviews?
A. By count, business hotels have the most, with 31,140 (41.9% of the total). However, as a share of all reviews, the solo-travel mention rate ranks capsule hotels (3.23%), hostels/guesthouses (1.26%) and ryokan (1.14%) above business hotels (0.81%) (October 2024 – September 2026, N=8,536,571 reviews).
Q. How many ryokan list a 1-guest rate?
A. Of the 6,770 ryokan listing a 2-guest rate for seven or more nights for check-in from October 19 to November 1, 2026, 5,666 — 83.7% — also listed a 1-guest rate. The figure is 73.4% for ryokan with fewer than 10 rooms and around 97% for those with 50 rooms or more.
Q. What share of the 2-guest rate do ryokan charge a single guest?
A. The median ratio of the lowest listed 1-guest rate to the lowest listed 2-guest rate is 62.8%, which per person works out to about 1.26 times the price when two stay together. It is 56.9% for ryokan with 2-guest rates under ¥20,000 and 91.4% for those at ¥80,000 and above — the higher the price band, the closer the 1-guest rate is to a full room’s worth.
Q. How many ryokan rooms go unsold on weekdays?
A. In a fixed panel of 3,387 ryokan (94,747 rooms) whose inventory is tracked continuously, rooms remaining the day before check-in averaged 22,885 per night for Sunday–Thursday stays with check-in from September 1 to 28, 2026 (excluding September 19–23). That is about 4,300 more than the 18,600 for Friday–Saturday stays.
Q. Which prefectures have the most room to broaden solo-guest readiness?
A. Prefectures such as Nagano, Niigata, Iwate and Fukushima, where the ryokan solo-travel mention rate is high and the JTA ryokan room occupancy rate (2025) is below the prefectural median. Shizuoka, Gunma and Kanagawa have many ryokan in the national top 10% for solo-travel mention rate as well as many unsold weekday rooms.
Related Articles
- Solo Travel Hits 18.0%: Japan’s Solo-Mention Map from 25,076 Reviews
- In-Room Dining Ryokan TOP 30: 58.3% Still Offer It, ADR +91%
References and Sources
■ Data sources
NLP analysis of guest reviews (last 24 months, 8,536,571 reviews, 42,394 properties); listed 1-guest and 2-guest rates nationwide (check-in October 19 – November 1, 2026; listings as of September 29, 2026; N=33,656 properties); inventory trends for a fixed ryokan panel (3,387 properties / 94,747 rooms); JTA Overnight Travel Statistics Survey (2025 annual, final figures).
■ Calculation assumptions
The 1-guest rate listing rate uses as its population properties with a 2-guest rate listed for at least 7 of 14 nights, and measures the share with a 1-guest rate on at least one night. The 1-guest / 2-guest ratio is the median of property-level ratios of the lowest listed rates (per room, tax included). Weekday unsold rooms are the per-night average of rooms remaining the day before check-in for Sunday–Thursday stays, excluding Silver Week (September 19–23).
■ Limitations
The solo-travel mention rate is not the actual number of solo guests but the share of positive reviews that explicitly state the guest came alone, and it does not indicate satisfaction. Listed rates are not transacted prices, and future dates are subject to change. Estimated OCC and unsold rooms are estimates based on OTA sales inventory and differ in definition and population from the JTA room occupancy rate. Okinawa was excluded from prefecture comparisons due to the small number of ryokan in the panel.
- Japan Tourism Agency, “Overnight Travel Statistics Survey (2025 annual, final figures)” (published July 6, 2026)
- Japan Tourism Agency, Overnight Travel Statistics Survey — statistics page
- Japan Tourism Agency, Travel and Tourism Consumption Trend Survey — statistics page
- Travel Voice, “Travel and Tourism Consumption Trend Survey: 2025 final results” (April 30, 2026)
- HotelBank Editorial Team research — NLP analysis of guest reviews (October 2024 – September 2026, N=8,536,571 reviews / 42,394 properties)
- MetroEngines Research — listed 1-guest and 2-guest rates (N=33,656 properties); estimated OCC and unsold rooms for the fixed ryokan panel (3,387 properties / 94,747 rooms)