

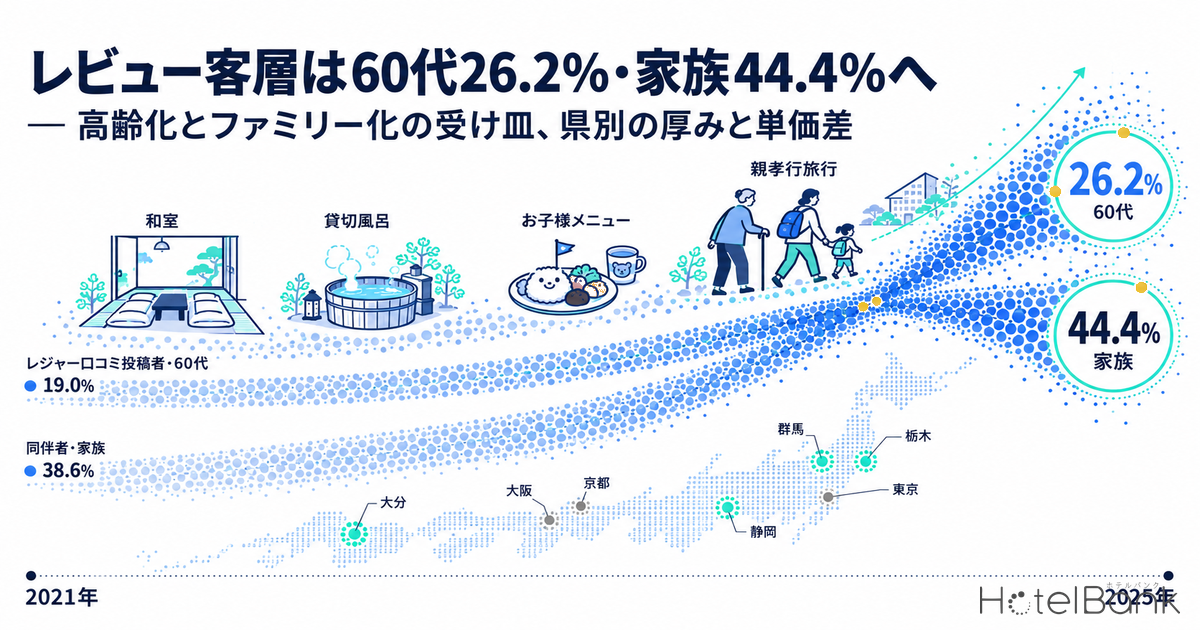
Tracking the attributes attached to guest reviews from 2021 to 2025 shows that people in their 60s rose from 19.0% to 26.2% of leisure reviewers, and people in their 70s from 4.5% to 7.5%. On the companion side, “family” grew from 38.6% to 44.4%, drawing level with solo travelers (44.7%). An upward age shift and a shift toward family travel are happening at the same time. One caveat: these figures describe the people who wrote reviews, not travelers as a whole, and reviewers skew older. With that caveat in mind, this article sets the review data side by side with the age structure in the Japan Tourism Agency’s (観光庁) Travel and Tourism Consumption Trend Survey to disclose where the two agree and where they diverge. It then uses MetroEngines Research data to measure how deep the facilities this shift demands — Japanese-style rooms, private baths, children’s menus and support for trips with elderly parents — run in each prefecture, and how much listed rates differ between properties that offer them and those that do not.
Metric Definitions Used in This Article
- Review attributes (purpose, companions, age band): annual composition of the attributes attached to guest reviews posted on major Japanese booking sites, based on reviewers’ self-reported data. These are the attributes of people who posted reviews, not a representative sample of all travelers. Age bands skew toward older reviewers, and every chart in this article should be read on that basis. Annual counts are 408,000–740,000 reviews for purpose and companions, and 124,000–208,000 for age band (leisure).
- Comparison with official statistics: the Japan Tourism Agency’s Travel and Tourism Consumption Trend Survey (final annual figures for 2021, 2024 and 2025), using domestic overnight trips (cumulative travelers; sightseeing/recreation and business purposes) converted into age shares for people in their 20s and older.
- Mention rate: the share of 8,665,496 domestic guest reviews posted over the latest 24 months (October 2024–October 2026) that, according to semantic natural-language analysis, refer to a given facility or use case. It measures how often a topic is mentioned, not a rating score.
- Listed price: the per-room rate (tax included) for 2 guests in 1 room for check-ins from November 14 to 20, 2026, averaged per property, with the median shown for each group. This is the selling price at the time of the survey, not an estimated settled ADR.
- Data sources: MetroEngines Research (review attributes, mention rates, listed prices); Japan Tourism Agency, Travel and Tourism Consumption Trend Survey (official statistics)
- — Among leisure reviewers, people in their 60s rose from 19.0% to 26.2% and those in their 70s from 4.5% to 7.5% (2021→2025). Family companions grew from 38.6% to 44.4%, level with solo travelers at 44.7%.
- — Against the Japan Tourism Agency survey, the direction matches, but reviews overstate people in their 50s by +10.9pt and 60s by +9.9pt, and understate their 20s by -15.0pt and 70s+ by -7.7pt. Grouped as 50s and over, the five-year change is close: +8.2pt vs +6.8pt.
- — Mention rates for the seven family/senior-friendly items are highest in hot-spring prefectures such as Tochigi (No. 1 for traveling with children at 2.80%, pets 2.68% and children’s menus 0.45%) and Gunma (private baths 6.21%). Tokyo ranks last of 47 prefectures on six of the seven items.
- — Properties selling rooms for 4 or more guests have median listed prices +28.7% (business) to +44.6% (ryokan) higher (4,803 properties in 9 prefectures, check-ins November 14–20, 2026). This includes differences in room size and grade and is not purely the effect of family readiness.
- — Start with operational changes that need no capex — staggered dinner seatings and selling rooms at 4-guest occupancy — then move, in order of investment size, to children’s menus, step-free access, bookable private bath slots, connecting rooms and Japanese-Western room conversions.
Leisure Reviewers in Their 60s Reach 26.2%, 40s Fall to 20.7% — Reviewer Age Trends
We start with the facts. Broken down by age band, leisure reviewers in their 60s went from 19.0% in 2021 to 26.2% in 2025, up 7.2pt, and those in their 70s expanded from 4.5% to 7.5%. Meanwhile, people in their 40s shrank from 24.7% to 20.7%, their 30s from 12.5% to 10.9%, and their 20s from 5.8% to 3.4%. People in their 50s slipped slightly from 33.4% to 31.4% but remained the largest group. Over five years, the movement was one-directional: the under-60 bands shrank while the 60-and-over bands grew.
Source: MetroEngines Research; compiled by HotelBank Editorial Team (leisure reviewers, N=132,426 in 2021 to 124,011 in 2025). *Attributes in this chart are those of guests who posted reviews and do not represent all travelers. Reviewers skew toward older age groups.
Business travel looks different. People in their 50s stayed nearly flat at a high level, from 43.0% (2021) to 42.7% (2025), peaking at 43.5% in 2024. What moved was the 60s band, which rose 7.6pt from 17.7% to 25.3%. People in their 40s retreated from 27.0% to 20.6%. Business reviewers are now best described as “a core of people in their 50s, with a thickening layer in their 60s.”
Source: MetroEngines Research; compiled by HotelBank Editorial Team (business reviewers, N=38,165 in 2021 to 31,355 in 2025). *Attributes in this chart are those of guests who posted reviews and do not represent all travelers. Reviewers skew toward older age groups.
Solo 44.7% and Family 44.4% Draw Level; Couples Fall to 3.9%
Companion composition was reshuffled over the same five years. Solo travelers declined gradually from 46.5% to 44.7%, while family rose 5.8pt from 38.6% to 44.4%, narrowing the gap between the two to just 0.3pt in 2025. Couples fell from 6.8% to 3.9%, friends from 4.9% to 4.5% and colleagues from 2.4% to 2.0%. By purpose, leisure expanded from 69.7% to 74.7%, while business shrank from 22.5% to 20.5% and other purposes from 7.9% to 4.8%. As far as the reviewer base shows, the center of gravity of the lodging market is moving toward family leisure travel.
Companions (all purposes)
Purpose
Source: MetroEngines Research; compiled by HotelBank Editorial Team (N=488,357 in 2021 to 407,874 in 2025). *Attributes in this chart are those of guests who posted reviews and do not represent all travelers. Reviewers skew toward older age groups.
Note that across reviews from all booking sites including nationality data, the share of international visitors jumped from 14.8% in 2022 to 41.2% in 2023 and 44.5% in 2024, and stood at 38.2% in 2025 (N=4,280,494 in 2025). The purpose, companion and age-band figures in this article are limited to attributes from domestic sites, so the shares shown here are best read as a picture of domestic guests, mainly Japanese residents.
Side by Side with the Japan Tourism Agency’s Age Structure — Same Direction, +9.9pt Higher for the 60s
Next, we check how well review attributes reflect reality by comparing them with official statistics. According to the Japan Tourism Agency’s Travel and Tourism Consumption Trend Survey (2025 final figures), domestic overnight trips for sightseeing and recreation totaled 149,097 thousand cumulative travelers aged 20 and over, split as follows: 20s 18.4%, 30s 13.9%, 40s 15.8%, 50s 20.5%, 60s 16.3% and 70s+ 15.2%. The 2025 shares among leisure reviewers were 20s 3.4%, 30s 10.9%, 40s 20.7%, 50s 31.4%, 60s 26.2% and 70s 7.5%.
Source: Japan Tourism Agency, Travel and Tourism Consumption Trend Survey, 2025 annual figures (final), Table 11 (domestic overnight trips, sightseeing/recreation, 149,097 thousand cumulative travelers aged 20+); MetroEngines Research (leisure reviewers, N=124,011). *Attributes in this chart are those of guests who posted reviews and do not represent all travelers. Reviewers skew toward older age groups.
| Age band | Leisure reviewers 2025 | JTA overnight trips (sightseeing/rec.) 2025 | Gap (pt) | JTA change 2021→2025 (pt) |
|---|---|---|---|---|
| 20s | 3.4% | 18.4% | -15.0 | -1.2 |
| 30s | 10.9% | 13.9% | -3.0 | -2.4 |
| 40s | 20.7% | 15.8% | +4.9 | -3.1 |
| 50s | 31.4% | 20.5% | +10.9 | +4.1 |
| 60s | 26.2% | 16.3% | +9.9 | +2.1 |
| 70s+ | 7.5% | 15.2% | -7.7 | +0.6 |
Source: Japan Tourism Agency, Travel and Tourism Consumption Trend Survey (2021 and 2025 annual figures, final); MetroEngines Research. The reviewer 70s band includes 70 and over.
| Grouping | Reviews 2021 | Reviews 2025 | Reviews change (pt) | JTA 2021 | JTA 2025 | JTA change (pt) |
|---|---|---|---|---|---|---|
| 60s and over | 23.5% | 33.7% | +10.2 | 28.8% | 31.5% | +2.7 |
| 50s and over | 56.9% | 65.1% | +8.2 | 45.2% | 52.0% | +6.8 |
| 40s and under | 43.0% | 35.0% | -8.0 | 54.8% | 48.1% | -6.7 |
Source: Japan Tourism Agency, Travel and Tourism Consumption Trend Survey (2021 and 2025 annual figures, final; domestic overnight trips, sightseeing/recreation, aged 20+); MetroEngines Research (leisure reviewers, N=132,426 in 2021 and 124,011 in 2025). Sums of the age-band shares in Table 1. The reviewer 70s band includes 70 and over.
How large the “gap” between reviews and official statistics looks depends on how age bands are grouped. Grouped as 60 and over, reviewers rose +10.2pt over five years versus just +2.7pt in the official data — reviews make aging look almost four times faster. Grouped as 50 and over, however, the changes are +8.2pt vs +6.8pt, and as 40s and under, -8.0pt vs -6.7pt, so the magnitudes broadly line up. The “aging” visible in reviews is closest to reality when read as a shift of weight toward the 50-and-over population; claiming that “the 60-and-over segment surged” over-reads the filter created by reviewing habits.
What matches is the direction. In the official statistics, too, people in their 60s rose from 14.2% to 16.3% between 2021 and 2025 and those in their 50s from 16.4% to 20.5%, while the 40s shrank from 18.9% to 15.8% and the 30s from 16.3% to 13.9%. The shift toward older age groups is not a review-only phenomenon. What diverges is the level: reviewers are overstated by +10.9pt in their 50s and +9.9pt in their 60s, and understated by -15.0pt in their 20s and -7.7pt at 70 and over. In other words, review attributes are a picture seen through a filter in which people in their 50s and 60s are habitual reviewers while people in their 20s and the oldest travelers post less. The direction of change is usable, but the absolute levels must not be taken as the market composition.
We run the same check on companions. In the Japan Tourism Agency’s 2025 final figures, companions on domestic overnight trips (all purposes) were family/relatives 43.4%, alone 20.3%, spouse/partner 17.9%, friends 8.9% and work colleagues 6.8%. The reviewer family share of 44.4% almost matches the official 43.4%, while solo is more than double (44.7% vs 20.3%) and couples are heavily understated (3.9% vs 17.9%). The solo overstatement likely reflects both the high volume of business-traveler reviews and the tendency for married couples to be classified as “family” in reviews. The conclusion of the comparison: the level of family travel is reliable, but the data cannot be read as “couples have disappeared.”
Where Is Capacity Deepest? Seven Facilities and Use Cases by Prefectural Mention Rate
If the upward age shift and the shift toward family travel are happening together, properties need to serve both “guests traveling with children” and “guests spending time with elderly parents.” To see where this capacity is deep and where it is thin, we measured, by prefecture, mention rates for seven items across 8,665,496 guest reviews from the latest 24 months: traveling with children, trips with elderly parents, Japanese-style rooms, room size, private baths, pet-friendly facilities and children’s menus. Mention rate is not a measure of how highly something is rated but of how many reviews refer to that facility or use case, so we read it as a proxy for how visible each type of capacity is.
| Item | National mention rate | Prefectural median | Deepest (top 3) | Thinnest (bottom 3) | Properties with 5+ mentions |
|---|---|---|---|---|---|
| Traveling with children / kids | 1.17% | 1.23% | Tochigi 2.80% / Chiba 2.49% / Mie 2.42% | Aomori 0.55% / Kyoto 0.53% / Tokyo 0.36% | 4,257 |
| Trips with elderly parents | 0.35% | 0.45% | Saga 0.90% / Gunma 0.85% / Tochigi 0.79% | Kyoto 0.16% / Osaka 0.08% / Tokyo 0.06% | 1,699 |
| Japanese-style rooms (washitsu) | 0.84% | 1.20% | Kochi 1.78% / Wakayama 1.71% / Yamanashi 1.67% | Fukuoka 0.39% / Osaka 0.22% / Tokyo 0.21% | 3,981 |
| Room size | 16.01% | 13.00% | Tokyo 21.84% / Kyoto 20.81% / Osaka 19.32% | Niigata 11.50% / Yamaguchi 11.43% / Yamagata 11.25% | 21,563 |
| Private / family baths | 1.58% | 1.31% | Gunma 6.21% / Oita 5.64% / Tochigi 4.86% | Kochi 0.44% / Osaka 0.41% / Tokyo 0.33% | 4,817 |
| Pet-friendly facilities | 0.79% | 0.79% | Tochigi 2.68% / Shizuoka 2.36% / Chiba 1.81% | Fukuoka 0.26% / Osaka 0.15% / Tokyo 0.12% | 2,229 |
| Children’s menus | 0.13% | 0.18% | Tochigi 0.45% / Mie 0.38% / Saga 0.37% | Kyoto 0.03% / Osaka 0.02% / Tokyo 0.01% | 539 |
Source: HotelBank Editorial Team research (semantic analysis of guest reviews, October 2024–October 2026, N=8,665,496, 47 prefectures). Mention rate = reviews referring to the item ÷ all reviews in the prefecture. The national mention rate is the share of all reviews nationwide (rounded to two decimal places).
Source: HotelBank Editorial Team research (mention rate for traveling with children, top 8 and bottom 6 prefectures, N=8,665,496)
The result is clear: capacity is deepest in prefectures with hot-spring resorts and leisure attractions, such as Tochigi, Shizuoka, Mie, Chiba, Gunma and Oita. Tochigi ranks No. 1 nationwide for traveling with children at 2.80%, also leads for pet-friendly facilities and children’s menus, and places third for both trips with elderly parents and private baths. Shizuoka is in the top six on five of the seven items, while Gunma leads private baths at 6.21%, followed by Oita at 5.64%. In these prefectures, Japanese-style rooms that sleep three generations, private baths and meals for children are established enough to show up in reviews. A separate HotelBank analysis covering a different period, which found Tochigi on top at 2.12% and Tokyo at 0.24% for family mentions with an ADR gap of +28%, examines in more detail how the prefectural distribution of family travel affects rates.
Capacity is thinnest in the major metropolitan areas of Tokyo, Osaka, Kyoto, Fukuoka and Aichi. Mentions of traveling with children are only 0.36% in Tokyo, 0.53% in Kyoto and 0.62% in Osaka, and trips with elderly parents just 0.057% in Tokyo and 0.079% in Osaka. Only 2 properties in Tokyo and 7 in Osaka have five or more reviews mentioning children’s menus. Yet the metro areas rank near the top nationwide for mentions of room size — Tokyo 21.8%, Kyoto 20.8%, Osaka 19.3% — making them the markets most attentive to space. Capacity for families and older guests is underdeveloped simply because supply is dominated by business and city hotels; the interest on the demand side is already there. The metro areas can be read as the markets with the most room to capture demand by reconfiguring existing stock.
Listed Rates at Properties with Capacity — +29–45% for 4+ Guest Rooms, +49% for City Hotels with Half Board
How does this capacity translate into rates? We compared listed prices (2 guests per room, tax included) for check-ins from November 14 to 20, 2026, across 4,803 properties in 9 prefectures — Kanagawa, Chiba, Shizuoka, Nagano, Gunma, Tochigi, Hokkaido, Kyoto and Okinawa — within each category, by whether properties met three conditions: selling rooms for 4 or more guests, having Japanese-style or Japanese-Western rooms, and offering half-board (breakfast and dinner) plans.
| Category | Condition | With (properties / median) | Without (properties / median) | Difference |
|---|---|---|---|---|
| Business | Rooms for 4+ guests | 668 / ¥19,323 | 1,100 / ¥15,009 | +28.7% |
| Business | Japanese / Japanese-Western rooms | 321 / ¥15,599 | 1,447 / ¥16,800 | -7.1% |
| Business | Half-board plan | 301 / ¥17,669 | 1,467 / ¥16,214 | +9.0% |
| City | Rooms for 4+ guests | 192 / ¥32,216 | 117 / ¥24,094 | +33.7% |
| City | Japanese / Japanese-Western rooms | 87 / ¥31,647 | 222 / ¥28,266 | +12.0% |
| City | Half-board plan | 140 / ¥37,245 | 169 / ¥24,970 | +49.2% |
| Resort | Rooms for 4+ guests | 631 / ¥42,797 | 145 / ¥31,171 | +37.3% |
| Resort | Japanese / Japanese-Western rooms | 323 / ¥37,858 | 453 / ¥46,522 | -18.6% |
| Resort | Half-board plan | 526 / ¥47,756 | 250 / ¥29,909 | +59.7% |
| Ryokan | Rooms for 4+ guests | 1,707 / ¥41,483 | 243 / ¥28,691 | +44.6% |
| Ryokan | Japanese / Japanese-Western rooms | 1,692 / ¥38,357 | 258 / ¥58,304 | -34.2% |
| Ryokan | Half-board plan | 1,313 / ¥39,507 | 637 / ¥39,536 | -0.1% |
Source: MetroEngines Research; compiled by HotelBank Editorial Team (4,803 properties in 9 prefectures; listed prices for check-ins November 14–20, 2026, 2 guests per room, tax included; median of property averages)
Source: MetroEngines Research; compiled by HotelBank Editorial Team (median listed price with and without rooms for 4+ guests, N=4,803 properties)
In every category, properties selling rooms for 4 or more guests have higher median listed rates: ¥19,300 vs ¥15,000 (+28.7%) for business hotels, ¥32,200 vs ¥24,100 (+33.7%) for city hotels, ¥42,800 vs ¥31,200 (+37.3%) for resorts and ¥41,500 vs ¥28,700 (+44.6%) for ryokan. Rooms for four are larger, and higher-grade properties are more likely to have them, so not all of this gap is “the value of family readiness.” Even so, the fact that having rooms able to take family demand and sitting in a higher rate band overlap in the same group of properties points the way for properties looking to grow rates.
Half-board plans show gaps of +9.0% at business hotels, +49.2% at city hotels and +59.7% at resorts. Part of this is natural, since meals are included in the comparison, but it should not be overlooked that “not having to find dinner for everyone elsewhere” is a reason three-generation groups choose a property. At ryokan, half board makes no difference (-0.1%). Half board is the norm at ryokan, and room-only plans likely sit alongside it as an option for solo guests and multi-night stays rather than as a way to cut prices. What the properties chosen for three-generation trips and trips with elderly parents have in common is a topic that warrants property-level analysis of its own.
Japanese-style and Japanese-Western rooms require careful reading. The group with Japanese-style rooms has a lower median: -7.1% for business hotels, -18.6% for resorts and -34.2% for ryokan. Japanese-style rooms are common in older, large ryokan, while the ryokan without them include newer, high-priced properties, so what shows up in the rate is the property’s generation rather than the presence of Japanese-style rooms itself. Put the other way round, Japanese-style rooms are the most widely available stock for three-generation stays and co-sleeping with children, yet they still leave room to grow on rate. Comparing properties that meet all three conditions with those that meet none gives ¥21,900 vs ¥15,000 for business hotels, ¥39,700 vs ¥20,900 for city hotels, ¥40,200 vs ¥24,800 for resorts and ¥38,600 vs ¥26,900 for ryokan: properties with the full set of capacity features sell in a higher price band. How far converting Japanese-style rooms into Japanese-Western rooms lifts rates depends heavily on the price band of the town, ranging from +10.8% to -33.9% across municipalities in a separate HotelBank payback analysis.
| Category | All three conditions | None | Difference |
|---|---|---|---|
| Business | ¥21,900 | ¥15,000 | +46% |
| City | ¥39,700 | ¥20,900 | +90% |
| Resort | ¥40,200 | ¥24,800 | +62% |
| Ryokan | ¥38,600 | ¥26,900 | +43% |
Source: MetroEngines Research; compiled by HotelBank Editorial Team (4,803 properties in 9 prefectures; listed prices for check-ins November 14–20, 2026, 2 guests per room, tax included; median of property averages). Differences are approximations calculated from medians rounded to the nearest ¥100, and include differences in property size, age and location.
Moves Possible with Existing Stock — In Order of Investment Size
To sum up so far: in the reviewer base, guests aged 60 and over and family groups are increasing; official statistics point the same way; capacity is deep in hot-spring prefectures and thin in metro areas; and properties with that capacity sit in higher rate bands. The faster route is therefore not building new capacity from scratch but capturing untapped demand by reconfiguring existing stock. Below, the moves are listed in order of investment size, smallest first.
| No. | Move | Investment size | Target demand | Supporting data |
|---|---|---|---|---|
| 1 | Staggered dinner times (two seatings / choice of time slot) | Operations only | Three-generation groups, families with toddlers | Half-board rate gaps are +49.2% for city hotels and +59.7% for resorts. Opening early seatings to families raises dining-room turnover while growing half-board sales |
| 2 | Selling at 4+ guest occupancy (listing co-sleeping and extra beds properly) | Operations only | Families with children | Only 37.8% of business hotels sell rooms for 4+ guests. Simply listing existing twins and triples at 4-guest occupancy puts them into search results |
| 3 | Children’s menus and soft-food / low-salt options | Small | Families with children, elderly parents | Children’s menus have the thinnest national mention rate of the seven items at 0.13%, with only 539 properties nationwide receiving 5+ mentions. The area where differentiation works best |
| 4 | Step-free improvements (bath handrails, non-slip flooring, ramps at room entrances) | Small to medium | Guests 60+, trips with elderly parents | Guests 60+ make up 33.7% of leisure reviewers. Mention rates for trips with elderly parents are 0.7–0.9% in hot-spring prefectures vs 0.06–0.2% in metro areas |
| 5 | Bookable private bath slots (time-slot reservations for existing family baths or main baths) | Small to medium | Three-generation groups, families with infants | Private bath mention rates are 6.21% in Gunma and 5.64% in Oita vs 0.33% in Tokyo and 0.41% in Osaka |
| 6 | Connecting rooms (adding an inner door between two adjacent rooms) | Medium | Three-generation groups, two families | Properties with rooms for 4+ guests list +33.7% higher at city hotels. Selling two rooms as one unit achieves the same effect with existing stock |
| 7 | Japanese-Western conversion (adding beds to Japanese-style rooms, combining floor seating with beds) | Medium | Elderly parents plus grandchildren | Japanese-style room mention rates are high at around 1.7% in Kochi, Wakayama and Yamanashi, but ryokan with such rooms list -34.2% lower. Beds reduce the strain of sitting down and standing up for older guests and capture the rate upside |
Source: Compiled by HotelBank Editorial Team. Investment sizes are general guidelines and vary with each property’s structure and scale.
The logic of the sequence is simple: start with what needs only operational changes, then move to small investments once the effect shows up in reviews. Staggered dinner times and 4-guest occupancy settings can both start next week. Many properties can introduce children’s menus and step-free improvements without room renovation, and given how thin the mention rates are, these are where differentiation in reviews is most likely to show. Connecting rooms and Japanese-Western conversions involve room-level renovation, but the investment is small compared with building new capacity, and the fact that properties with rooms for 4+ guests sit in higher price bands gives a benchmark for payback.
Summary
In the reviewer base, the guest mix shows an upward age shift and a move toward family travel happening together: 60s at 26.2% and 70s at 7.5% among leisure reviewers, and family at 44.4% of companions. Compared with Japan Tourism Agency statistics, the direction matches reality, but a reviewing-habit filter overstates people in their 50s and 60s and understates those in their 20s and 70s+, so the levels must be discounted. Capacity is deep in hot-spring prefectures such as Tochigi, Shizuoka, Gunma and Oita, and thin in metro areas such as Tokyo, Osaka and Kyoto. Properties with that capacity sit in higher rate bands: +29–45% for rooms for 4+ guests and +49% for city hotels with half board. The realistic path is to begin with staggered dinner times and 4-guest occupancy settings, then progress in order of investment size to children’s menus, step-free improvements, bookable private bath slots, connecting rooms and Japanese-Western conversions. Plenty of untapped demand remains to be captured within existing stock.
⚠ Note on listed prices for future dates: The listed prices in this article are the selling prices for check-ins from November 14 to 20, 2026, as published at the time of the survey (early October 2026), and will change as the check-in date approaches. Prices currently set high may fall with last-minute adjustments.
For hotels: plan-name tips for this theme
Most common selling points in publicly listed family-oriented plan names (N=1,639):
Families / kids 92%Breakfast included 24%Room only 19%Groups 14%Couples 13%Half board 10%
Real name examples (anonymized, translated from Japanese):
- Standard Japanese kaiseki dinner course, 1 night with 2 meals — unlimited free private bath use [special-date discounts] for families / couples
- Year-round [cottage-only, room only] Self-catering OK for groups and families! Enjoy a lively stay in a rental villa — private bath free
- With family! With friends! (Breakfast included) Japanese-Western, Japanese-style and luxury twin rooms — Japanese, Western and Chinese buffet
*These are tendencies based on aggregated public plan names and do not show that naming causes sales. For a deeper look at markets and naming, see our naming benchmark and event articles.
Frequently Asked Questions
Q. Can the age structure of reviewers be treated as the same as that of all travelers?
A. No. Comparing leisure travel in 2025, reviewers outnumber the Japan Tourism Agency statistics by +10.9pt in their 50s and +9.9pt in their 60s, and fall short by -15.0pt in their 20s and -7.7pt at 70 and over. The direction of growth matches official statistics, but the absolute levels cannot be taken as the market composition.
Q. Can the shift toward family travel be confirmed in official statistics?
A. The levels almost match. Family companions among reviewers were 44.4% in 2025, and family/relatives on domestic overnight trips were 43.4% in the Japan Tourism Agency’s 2025 final figures. Solo (44.7% vs 20.3%) and couples (3.9% vs 17.9%), however, diverge widely, so the data cannot be read as “couples have disappeared.”
Q. Which prefectures have the deepest capacity for families with children and three-generation trips?
A. Across 8,665,496 reviews from the latest 24 months, mention rates for traveling with children are highest in Tochigi (2.80%), Chiba (2.49%) and Mie (2.42%), and for private baths in Gunma (6.21%) and Oita (5.64%). Tokyo, at 0.36% for children and 0.33% for private baths, ranked last of 47 prefectures on six of the seven items.
Q. Do rooms for 4 or more guests raise rates?
A. In median listed prices for check-ins November 14–20, 2026, properties selling rooms for 4+ guests were +28.7% higher for business hotels, +33.7% for city hotels, +37.3% for resorts and +44.6% for ryokan. However, properties with larger rooms also tend to be higher grade, so not all of the gap reflects the value of family readiness.
Q. Why are listed prices lower at properties with Japanese-style rooms?
A. Japanese-style rooms are common in older, large ryokan, while ryokan without them include newer, high-priced properties. Among ryokan, the median was ¥38,357 with Japanese/Japanese-Western rooms and ¥58,304 without (-34.2%). The gap reflects the generation of the property more than the presence of Japanese-style rooms itself.
Q. What can existing properties start with?
A. Two operational moves: staggering dinner times (two seatings or a choice of time slot), and listing existing twins and triples at 4+ guest occupancy including co-sleeping and extra beds. Only 37.8% of business hotels currently sell rooms for 4 or more guests.
Related Reading
References and Sources
■ Data sources
Guest review attributes collected by MetroEngines Research from major Japanese booking sites (purpose, companions, age band; 2021–2025; 408,000–740,000 reviews per year); semantic analysis of review text (posted October 9, 2024 – October 9, 2026; 8,665,496 reviews; 47 prefectures); listed prices for 4,803 properties in 9 prefectures (check-ins November 14–20, 2026; 2 guests per room; tax included). Official statistics: Japan Tourism Agency, Travel and Tourism Consumption Trend Survey, 2021, 2024 and 2025 annual figures (final).
■ Calculation assumptions
Review attribute shares use each year’s response count as the denominator; age bands are tallied separately for leisure and business purposes. Japan Tourism Agency statistics convert cumulative travelers on domestic overnight trips into shares for people aged 20 and over (70 and over combined). Mention rate = reviews referring to the item ÷ all reviews in the prefecture; property counts are properties with 5 or more mentions in the same period. Listed prices are averaged per property over the 7 target days, and medians are compared by category and condition. Tables 2 and 6 are calculated from published values in Table 1 and the main text.
■ Limitations
Review attributes are self-reported by guests who posted reviews and are not a representative sample of all travelers (ages skew toward the 50s and 60s). Mention rates measure frequency of mention, not ratings. Listed prices are selling prices at the time of the survey (early October 2026), not estimated settled ADR, and may change with last-minute adjustments. Price differences by capacity feature are correlations that include differences in room size, grade, building age and location, and do not show causal effects.
- Japan Tourism Agency, Travel and Tourism Consumption Trend Survey, 2025 annual figures (final), Tables 4 and 11 (e-Stat)
- Japan Tourism Agency, Travel and Tourism Consumption Trend Survey, 2024 annual figures (final), Table 12 (e-Stat)
- Japan Tourism Agency, Travel and Tourism Consumption Trend Survey, 2021 annual figures (final), Table 12 (e-Stat)
- Japan Tourism Agency, Tourism Statistics and White Papers (publication page for the Travel and Tourism Consumption Trend Survey)
- MetroEngines Research — guest review attributes from major Japanese booking sites (2021–2025, 408,000–740,000 reviews per year), semantic review analysis (October 2024–October 2026, 8,665,496 reviews), listed prices (4,803 properties in 9 prefectures, check-ins November 14–20, 2026)