

Japan’s Common Test for University Admissions for the 2027 academic year (Reiwa 9) will be held on Saturday, January 16 and Sunday, January 17, 2027. Stays by exam takers are demand that “recurs every year on a fixed date,” yet few sources quantify, from the hotel side, how large that demand is and where it lands. This article matches the applicant counts by test venue published by the National Center for University Entrance Examinations against MetroEngines Research’s property, pricing and guest-review data to estimate lodging demand around the Common Test as a market size. It then sets out the room stock within a 2 km radius of 159 test venues in eight major areas, how prices move on the exam weekend, and the depth of hotels that guests recognize as a base for exam and away-trip stays, in order to identify which cities still have room to capture this demand.
Metric Definitions Used in This Article
- ADR (Average Daily Rate): An estimated settled rate (tax-exclusive equivalent) calculated by applying a segment-specific adjustment factor to the lowest plan level each property publishes on OTAs (per room, two guests per room, tax included). When checked against property-level actuals disclosed by listed hotel REITs (91 properties, most recent three months), the median error is about 7%. This is an estimate and differs from each property’s actual settled prices and accounting figures. Area-level ADR is the median of the properties covered (the level of a typical property in the area).
- Listed price: The average across all plans of the selling prices published on OTAs and similar channels (per room, two guests per room, tax included; room-only through meal-inclusive plans). This is used for day-by-day comparisons. Because its basis differs from ADR, the two figures should not be compared directly.
- Room stock within 2 km: The registered room count of properties located within 2 km in a straight line from a test venue’s address for which published selling prices were confirmed between March and September 2026 (properties confirmed as operating). A property falling within the radius of more than one venue is counted only once. Properties not listed on OTAs are excluded.
- Exam / away-trip mention rate: The share of guest reviews over the past 24 months that mention use for a “trip made for a destination event” such as entrance exams, tests, academic conferences, tournaments, concerts or watching sports (NLP analysis by the HotelBank Editorial Team). It is not an exam-only measure but an indicator of date-fixed away-trip demand as a whole.
- Data sources: MetroEngines Research / National Center for University Entrance Examinations (an Independent Administrative Institution)
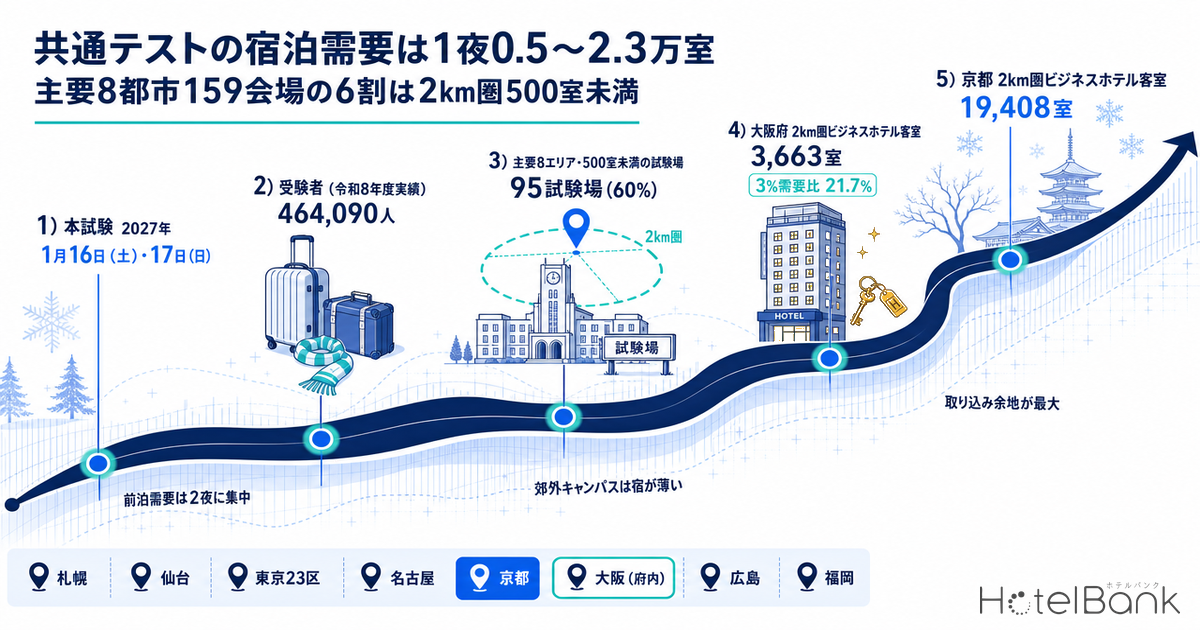
- — 464,090 people sat the Common Test in 2026. Because test venues are in principle assigned within the test district of the applicant’s high school or current address, only those travelling from remote areas need a hotel. Setting that share at 1%, 3% and 5%, pre-exam demand comes to roughly 4,600–23,200 rooms per night, or roughly 9,300–46,400 room-nights over two nights.
- — Of the 159 test venues in the eight major areas, 95 (60%) have fewer than 500 confirmed-operating rooms within 2 km. On an applicant basis, 75,555 of 137,996 (54.8%) are assigned to such venues.
- — Venue-adjacent capacity is thinnest in Osaka Prefecture, where business hotels within 2 km of the prefecture’s 38 venues total 3,663 rooms. Demand under the 3% scenario is 796 rooms per night, equal to 21.7% of that stock. In the other seven areas the ratio stays in the 1–3% range.
- — Listed prices on the exam weekend are roughly level with other Saturdays in the same January (2026: Tokyo +0.8%, Kyoto -5.3%, etc.). Exam demand does not show up in date-level prices; it sits inside the weekend-versus-weekday gap (+20% to +90%).
- — The exam / away-trip mention rate is high in Hiroshima (2.32%) and Sendai (1.81%) and lowest of the eight areas in Kyoto at 0.18%. Kyoto has 19,408 business-hotel rooms within 2 km of its venues, and January is when its prices are softest in the year, making it the city with the most room to capture exam and away-trip demand.
Premise — The 2027 Schedule and Which Exam Takers Need a Hotel
According to the Center’s implementation guidelines, the main FY2027 (Reiwa 9) Common Test will be held on Saturday, January 16 and Sunday, January 17, 2027, with the make-up test on Saturday, January 23 and Sunday, January 24. Applications are accepted from September 15 to October 2, 2026, and the FY2027 applicant count had not been published at the time of writing. This article therefore uses as its baseline the latest confirmed figures: 496,237 applicants and 464,090 test takers (a 93.52% sitting rate) for FY2026 (Reiwa 8, held in January 2026). The FY2026 main test used 650 venues nationwide (592 on university campuses and 58 off campus).
The most important factor for lodging demand is the rule for assigning test venues. Under the Center’s guidance, students expecting to graduate from high school are assigned to a venue within the test district where their school is located, and graduates and others to a venue within the test district of their current address at the time of application. In other words, most exam takers sit the test within commuting range of home or school, and Common Test lodging is not demand in which “exam takers from across the country converge on big cities.” A hotel is needed only by those who live far from their venue, as on remote islands or in geographically large prefectures, and by those who choose to stay the night before because they are anxious about morning transport.
No statistics have been published on the share of these remote-area exam takers. As an assumption for the estimate, this article sets the share of test takers who stay overnight at three levels — low 1%, mid 3% and high 5% — and calculates the rooms required under the conditions below. Please note that these assumed figures are not verified values but placeholders used to show a range.
• Test takers: 464,090 (FY2026 actual; FY2027 assumed to be the same scale)
• Share staying overnight: 1% / 3% / 5% (assumed share of remote-area test takers)
• One room per test taker (an accompanying parent is assumed to share the room)
• Nights: the two nights before the tests (Friday and Saturday). Stays after the Sunday test are not included
• ADR: estimated settled ADR of business hotels in the eight prefectures for January 2026 (¥7,000–¥12,600)
| Scenario | Test takers staying | Rooms needed (per night) | Room-nights over 2 nights | Indicative room revenue |
|---|---|---|---|---|
| Low (1%) | 4,641 | 4,641 | 9,282 | approx. ¥70–120 million |
| Mid (3%) | 13,923 | 13,923 | 27,846 | approx. ¥200–350 million |
| High (5%) | 23,204 | 23,204 | 46,408 | approx. ¥330–580 million |
Source: Compiled by the HotelBank Editorial Team from the National Center for University Entrance Examinations, “Overview of Results of the FY2026 (Reiwa 8) Common Test for University Admissions,” and MetroEngines Research (the share staying overnight, number of nights and one room per person are all assumptions. Indicative revenue = room-nights × estimated settled ADR of business hotels in January 2026 [Hiroshima Prefecture ¥7,047 to Tokyo ¥12,550])
In the mid scenario the scale is about 13,900 rooms per night, about 27,800 room-nights over two nights, and roughly ¥200–350 million in room revenue. Against the approximately 27,000 confirmed-operating properties and 1.26 million rooms that MetroEngines Research tracks, that is only about 1.1% per night. Judged by the national figure alone it is a small market, but the demand is concentrated in two January nights and lands unevenly, close to the venues. What matters on the supply side is not the total volume but the distribution — which venues have rooms nearby.
Note that the individual second-stage examinations of national and public universities (the first-term schedule begins on February 25, 2027) require exam takers to travel to the city of their target university, so the share staying from outside the prefecture is likely higher than for the Common Test. The estimate here is limited to the Common Test and does not include demand from the individual examinations from February onward.
The 2 km Radius of 159 Venues in Eight Areas — 60% Have Fewer Than 500 Rooms
Next, where the demand lands. From the venue list we extracted the venues located in the cities (ward areas) of Sapporo, Sendai, Tokyo’s 23 wards, Nagoya, Kyoto, Hiroshima and Fukuoka, plus all venues in Osaka Prefecture. Osaka City itself has only four venues and most are in suburbs such as Suita, Toyonaka, Sakai and Higashi-Osaka, so the whole prefecture was used as the unit. The total is 159 venues and 137,996 applicants, or 27.8% of applicants nationwide. The table below aggregates the confirmed-operating properties within a 2 km radius of each venue’s address.
| Area | Venues | Applicants | Properties within 2 km | Rooms within 2 km | Of which business hotels | Venues under 500 rooms | 3% demand / business-hotel rooms |
|---|---|---|---|---|---|---|---|
| Sapporo | 8 | 7,860 | 282 | 34,002 | 20,889 | 5 (3,090 applicants) | 221 rooms (1.1%) |
| Sendai | 7 | 5,921 | 96 | 13,295 | 10,516 | 5 (2,689 applicants) | 166 rooms (1.6%) |
| Tokyo 23 Wards | 46 | 49,714 | 1,389 | 131,161 | 80,141 | 15 (18,099 applicants) | 1,395 rooms (1.7%) |
| Nagoya | 20 | 19,429 | 219 | 28,503 | 22,239 | 17 (15,244 applicants) | 545 rooms (2.5%) |
| Kyoto | 17 | 8,119 | 1,305 | 37,000 | 19,408 | 7 (2,710 applicants) | 228 rooms (1.2%) |
| Osaka (pref.) | 38 | 28,387 | 81 | 5,501 | 3,663 | 31 (20,798 applicants) | 796 rooms (21.7%) |
| Hiroshima | 10 | 6,901 | 130 | 11,504 | 8,912 | 8 (5,900 applicants) | 194 rooms (2.2%) |
| Fukuoka | 13 | 11,665 | 351 | 27,561 | 20,730 | 7 (7,025 applicants) | 327 rooms (1.6%) |
Source: Compiled by the HotelBank Editorial Team from the National Center for University Entrance Examinations, “List of Test Venues for the FY2026 (Reiwa 8) Common Test for University Admissions” (as of November 28, 2025), and MetroEngines Research (N=159 venues, 3,853 properties. The 2 km radius is the straight-line distance from the venue address; confirmed-operating properties only. “Venues under 500 rooms” shows the number of venues with fewer than 500 rooms within 2 km and their applicants. 3% demand = applicants × 93.52% sitting rate × 3%)
On area totals, Tokyo’s 23 wards have 131,161 rooms within 2 km, Sapporo 34,002 and Kyoto 37,000 — ample relative to demand. But these totals are heavily lifted by one or two venues close to city-centre terminals. Venue by venue, the median room count within 2 km is only about 46 in Nagoya, about 35 in Hiroshima, 57 in Sendai and about 67 in Osaka Prefecture, and 95 of the 159 venues (60%) had fewer than 500 rooms. University campuses tend to sit in suburbs or residential districts, which do not overlap with the central commercial districts where lodging clusters.
Source: Compiled by the HotelBank Editorial Team from the National Center for University Entrance Examinations, “List of Test Venues for the FY2026 (Reiwa 8) Common Test for University Admissions”, and MetroEngines Research (N=159 venues)
Comparing demand with venue-adjacent supply, Osaka Prefecture alone stands out. While 28,387 applicants are assigned to its 38 venues, there are only 3,663 business-hotel rooms within 2 km. The 3% scenario’s 796 rooms per night equals 21.7% of that, and the 5% scenario’s 1,327 rooms reaches 36.2%. In the other seven areas the same ratio is in the 1–3% range, so the pattern of hotels near the venue filling up with exam demand is specific to Osaka Prefecture’s suburban venues. In practice, however, the demand goes to the areas around terminals such as Umeda, Shin-Osaka and Tennoji, from which the venues can be reached by train. Venue-adjacent hotels are a scarce option for exam takers, and hotels on the terminal side can gain appeal simply by stating the travel time to the venue.
The map shows the distribution of venues and rooms within 2 km. Circle size indicates the number of applicants; blue marks venues with 500 or more rooms within 2 km, grey those with fewer than 500.
Source: Compiled by the HotelBank Editorial Team from the National Center for University Entrance Examinations, “List of Test Venues for the FY2026 (Reiwa 8) Common Test for University Admissions”, and MetroEngines Research (venue locations obtained from their addresses via the Geospatial Information Authority of Japan’s geocoding)
Campus-level room stock is covered in detail in our article measuring the 2 km and 5 km radii of ten major campuses. This article takes as its population all test venues, including private universities and high schools, not just national university campuses, and the pattern in which venues with fewer than 500 rooms make up the majority of an area owes much to the locations of the private universities and high schools that account for most venues.
Pricing — The Exam Weekend Is at the Same Level as an Ordinary January Saturday
If demand is concentrated in two January nights, are prices higher that weekend? On a monthly basis, the estimated settled ADR of business hotels in the eight prefectures moved between -3.7% and +24.4% YoY in January 2026. Most of this variation stems from factors other than exams (inbound travel, winter tourism and the overall rise in rates).
| Prefecture | Jan 2025 | Jan 2026 | YoY | Jan 2027 (as of survey) | N (Jan 2026) |
|---|---|---|---|---|---|
| Hokkaido | ¥7,057 | ¥8,074 | +14.4% | ¥11,516 (+42.6%) | 430 properties |
| Miyagi Prefecture | ¥6,111 | ¥7,601 | +24.4% | ¥9,572 (+25.9%) | 139 properties |
| Tokyo | ¥11,940 | ¥12,550 | +5.1% | ¥13,316 (+6.1%) | 908 properties |
| Aichi Prefecture | ¥6,924 | ¥7,774 | +12.3% | ¥10,126 (+30.3%) | 328 properties |
| Kyoto Prefecture | ¥10,148 | ¥9,773 | -3.7% | ¥11,194 (+14.5%) | 319 properties |
| Osaka Prefecture | ¥8,798 | ¥9,144 | +3.9% | ¥9,670 (+5.8%) | 496 properties |
| Hiroshima Prefecture | ¥6,414 | ¥7,047 | +9.9% | ¥9,082 (+28.9%) | 184 properties |
| Fukuoka Prefecture | ¥9,033 | ¥10,332 | +14.4% | ¥11,557 (+11.9%) | 338 properties |
Source: Compiled by the HotelBank Editorial Team from MetroEngines Research (estimated settled ADR, tax-exclusive equivalent, business hotels, prefectural median. January 2027 is an estimate based on prices listed at the time of the survey [September 2026], N=146–828 properties)
To check at the date level, for business hotels within 2 km of venues we compared, property by property, the listed price on the nights before the tests (Friday and Saturday) with the average of the other Fridays and Saturdays in the same January, and took the median. The comparison set is the two Fridays and Saturdays from the week after the test onward, excluding weekends that fall on a three-day holiday.
Source: Compiled by the HotelBank Editorial Team from MetroEngines Research (listed price, all-plan average, two guests per room, tax included. Business hotels within 2 km of venues, limited to properties with prices from the same source for every date compared. Median of property-level changes. Osaka Prefecture is not shown for 2026 because only three properties qualified)
| Area | 2025 vs. other Saturdays | 2026 vs. other Saturdays | 2026 vs. weekdays | 2027 vs. weekdays (as of survey) |
|---|---|---|---|---|
| Sapporo | -18.0% (N=117) | +4.1% (N=45) | +35.2% | +34.3% (N=116) |
| Sendai | +18.9% (N=65) | -11.0% (N=23) | +48.3% | +48.4% (N=60) |
| Tokyo 23 Wards | -0.8% (N=489) | +0.8% (N=240) | +27.5% | +33.0% (N=455) |
| Nagoya | -4.7% (N=123) | -0.5% (N=30) | +41.6% | +60.0% (N=103) |
| Kyoto | -9.9% (N=154) | -5.3% (N=79) | +30.3% | +33.3% (N=152) |
| Osaka (pref.) | -3.4% (N=29) | — | — | +22.0% (N=22) |
| Hiroshima | +3.8% (N=54) | +0.3% (N=19) | +20.4% | +33.8% (N=51) |
| Fukuoka | -7.4% (N=126) | -0.2% (N=72) | +90.3% | +89.7% (N=110) |
Source: Compiled by the HotelBank Editorial Team from MetroEngines Research (listed price, all-plan average, two guests per room, tax included. Saturday before the test = Jan 18, 2025 / Jan 17, 2026 / Jan 16, 2027. Weekdays = average of four Tuesdays and Wednesdays from the week after the test onward)
The result is clear. Prices on the Saturday before the test are almost the same as on other January Saturdays. In 2026 the figures were +0.8% in Tokyo’s 23 wards, -0.5% in Nagoya, +0.3% in Hiroshima and -0.2% in Fukuoka, while Kyoto (-5.3%) and Sendai (-11.0%) were actually lower than other Saturdays. In 2025, too, Sapporo was -18.0% and Kyoto -9.9%, and only Sendai and Hiroshima exceeded other Saturdays. Compared with weekdays, by contrast, the same Saturday shows a large gap in 2026, from +20.4% in Hiroshima to +90.3% in Fukuoka. Exam demand is contained in weekend prices as one part of overall January weekend demand, and does not appear as a premium specific to the test date. The tendency for date-fixed events not to add a premium on top of weekend prices was also confirmed in our article examining hotel prices around wedding venues in November, the peak month for ceremonies.
From an operator’s standpoint, this means there is little scope to treat the exam weekend as a day to win on price. What sets exam guests apart from other weekend guests is not price sensitivity but what they require of the stay itself: a dependable morning departure, quiet sleep, and consecutive nights after the test or ahead of the second-stage exams. It is demand where differentiation comes from product design rather than price, and that is where the revenue opportunity lies.
Depth of Capacity — Exam / Away-Trip Mention Rate: Hiroshima 2.32%, Kyoto 0.18%
So in which cities are hotels recognized by guests as places that accommodate exam and away-trip travellers? For business hotels within 2 km of venues with at least 20 reviews in the past 24 months, we aggregated by city the share of reviews mentioning exams or away trips.
Source: HotelBank Editorial Team research (NLP analysis). 1,279 business hotels within 2 km of venues with at least 20 reviews; 1,052,323 reviews (October 2024–September 2026)
| Area | Properties covered | Reviews | Exam / away-trip mention rate | Properties with 5+ mentions | Quietness rated in 3%+ of reviews | Breakfast rated in 5%+ of reviews | Consecutive-stay mention rate |
|---|---|---|---|---|---|---|---|
| Sapporo | 128 | 102,372 | 0.96% | 75 properties / 14,148 rooms | 77% | 16% | 4.2% |
| Sendai | 68 | 54,605 | 1.81% | 53 properties / 9,094 rooms | 75% | 19% | 3.1% |
| Tokyo 23 Wards | 544 | 449,080 | 0.93% | 190 properties / 39,152 rooms | 90% | 9% | 2.4% |
| Nagoya | 127 | 108,458 | 1.22% | 86 properties / 17,767 rooms | 74% | 18% | 2.9% |
| Kyoto | 189 | 155,707 | 0.18% | 18 properties / 3,827 rooms | 92% | 21% | 2.6% |
| Osaka (pref.) | 30 | 10,030 | 0.88% | 7 properties / 1,593 rooms | 67% | 17% | 4.3% |
| Hiroshima | 61 | 49,506 | 2.32% | 41 properties / 7,806 rooms | 61% | 31% | 2.9% |
| Fukuoka | 132 | 122,565 | 1.50% | 87 properties / 15,882 rooms | 73% | 12% | 2.9% |
Source: HotelBank Editorial Team research (NLP analysis, past 24 months, N=1,279 properties). “Quietness rated in 3%+ of reviews” = share of properties where at least 3% of reviews positively rate room quietness or soundproofing. “Breakfast rated in 5%+ of reviews” = share of properties where reviews positively rating buffet, Japanese or freshly prepared breakfasts total at least 5%. “Consecutive-stay mention rate” = share of reviews mentioning consecutive-night or long stays
The exam / away-trip mention rate is high in Hiroshima (2.32%), Sendai (1.81%) and Fukuoka (1.50%). In Hiroshima 41 of the 61 properties covered, and in Sendai 53 of 68, have five or more mentions of away-trip use, so many business hotels near the venues are recognized as lodging for away-trip guests. Besides exams, this indicator includes away trips to watch sports or attend concerts at stadiums and arenas. Staying the night before a date-fixed event and leaving reliably in the morning closely resembles the behaviour of exam guests, and hotels accustomed to handling away-trip guests readily serve as capacity for exam guests as well.
Kyoto is the contrast. Despite having 209 business hotels with 19,408 rooms within 2 km of its venues, its exam / away-trip mention rate is 0.18%, the lowest of the eight areas, and only 18 properties have five or more mentions. Reviews of Kyoto’s business hotels centre on sightseeing use, and recognition as lodging for away trips is still small. On indicators of stay quality, however, Kyoto ranks near the top of the eight areas, with 92% of properties at the 3%-plus quietness level and 21% at the 5%-plus breakfast level. The attributes exam guests seek are already in place; what remains is positioning as “a hotel for exam takers,” and that can be seen as where the upside lies.
The breakfast share is highest in Hiroshima at 31% and low in Tokyo’s 23 wards at 9%. This is likely because Tokyo’s 23 wards have many properties and a high share of limited-service hotels that do not serve breakfast. Early-morning breakfast hours cannot be measured directly from reviews, but hotels with high breakfast satisfaction are well placed to meet breakfast demand on the morning of the test.
Which Cities Still Have Room to Capture the Demand
Organizing the results so far along three axes — how demand lands, venue-adjacent supply, and recognition as exam lodging — the available moves differ by city.
| Area | Pattern | Direction of upside |
|---|---|---|
| Kyoto | 19,408 business-hotel rooms within 2 km of venues. Lowest exam / away-trip mention rate at 0.18%. January is when prices are softest in the year | Positioning as lodging for exam and away-trip stays. Quietness and breakfast ratings are already near the top, and as demand to fill the January low season this has the greatest upside |
| Osaka (pref.) | 3,663 business-hotel rooms within 2 km of 38 venues. 3% demand equals 21.7% of that | Venue-adjacent hotels: early sales that make use of scarcity. Terminal side (Umeda, Shin-Osaka, Tennoji): exam plans that state the travel time to the venue |
| Nagoya | 17 of 20 venues have fewer than 500 rooms within 2 km (15,244 applicants) | Hotels at transfer hubs for suburban campuses, such as Nagoya Station and Kanayama, are the capacity for this demand. Extend away-trip recognition (1.22%) to exam guests |
| Sapporo / Fukuoka | Demand ratio in the 1% range and deep venue-adjacent supply. Away-trip mention rate is mid-range | Repurpose dome and arena away-trip know-how for exam guests. Room to raise the breakfast share (12–16%) |
| Hiroshima / Sendai | High away-trip mention rate; recognition as exam and away-trip lodging is already deep | Extend the product from the pre-exam night to consecutive and repeat stays through the second-stage exams (late February) |
| Tokyo 23 Wards | Largest absolute room volume. Only 9% of properties are at the 5%-plus breakfast level | Room to differentiate with breakfast-inclusive, early-service plans for exam guests |
Source: Compiled from the National Center for University Entrance Examinations, MetroEngines Research and HotelBank Editorial Team research
At several thousand to some 20,000 rooms per night nationwide, exam demand is small relative to the overall market. But its dates are fixed, it recurs every year, and hotels are chosen for the content of the stay rather than price. Osaka Prefecture, where venue-adjacent supply is thin, and Kyoto, where rooms are plentiful but recognition as exam lodging is still small, are the two places with particularly large upside in capturing this demand. About four months remain until the 2027 Common Test, and from October, when applications close, exam takers and their parents begin looking for hotels.
⚠ Note on ADR for future dates: The January 2027 figures are estimates based on selling prices published on OTAs at the time of the survey (September 2026) and will change as the check-in date approaches. Please note that prices currently set high may be reduced closer to the date.
Frequently Asked Questions
Q. When will the 2027 Common Test for University Admissions be held?
A. The main test is on Saturday, January 16 and Sunday, January 17, 2027, and the make-up test on Saturday, January 23 and Sunday, January 24 (per the National Center for University Entrance Examinations’ implementation guidelines). Pre-exam stays are concentrated on the two nights of Friday, January 15 and Saturday, January 16.
Q. How many exam takers need a hotel for the Common Test?
A. Because venues are in principle assigned within the test district of the applicant’s high school or current address, only those from remote areas stay overnight. Assuming 1–5% of the 464,090 FY2026 test takers stay, pre-exam demand is about 4,600–23,200 rooms per night (the share is a placeholder, as no statistics are published).
Q. Do hotel prices rise on the exam weekend?
A. In 2026, listed prices on the Saturday before the test were roughly level with other Saturdays in the same January (Tokyo’s 23 wards +0.8%, Kyoto -5.3%, etc.; business hotels within 2 km of venues). Exam demand is not a date-level premium; it is contained in weekend prices that run +20% to +90% above weekdays.
Q. Which area has the fewest rooms near its test venues?
A. Osaka Prefecture. Business hotels within 2 km of its 38 venues total 3,663 rooms, and demand at a 3% overnight share (796 rooms per night) equals 21.7% of that. The other seven areas are in the 1–3% range.
Q. Which city has the most room to capture exam demand?
A. Kyoto. It has 19,408 business-hotel rooms within 2 km of its venues, yet its exam / away-trip mention rate in reviews is the lowest of the eight areas at 0.18%, while its quietness and breakfast ratings are near the top. The upside lies in positioning as lodging for exam takers.
Related Articles
- Exam-Night Hotels: 2,203 Rooms Near Kyoto Univ, Zero at Osaka Toyonaka
- Hotels for Japan’s Jan 2027 Entrance Exam: 67.5% Sold Out at Day 43
- Japan Wedding Peak Nov 2026: Taian Saturdays Flat, Holidays +89%
References and Sources
■ Data sources
The FY2026 (Reiwa 8) venue list (650 venues, 496,237 applicants) and overview of results published by the National Center for University Entrance Examinations; MetroEngines Research’s property and room stock, estimated settled ADR and listed prices (N=3,853 properties); and the HotelBank Editorial Team’s NLP analysis of guest reviews (N=1,279 properties, 1,052,323 reviews, October 2024–September 2026).
■ Estimation assumptions
464,090 test takers (FY2026 actual; FY2027 assumed to be the same scale), overnight share of 1% / 3% / 5%, one room per test taker, two nights before the tests (Friday and Saturday). Indicative room revenue = room-nights × estimated settled ADR of business hotels in January 2026 (Hiroshima Prefecture ¥7,047 to Tokyo ¥12,550). The 2 km radius is the straight-line distance from the venue address.
■ Limitations and caveats
There are no published statistics on the share of remote-area test takers, and the overnight share is a placeholder used to show a range. Rooms within 2 km are limited to properties whose listings were confirmed between March and September 2026 and exclude properties not listed on OTAs. The exam / away-trip mention rate includes away trips for watching sports, concerts and the like. January 2027 prices are estimates based on listings at the time of the survey (September 2026) and will change. Demand from the individual examinations of national and public universities (from late February) is not included.
- National Center for University Entrance Examinations, “FY2026 (Reiwa 8) Examination” (venue list and overview of results)
- National Center for University Entrance Examinations, “FY2027 (Reiwa 9) Common Test for University Admissions Q&A” (venue assignment)
- National Center for University Entrance Examinations, “Trends in Applicants, Test Takers and Average Scores”
- ReseMom, “[Common Test 2027] Implementation guidelines released: main test on Jan 16–17” (June 3, 2026)
- Geospatial Information Authority of Japan, place-name and address search (locating venue addresses)
- MetroEngines Research — property and room stock, estimated settled ADR, listed prices (N=3,853 properties)
- HotelBank Editorial Team research — NLP analysis of guest reviews (N=1,279 properties, 1,052,323 reviews)