

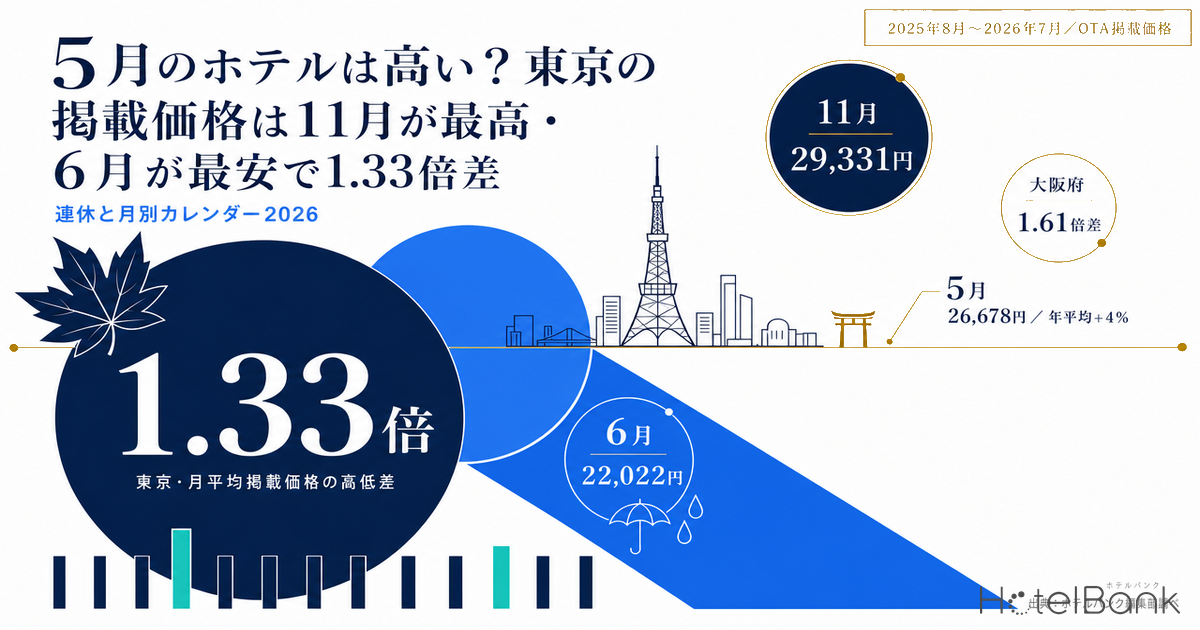
Is the common belief that “hotels are expensive in May” and “you can never get a room during the holidays” actually true? Lining up OTA advertised prices for Tokyo and Osaka month by month over the most recent 12 months (August 2025 to July 2026), the answer is that May is on the high side but not the peak. Tokyo’s most expensive month is November (monthly average ¥29,331), followed by April (¥29,018). The cheapest is June (¥22,022), a 1.33x spread between high and low. May comes in at ¥26,678, only about 4% above the annual average (¥25,591). Osaka peaks in October (¥23,461) and bottoms out in June (¥14,558), a 1.61x spread — a wider swing than Tokyo. This article organizes the question of which months are expensive and when to travel cheaply strictly along the axes of month and holiday period. City-by-city price levels and the question of why a particular city is expensive are left to our other articles.
• “Advertised price” here means the listed rate per room per night (tax-inclusive basis) in OTA public data, averaged at the prefecture level by month. It differs from actual transacted rates and from the final amount paid.
• Monthly averages blend the handful of holiday days with the weekdays around them. Prices on the holidays themselves run above this level.
• The period covered is the 12 months from August 2025 to July 2026. Sample sizes are approximately 1,650-2,400 properties for Tokyo, 870-1,250 for Osaka, 1,400-2,150 for Hokkaido, and 1,700-2,200 for Okinawa (varying by month).
• Figures are as of August 2026. September 2026 values are a forward aggregation at the time of booking and are not final.
• Source: HotelBank Editorial Team research
- — Tokyo peaks in November at ¥29,331 and bottoms out in June at ¥22,022, a 1.33x spread. The “May is expensive” belief holds up only to ¥26,678, just +4% against the annual average (¥25,591) — the real peaks are in spring and autumn.
- — Osaka swings more widely than Tokyo, at 1.61x. Against an October high of ¥23,461, the June low of ¥14,558 is just over 60% of that level.
- — Peaks and troughs invert between cities and resorts. August (¥23,151), a trough for Tokyo, is the annual high point for Hokkaido (¥29,013) and Okinawa (¥29,408).
- — Hokkaido’s cheapest month is April (¥20,335), the same month Tokyo peaks at ¥29,018. If you can choose your timing, shifting region against the crowd is the single most effective move.
- — Silver Week 2026 runs September 19-23, the first five-day run in 11 years. Tokyo’s forward aggregation for September stands at ¥25,421, roughly +5% against the same month a year earlier (¥24,312) — but this is not a final figure.
Direct answer: November, April and October are expensive; June, July and January are cheap (Tokyo)
Ranking Tokyo’s monthly average advertised prices from high to low gives November (¥29,331) > April (¥29,018) > October (¥28,106) > March (¥27,407) > December (¥26,971) > May (¥26,678). On the cheap side, the order is June (¥22,022) < July (¥22,651) < January (¥23,040) < August (¥23,151), all of them 9-14% below the annual average. In other words, the structure is peaks in the autumn foliage season and in spring (cherry blossoms through Golden Week), troughs in the rainy season, high summer and the post-New Year lull.
The surprise is that August sits on the cheap side. The few days of the Obon period are certainly expensive, but on a monthly average basis, business demand in central Tokyo thins out as people head home or travel, and hotels in the capital’s business districts cut their rates. November, conversely, hits the annual high despite having no long holiday, because autumn foliage tourism, the autumn exhibition and conference season, and inbound visitors all overlap. Judging which months are expensive on the presence of a long holiday alone leads you astray. Which specific days within November demand actually lands on is tracked day by day in Culture Day 2026 Falls Tuesday: Demand Peaks on Holiday Eve, +9.3pt.
Month-by-month calendar: advertised prices in Tokyo, Osaka, Hokkaido and Okinawa (August 2025 – July 2026)
These are advertised prices (per room per night, tax-inclusive basis) from OTA public data, averaged by prefecture and by month. Figures are as of August 2026, covering approximately 1,650-2,400 properties in Tokyo, 870-1,250 in Osaka, 1,400-2,150 in Hokkaido and 1,700-2,200 in Okinawa (varying by month). The difference against the annual average is shown in the right-hand column.
| Month | Tokyo | Osaka | Hokkaido | Okinawa | Tokyo vs. annual avg. | Main holidays / events |
|---|---|---|---|---|---|---|
| Aug 2025 | 23,151 | 21,415 | 29,013 | 29,408 | −10% | Obon (trough in cities, peak in resorts) |
| September | 24,312 | 22,643 | 25,656 | 24,926 | −5% | Silver Week (scattered days in 2025) |
| October | 28,106 | 23,461 | 24,269 | 24,062 | +10% | Autumn travel season; Osaka in the closing weeks of the Expo |
| November | 29,331 | 20,302 | 22,206 | 22,901 | +15% | Autumn foliage; autumn exhibition season |
| December | 26,971 | 18,643 | 23,972 | 23,400 | +5% | Year-end and New Year (concentrated in the final third) |
| Jan 2026 | 23,040 | 16,592 | 24,607 | 23,316 | −10% | Post-New Year trough (ski season in Hokkaido) |
| February | 24,409 | 16,581 | 26,416 | 25,072 | −5% | Sapporo Snow Festival; Lunar New Year |
| March | 27,407 | 17,940 | 21,795 | 24,719 | +7% | Spring school break; cherry blossoms |
| April | 29,018 | 18,477 | 20,335 | 25,026 | +13% | Cherry blossoms; first half of Golden Week (from April 29) |
| May | 26,678 | 18,730 | 23,389 | 25,662 | +4% | Second half of Golden Week (May 2-6) |
| June | 22,022 | 14,558 | 25,122 | 25,047 | −14% | Rainy season; no public holidays (cheapest) |
| July | 22,651 | 14,875 | 28,694 | 29,766 | −11% | First half of the summer holidays (peak in resorts) |
Bold = each region’s highest month; italics = its cheapest month. Source: HotelBank Editorial Team research (monthly average advertised prices from OTA public data, as of August 2026). Tokyo’s annual average is ¥25,591. Osaka’s figures for August-October 2025 include levels recorded during the Expo 2025 Osaka, Kansai period (which closed on October 13, 2025). No month showed a material drop in sample size, and no month was excluded.
Figure 1 source: HotelBank Editorial Team research (OTA public data, as of August 2026). Chart labels are in Japanese: the series are Tokyo (東京都) and Osaka (大阪府), and the title reads “Figure 1: Monthly average advertised price trend (¥, per room per night), August 2025 – July 2026”.
Redrawing the same 12 months for Hokkaido and Okinawa shows that the peaks and troughs are almost exactly the mirror image of Tokyo’s. The two resort prefectures top out in summer (July-August), the very period when Tokyo is in a trough; conversely, April, when Tokyo peaks, is Hokkaido’s cheapest month of the year.
Figure 2 source: HotelBank Editorial Team research (OTA public data, as of August 2026). N = approximately 1,400-2,150 properties in Hokkaido, 1,700-2,200 in Okinawa, and 1,650-2,400 in Tokyo (varying by month). Chart labels are in Japanese: the series are Hokkaido (北海道), Okinawa (沖縄県) and Tokyo for reference (東京都(参考)), and the title reads “Figure 2: Peaks and troughs in the two resort prefectures versus Tokyo (¥, per room per night)”.
Indexing each of the four regions to its own annual average as 100 isolates the position of the peaks and troughs so they can be compared directly. Tokyo and Osaka form their peaks in spring and autumn, while Hokkaido and Okinawa peak in summer — and April, Tokyo’s peak, is Hokkaido’s annual floor.
Figure 3 source: HotelBank Editorial Team research (monthly average advertised prices from OTA public data, as of August 2026). The 12-month averages are ¥25,591 for Tokyo, ¥18,685 for Osaka, ¥24,623 for Hokkaido and ¥25,275 for Okinawa. N = approximately 1,650-2,400 properties in Tokyo, 870-1,250 in Osaka, 1,400-2,150 in Hokkaido and 1,700-2,200 in Okinawa (varying by month). Chart labels are in Japanese: the series are Tokyo (東京都), Osaka (大阪府), Hokkaido (北海道) and Okinawa (沖縄県), the title reads “Figure 3: Monthly index with each region’s annual average set to 100, August 2025 – July 2026”, and the y-axis reads “annual average = 100”.
Where the long holidays sit: how Golden Week, Obon, Silver Week and New Year differ
Because a monthly average blends the few days of a long holiday with the weekdays around them, the holidays themselves run above the levels in this table. With that caveat, mapping Japan’s four major holiday periods onto the monthly data reads as follows.
- Golden Week (in 2026: April 29 and May 2-6): April is Tokyo’s second most expensive month, and May also runs above the annual average. Because prices stay elevated from the late-March-to-April cherry blossom season straight through the holiday, it is less that May is expensive than that the whole of spring is. Levels settle from mid-May onward, then bottom out in June.
- Obon (in 2026, centered on August 13-16): August is Hokkaido’s annual high (¥29,013), and Okinawa’s August (¥29,408) is its second-highest month after July (¥29,766) — resort areas form a clear summer peak. Tokyo and Osaka, by contrast, sit below their annual averages in August: for city hotels this is the month business demand drains away. “Obon is expensive” applies to resorts only.
- Silver Week (in 2026: a five-day run from Saturday September 19 to Wednesday September 23): September 2025 was a scattered set of days and formed no peak, but in 2026 a citizens’ holiday (September 22) falls between Respect for the Aged Day (the 21st) and the Autumnal Equinox (the 23rd), producing the first five-day run in 11 years. In advertised prices at the time of booking (a forward aggregation as of August 2026), Tokyo’s September stands at ¥25,421, roughly 5% above the same month a year earlier (¥24,312), so the holiday effect is starting to show up in prices. Note, however, that a forward aggregation includes levels recorded before markdowns on unsold inventory are applied, so it tends to run higher than the final figure.
- Year-end and New Year: December runs +5% against Tokyo’s annual average, but because demand concentrates into a handful of days late in the month, weekdays in early and mid-December are comparatively easy to book. January drops sharply once the first three days of the year are past, making it Tokyo’s second-cheapest month after June.
For Silver Week itself, staying put in one place for several nights is the lever that matters: properties with multi-night rate structures keep the per-night price from climbing across a five-day run, which is the opposite of what happens when you move hotels each night.
Why prices move: demand shifts, supply does not
The reason hotel prices change by month is simple: the number of guest rooms is roughly the same all year, while the number of people who want to stay varies enormously month to month. Demand in Tokyo in November rises as foliage, exhibitions and inbound visitors overlap, but the room count does not rise with it, so the adjustment comes through price. June, conversely, has no public holidays, sees tourism fall off in the rainy season, and hosts few school trips or corporate training sessions, so the same rooms are offered more cheaply. The shortest route to avoiding the expensive months, then, is to shift your itinerary into the demand troughs — June, mid-to-late January, and August in the cities.
The other thing that is easy to miss is the regional inversion of peaks. As Table 1 shows, August, Tokyo’s trough, is the high point for Hokkaido and Okinawa, while April, Hokkaido’s trough, is one of Tokyo’s peaks. If you have latitude on timing for both business travel and leisure, going against the grain — Tokyo business trips in June-August, Hokkaido travel in April-May — is the most effective move of all.
How to choose: three calls for travelers who can pick their dates
- For city stays, take June, the second half of January, or August. Tokyo in June is 14% below its annual average, and on a city-wide average basis roughly 25% below November, its most expensive month (differences by property and room type aside). Osaka’s spread is wider still: June came in at just over 60% of October’s level.
- For resorts, go when the cities are peaking. Hokkaido’s April (¥20,335) is 70% of its August (¥29,013); Okinawa’s November (¥22,901) is just under 80% of its August (¥29,408). Heading north or south while the main island is crowded for cherry blossoms or autumn foliage takes you off the price peak.
- If you cannot avoid a holiday period, use the weekdays within the month. Even in months containing a long holiday, the weekdays before and after it typically sit below the monthly average. For Golden Week, shifting to mid-April or to mid-May onward; for the New Year period, staying inside the first half of December — the same month can produce a very different bill. How far prices swing from day to day within a single month is measured in Japan Autumn 2026 Hotel Price Range: 3.3x CV Gap Across 47 Prefectures.
If what you want to know is the baseline rate rather than the month, see Business Hotel Price Surge: National ADR Analysis & 10 Cost-Effective Prefectures; for why a particular city is expensive, see Why Hotels Feel Expensive in Obihiro, Fukui & Okayama: 393-City Check. This article confines itself to the timing axis and leaves the city-level detail to those two.
Frequently asked questions
Are hotels in May really expensive?
The answer is “expensive, but not the most expensive.” Tokyo in May averages ¥26,678 a month, only about 4% above the annual average of ¥25,591. The highest month is November (¥29,331), followed by April (¥29,018) and October (¥28,106). The few days in the second half of Golden Week (May 2-6 in 2026) do run above the monthly average, but taking the month as a whole, April is the more expensive month of the spring.
Which is the cheapest month in Tokyo?
Across the August 2025 – July 2026 aggregation, June (¥22,022) is the cheapest, 14% below the annual average. It is followed by July (¥22,651), January (¥23,040) and August (¥23,151). June has no public holidays and tourism demand falls in the rainy season, so the same rooms are offered more cheaply. Against November, the most expensive month, the level is roughly 25% lower.
Does Obon always mean higher prices?
It holds for resort areas, but not for cities. Hokkaido’s August, at ¥29,013, is its annual high, and Okinawa’s August is also elevated at ¥29,408. Tokyo’s August (¥23,151) and Osaka’s (¥21,415), by contrast, both sit below their annual averages. Because business demand in the city centers drains away during the homecoming season, city hotels are in a trough instead.
When is Silver Week 2026, and what are prices likely to do?
In 2026 it is a five-day run from Saturday September 19 to Wednesday September 23, with a citizens’ holiday falling between Respect for the Aged Day and the Autumnal Equinox — the first such alignment in 11 years. Tokyo’s September advertised price stands at ¥25,421 in the forward aggregation as of August 2026, roughly 5% above the ¥24,312 recorded a year earlier. Note, however, that a forward aggregation includes levels recorded before markdowns on unsold inventory are applied, so it tends to run higher than the final figure.
When is it cheapest to visit Hokkaido or Okinawa?
Hokkaido’s cheapest month of the year is April (¥20,335), about 70% of its August level (¥29,013). Okinawa is cheapest in November (¥22,901), just under 80% of its August (¥29,408). Both fall in periods when the main island is crowded for cherry blossoms or autumn foliage, so moving north or south while Tokyo and Osaka peak takes you off the price peak.
Methodology and sources
- Prices are the monthly average of advertised rates per room per night (tax-inclusive basis) for listed properties within each prefecture, based on OTA public data (HotelBank Editorial Team research, as of August 2026). The amount actually paid varies by property, room type and booking timing.
- The period covered is the 12 months from August 2025 to July 2026. Sample sizes are approximately 1,650-2,400 properties for Tokyo, 870-1,250 for Osaka, 1,400-2,150 for Hokkaido and 1,700-2,200 for Okinawa (varying by month). The September 2026 value is a forward aggregation at the time of booking and is not final.
- Holiday dates were confirmed against the 2026 calendar (Golden Week: April 29 and May 2-6; Silver Week: September 19-23).
■ Data sources
Advertised prices in OTA public data (per room per night, tax-inclusive basis), aggregated by this company at the prefecture and month level (HotelBank Editorial Team research, as of August 2026). Calendar and holiday dates follow Japan’s 2026 public holidays. Table 1 and Figures 1 through 3 are all built from the same aggregation.
■ Calculation assumptions
The monthly average is a simple average weighting every day of the month equally, blending the holidays themselves with the weekdays around them. The comparison against the annual average uses each region’s 12-month average as the denominator (Tokyo ¥25,591, Osaka ¥18,685, Hokkaido ¥24,623, Okinawa ¥25,275). The index in Figure 3 divides each month’s value by the region’s annual average set to 100, and is intended to compare the position of peaks and troughs rather than price levels between regions.
■ Limitations and caveats
Advertised prices differ from actual transacted rates and from the final amount paid, and differences by property, room type and booking timing do not surface in a prefecture-level average. The September 2026 value is a forward aggregation at the time of booking and includes levels recorded before markdowns on unsold inventory are applied, so it tends to run higher than the final figure. Osaka’s figures for August-October 2025 include levels recorded during the Expo 2025 Osaka, Kansai period (which closed on October 13, 2025). Sample sizes vary by month, but no month showed a material drop and none was excluded.
Related reading
- Culture Day 2026 Falls Tuesday: Demand Peaks on Holiday Eve, +9.3pt
- Japan Autumn 2026 Hotel Price Range: 3.3x CV Gap Across 47 Prefectures
- Osaka Sep 2026 Holiday: Demand Peaks First 2 Nights, Sep 23 at 58.0%
- Silver Week 2026 Back Half at T-47: Sep 23 Matches a Normal Wednesday
- NPB Away-Game Hotels 2026: ¥17,655-41,351 Across 12 Home Cities
- Business Hotels for Long Stays: 6 Checks and ¥16,722 a Night in Tokyo