

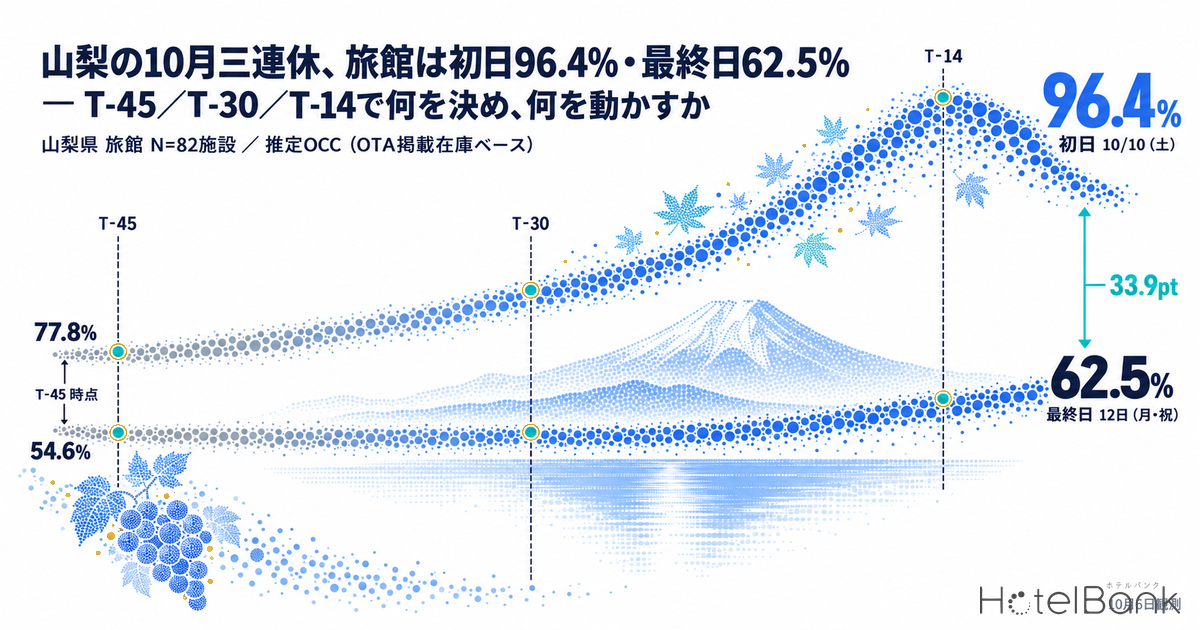
Looking at booking progress for ryokan, resort hotels and business hotels in Yamanashi Prefecture over the three-day weekend from Saturday, October 10 to Monday, October 12 (Sports Day), as observed on October 6, estimated OCC (OTA-listed inventory basis) for the first night, October 10, had already reached near-sellout levels four days before arrival: 96.4% for ryokan, 94.6% for resort hotels and 99.0% for business hotels. The last night, October 12, by contrast, stood at only 62.5%, 80.6% and 70.9% respectively, leaving a gap within the same holiday weekend of 33.9 pt for ryokan and 28.1 pt for business hotels. This gap did not appear at the last minute: 45 days before arrival it was already open, at 77.8% vs 54.6% for ryokan and 80.1% vs 54.3% for business hotels. This article cuts the booking curve at three points — 45 days out (T-45), 30 days out (T-30) and 14 days out (T-14) — and sets out what was visible at each point, what should have been decided and what should have been set in motion, as a back-calculation procedure that can be reused for holiday weekends from next month onward.
Coverage: Yamanashi Prefecture — ryokan N=82 properties (2,477 rooms), resort hotels N=31 properties (1,842 rooms), business hotels N=44 properties (3,792 rooms) (all fixed cohorts based on listings on major booking sites). The price metric in this article is the estimated settled ADR (the settled price level estimated from OTA and other sales data, tax-excluded equivalent); occupancy is an estimate based on OTA-listed inventory. Definitions for both are at the end of the article. Data as of: October 7, 2026 (latest curve observation: October 6).
• Estimated settled ADR (average daily rate) = an estimated settled unit price (tax-excluded equivalent), calculated by applying a category-specific adjustment factor to the lowest-plan price level each property publishes on OTAs (two guests sharing one room, per-room rate, tax included). Checked against published operating results, the median error is about 6.6%. These are estimates and differ from each property’s actual settled prices and accounting figures.
• Estimated settled ADR at the area (prefecture) and category level is a monthly metric: the median of the estimated settled unit prices of the covered properties (the level of a typical property). Daily and day-of-week price levels are not covered.
• Wherever listed prices are mentioned, they are per-room rates for two guests sharing one room (tax included).
• Estimated OCC (occupancy rate) = rooms sold as a share of total rooms in the area (an estimate based on OTA sales inventory). This article labels it “estimated OCC (OTA-listed inventory basis).”
• Source: MetroEngines Research (continuous tracking of published OTA prices and inventory in Japan, about 27,000 properties confirmed in operation)
- — As of the October 6 observation, estimated OCC (OTA-listed inventory basis) for the first night of the three-day weekend, October 10, was 96.4% for ryokan, 94.6% for resort hotels and 99.0% for business hotels. The last night, October 12, stood at only 62.5%, 80.6% and 70.9% (Yamanashi Prefecture, October 2026).
- — The gap between the first and last nights did not appear at the last minute. At 45 days out (T-45) it was already open, at 77.8% vs 54.6% for ryokan and 80.1% vs 54.3% for business hotels.
- — T-30 is the decision point that separates “closing out” the first night from “setting up” the last night. From T-45 to T-30, ryokan gained +8.1 pt on the first night but only +2.4pt on the last night.
- — Cumulative gains for the last night since T-45 were +7.9 pt for ryokan and +7.6 pt for resort hotels, roughly 40–60% of the first night’s. Only business hotels gained +16.6pt, close to their first-night gain (+18.9 pt).
- — Anchor the price yardstick on the settled same month of the previous year. Estimated settled ADR in September 2026 was ¥12,300 for ryokan (+2.3% YoY) and ¥8,300 for business hotels (+9.0%).
T-45 — The “shape” of the holiday weekend was already set 45 days out
Start by going back to the 45-day cross-section. Estimated OCC (OTA-listed inventory basis) 45 days before each stay date (observed on August 26 for the first night, October 10) was 77.8% on the 10th, 70.4% on the 11th and 54.6% on the 12th for ryokan; 82.1%, 75.3% and 73.0% for resort hotels; and 80.1%, 63.3% and 54.3% for business hotels. The pattern of a first night around 80% and a last night in the 50% range was already in place for all three categories at this point, and over the following 45 days the whole curve shifted upward while keeping this shape. The first-to-last-night gap was 23.2 pt for ryokan and 25.8 pt for business hotels; only resort hotels had a small gap, at 9.1 pt.
Comparing this pattern with the ordinary weekend just before makes the character of the holiday weekend clearer. The 45-day values for Saturday, October 3 were 69.3% for ryokan and 67.8% for business hotels, so the first night of the holiday weekend, October 10, was ahead by 8.5 pt and 12.3 pt respectively. The last night, October 12, however, at 54.6% (ryokan) and 54.3% (business hotels), was roughly level with — or even below — the 45-day values for the ordinary Sunday of October 4 (ryokan 59.4%, business hotels 53.9%). In other words, the Yamanashi market began booking the final night of the three-day weekend not as a “holiday” night but as an “ordinary Sunday night.”
That resort hotels held 73.0% even on the last night shows how differently each category treats a holiday weekend. Against a 45-day value of 69.6% for the ordinary Sunday of October 4, the 12th was 3.4 pt higher, suggesting that in a category with relatively more guests who stay multiple nights or travel home later, the final night does not weaken as much. What should have been grasped at T-45 was this shape itself — “first night ahead, last night at ordinary-Sunday level” — and the right reading is that the weakness of the last night was not lost demand but a value from a stage when the market did not yet recognize that night as part of a holiday weekend. Our earlier read of the same holiday weekend, based on mid-September observations, showed the same configuration, confirming that the first-night lead and soft last night had held for a month.
Yamanashi ryokan (N=82 properties, 2,477 rooms) — booking curves for the three nights of the October three-day weekend (estimated OCC, OTA-listed inventory basis, from 45 days before the stay date to the latest observation)
Source: compiled by HotelBank Editorial Team from MetroEngines Research data
T-30 — The decision point for treating the first night’s close-out and the last night’s set-up as separate problems
Next, the 30-day cross-section. Estimated OCC 30 days before each stay date (observed on September 10 for the first night) was 85.9% on the 10th, 74.2% on the 11th and 57.0% on the 12th for ryokan; 88.2%, 79.0% and 75.6% for resort hotels; and 86.2%, 71.6% and 64.3% for business hotels. Gains from T-45 to T-30 were +8.1 pt on the first night vs +2.4 pt on the last night for ryokan and +6.1 pt vs +2.6 pt for resort hotels — demand concentrated on the first night while the last night barely moved. Only business hotels gained more on the last night (+10.0 pt) than on the first (+6.1 pt), suggesting that business and work-related bookings for the Monday night had started coming in by this time.
Overlaying the most recent holiday weekend of the same season, Saturday, September 19 to Monday, September 21 (Respect for the Aged Day), clarifies what T-30 means. Ryokan stood at 81.5% for September 19 at 30 days out, while October 10 was at 85.9% at the same 30 days out, 4.4 pt ahead — the first night of the October weekend was building faster than the first night of the September weekend. Because the September holiday ran into a five-day stretch, with Tuesday the 22nd a national holiday and Wednesday the 23rd the Autumnal Equinox Day, the nights of the 20th and 21st were “middle nights of a holiday” and had passed 90% at 30 days out; the 11th and 12th in October had no such support behind them. At T-30, then, the two ends had diverged in nature: the first night was a close-out problem — “how much to sell the remaining rooms for, and until when” — and the last night was a demand-creation problem — “what to set up, and for which guest segments.”
| Category (N=) | Stay date | T-45 (45 days out) | T-30 (30 days out) | T-14 (14 days out) | Latest (10/6) | T-45 → latest gain | Sold-out share (latest, est.) |
|---|---|---|---|---|---|---|---|
| Ryokan (N=82) | Oct 10 (Sat) | 77.8 | 85.9 | 91.0 | 96.4 | +18.6pt | 69.5% |
| Oct 11 (Sun) | 70.4 | 74.2 | 79.3 | 85.2 | +14.8pt | 40.2% | |
| Oct 12 (Mon, holiday) | 54.6 | 57.0 | 59.3 | 62.5 | +7.9pt | 17.1% | |
| Resort hotels (N=31) | Oct 10 (Sat) | 82.1 | 88.2 | 91.7 | 94.6 | +12.5pt | 64.5% |
| Oct 11 (Sun) | 75.3 | 79.0 | 86.5 | 89.6 | +14.3pt | 16.1% | |
| Oct 12 (Mon, holiday) | 73.0 | 75.6 | 78.7 | 80.6 | +7.6pt | 12.9% | |
| Business hotels (N=44) | Oct 10 (Sat) | 80.1 | 86.2 | 94.9 | 99.0 | +18.9pt | 86.4% |
| Oct 11 (Sun) | 63.3 | 71.6 | 79.6 | 87.8 | +24.5pt | 29.5% | |
| Oct 12 (Mon, holiday) | 54.3 | 64.3 | 66.1 | 70.9 | +16.6pt | 6.8% |
Latest = observed on October 6 (4 days before arrival for Oct 10, 5 days for Oct 11, 6 days for Oct 12). Sold-out share = the share of properties with no listed inventory visible on OTAs and other channels (estimate).
Source: compiled by HotelBank Editorial Team from MetroEngines Research data
T-14 — How much moved in the last two weeks, and how to read the remaining headroom
At 14 days before each stay date (observed on September 26 for the first night), ryokan had built up to 91.0% on the 10th, 79.3% on the 11th and 59.3% on the 12th; resort hotels to 91.7%, 86.5% and 78.7%; and business hotels to 94.9%, 79.6% and 66.1%. Gains from there to the latest observation on October 6 were +5.4 pt, +5.9 pt and +3.2 pt for ryokan and +4.1 pt, +8.2 pt and +4.8 pt for business hotels: the first night, already above 90%, had little room left, and the biggest move came on the middle night, the 11th. Last-night gains stayed within +1.9 to +4.8 pt across all three categories, and even counted cumulatively from T-45 they reached only about 40–60% of the first night’s — ryokan +7.9 pt (first night +18.6 pt) and resort hotels +7.6 pt (first night +12.5 pt). Only business hotels built up +16.6 pt, close to their first-night gain (+18.9 pt).
It is too early, however, to treat the latest values as the last night’s final outcome. Looking at how much the ordinary weekend just before moved in its final week, ryokan rose +11.4 pt for Saturday, October 3 (from 79.8% at 7 days out to 91.2% the day before) and +10.8 pt for Sunday the 4th (from 66.8% to 77.6%); resort hotels rose +7.1 pt on the 3rd and +8.7 pt on the 4th, and business hotels +4.7 pt on the 3rd and +7.1 pt on the 4th — gains from the mid-single digits to double digits in the final week even on an ordinary weekend. The 12th’s 62.5% for ryokan and 70.9% for business hotels are values from six days before arrival; if this market’s usual last-minute movement is repeated, the last night would reach the 70% range, but it is not certain that return-trip demand on the final night of a holiday weekend behaves the same way as on an ordinary Sunday.
To sum up so far, the three nights of the holiday weekend each have a different decisive factor, shifted by one day: “first night = precision of the close-out,” “middle night = growth in the final two weeks,” and “last night = return-trip demand in the final week.” Averaging September’s settled results (observed the day before each stay date) by day of week, ryokan stood at 92.2% on Saturdays vs 80.9% on Sundays and 79.0% on Mondays, and business hotels at 95.3% on Saturdays vs 81.5% on Sundays — even in ordinary non-holiday weeks there is an 11–14 pt step between Saturday and Sunday. In the Yamanashi market, then, the weak final night of a three-day weekend is not an exception but an extension of the same structure as an ordinary weekend’s Sunday night. A 45-day back-calculation of the same holiday weekend in neighboring Nagano Prefecture likewise found the first-to-last-night gap to be the central issue.
Yamanashi Prefecture, 3 categories — latest (observed October 6) estimated OCC for the three nights of the holiday weekend (OTA-listed inventory basis, %)
Source: compiled by HotelBank Editorial Team from MetroEngines Research data
Estimated settled ADR — anchor the yardstick for a holiday month’s price band on the “settled same month of the previous year”
The price yardstick is checked with the monthly estimated settled ADR (tax-excluded equivalent). Taking year-on-year comparisons between settled months, September 2026 came to ¥12,300 for ryokan (N=169), +2.3% on the previous September’s ¥12,000 (N=155); ¥20,400 for resort hotels (N=60), +4.2% on the previous year’s ¥19,600 (N=58); and ¥8,300 for business hotels (N=73), +9.0% on the previous year’s ¥7,600 (N=70). All three categories entered the holiday month above the previous year, with business hotels growing the most. Last year’s settled values show October 2025 at ¥12,200 for ryokan (N=155), ¥20,100 for resort hotels (N=57) and ¥7,800 for business hotels (N=69) — almost the same level as September — with ryokan’s high-price months falling in August during the summer holidays (¥14,800, N=148), in November as autumn foliage peaks (¥14,700, N=155), and in December, the year’s highest (¥15,900, N=153). For ryokan, the October three-day weekend is therefore not a price peak but a month for locking in occupancy on the way up to the peak.
Current estimates for October 2026 are ¥12,900 for ryokan (N=167), ¥20,000 for resort hotels (N=59) and ¥11,300 for business hotels (N=72). All are estimates based on current sales, and because the business hotel value steps away from the settled series through September, a simple comparison with settled values has to wait for the month-end settlement. What can be read here is only that October for ryokan and resort hotels is running within a band not far from the previous October’s settled values; price differences across the three nights of the holiday and daily levels are outside the scope of this metric. Price bands by municipality within the prefecture (such as Lake Kawaguchiko and Kofu) are not covered here.
Yamanashi ryokan — estimated settled ADR (tax-excluded equivalent), year-over-year overlay (2025 settled; 2026 settled for January–September, current estimates for October–November)
Source: compiled by HotelBank Editorial Team from MetroEngines Research data
| Category | Sep 2025 settled | Sep 2026 settled | YoY | Oct 2025 settled | Oct 2026 current estimate |
|---|---|---|---|---|---|
| Ryokan | ¥11,996 (N=155) | ¥12,275 (N=169) | +2.3% | ¥12,192 (N=155) | ¥12,916 (N=167) |
| Resort hotels | ¥19,550 (N=58) | ¥20,362 (N=60) | +4.2% | ¥20,061 (N=57) | ¥19,956 (N=59) |
| Business hotels | ¥7,606 (N=70) | ¥8,291 (N=73) | +9.0% | ¥7,777 (N=69) | ¥11,262 (N=72) |
YoY compares settled months (September 2025 vs September 2026). October 2026 is an estimate based on current sales and may change, so a simple comparison with settled values has to wait for the month-end settlement.
Source: compiled by HotelBank Editorial Team from MetroEngines Research data
For revenue managers running ryokan, resort hotels and business hotels in Yamanashi — implications and action plan
Operational Insights
1. The shape of a holiday weekend can be read at T-45. The market’s first-to-last-night gap was 23.2 pt for ryokan and 25.8 pt for business hotels at 45 days out, and this pattern held right up to the latest observation. When checking your own booking pace against the market curve, look first at “whether the gap between your first and last nights has the same shape as the market’s” rather than “what percentage you are at now.” If your last night is well below the market’s 54–55% (ryokan and business hotels at T-45), there is reason to suspect an exposure or sales-condition problem rather than a demand problem.
2. T-30 is the day that separates “closing out” from “setting up.” The first night had reached 85.9% for ryokan and 86.2% for business hotels at 30 days out. On a date when the market is at this level, rooms sell even if held back for a long time, so if your first night is in line with the market, the issue from then on shifts to how the inventory is sold (reviewing minimum-stay and multi-night conditions). The last night, meanwhile, stood at 57.0% for ryokan and 64.3% for business hotels, calling for a different decision on the same day.
3. The last night’s weakness is structural, and the final week’s movement partly fills it. September’s settled results show an estimated OCC gap between Saturday and Sunday of 11.3 pt for ryokan and 13.8 pt for business hotels even on ordinary weekends, and the final night of the three-day weekend follows the same pattern. On the ordinary weekend just before, ryokan gained +10.8 to +11.4 pt from 7 days out to the day before, so it makes sense to design the last night from the outset as “inventory for last-minute sales” rather than “unsold rooms.”
4. Anchor the price yardstick on the settled same month of the previous year. September 2026 settled values were ¥12,300 for ryokan, ¥20,400 for resort hotels and ¥8,300 for business hotels, all above the same month of the previous year. Because October’s estimates may change, it is safer to frame holiday pricing decisions as “where your property sits relative to last October’s settled values (ryokan ¥12,200, resort hotels ¥20,100, business hotels ¥7,800).”
| Timing | Action | Decision trigger (tied to the figures in this article) | Aim |
|---|---|---|---|
| T-45 | Overlay your own curves for the three nights on the market’s and check the first-to-last-night gap | Market: first night 77.8–82.1%, last night 54.3–73.0% (T-45, by category). If your last night is below this range, review exposure and sales conditions | Separate a demand shortfall from a sales-design problem |
| T-45 | Decide inventory allocation in advance, treating the last night as “inventory for last-minute sales” | Ordinary-weekend Sunday nights run 11–14 pt below Saturdays (September settled results). Revisit if you are still selling the last night on the same terms as the first | Design the final night so it does not end up as unsold rooms |
| T-30 | Set the first night’s close-out conditions (minimum stay, multi-night conditions, how remaining rooms are released) | Market first night: ryokan 85.9%, resort hotels 88.2%, business hotels 86.2% (T-30). If you are at or above market, shift the focus to how remaining rooms are sold | Sell the first night’s remaining rooms on the best terms |
| T-30 | Start setting up the last night (multi-night paths, final-night-only stay offers, later timings matched to the trip home) | Market last night: ryokan 57.0%, business hotels 64.3% (T-30), with only +2.4 pt gained since T-45 for ryokan. Treat this as a period when waiting will not move it | Create final-night demand from your own side |
| T-14 | Check the middle night’s remaining rooms and confirm what can be sold as a multi-night stay with the first night | Gains from T-14 to the latest observation are largest on the middle night (ryokan +5.9 pt, business hotels +8.2 pt). If you have more middle-night rooms left than the market (ryokan 79.3%, business hotels 79.6%), redesign multi-night conditions | Capture the final two weeks’ growth through multi-night stays |
| Final week | Concentrate last-minute sales on the last night and track the daily gap between your remaining rooms and the market | On the ordinary weekend, ryokan gained +10.8 to +11.4 pt from 7 days out to the day before. If your last night is not growing at this pace, there is room to adjust sales conditions in the remaining days | Bring the final night’s outcome closer to the 70% range |
Source: compiled by HotelBank Editorial Team from MetroEngines Research data
Summary — measuring a three-day weekend with three yardsticks
First, the shape of a holiday weekend is set at T-45. Yamanashi’s October three-day weekend had a first night around 80% and a last night in the 50% range already in place at 45 days out, and the first-to-last-night gap then stayed wide right up to the latest observation, at 33.9 pt for ryokan and 28.1 pt for business hotels. Second, T-30 is the day that separates closing out from setting up. The first night, at 85.9% for ryokan and 86.2% for business hotels, had moved on to the question of how to sell the inventory, while the last night, at 57.0% for ryokan and 64.3% for business hotels, was at a stage where waiting would not move it. Third, the last night’s weakness has the same structure as an ordinary weekend’s Sunday night, and given that this market sees gains of around +10 pt in the final week even on ordinary weekends, the realistic approach is to design the final night from the outset as inventory for last-minute sales. For pricing, use the settled same month of the previous year in the monthly estimated settled ADR as the yardstick (October 2025: ryokan ¥12,200, resort hotels ¥20,100, business hotels ¥7,800), and wait for the month-end settlement before checking the current estimates against it.
Frequently Asked Questions
Q. Is the weak last night of a three-day weekend specific to Yamanashi Prefecture?
A. This article covers only the three categories in Yamanashi Prefecture. That said, September’s settled results also show ordinary-weekend Sunday nights running 11–14 pt below Saturdays, and the final night of a three-day weekend can be read as an extension of that. Comparison with other prefectures would require a separate analysis.
Q. How high will estimated OCC for the 12th eventually rise?
A. This article is a snapshot as of October 6 and does not forecast the outcome. For reference, on the ordinary weekend just before, ryokan gained +10.8 to +11.4 pt between 7 days out and the day before.
Q. Can estimated settled ADR show price differences across the three nights of a holiday weekend?
A. Estimated settled ADR is a monthly metric and does not cover daily or day-of-week price levels. For holiday pricing decisions, we recommend using the settled value for the same month of the previous year as the yardstick.
About the Data
• Definition of estimated OCC (OTA-listed inventory basis): OTA-listed inventory occupancy = 100 − 100 × OTA-listed remaining rooms ÷ total rooms. Coverage is a fixed cohort of properties that list at least 30% of their total rooms on OTAs (the same set of properties for every stay date; N= is the number of properties). It is an estimate based on how inventory sold on OTAs is being absorbed and differs in definition from actual room occupancy (it reads high, because rooms not listed are counted as sold). This article labels it “estimated OCC (OTA-listed inventory basis).”
• Booking curves: based on observations from 45 days before each stay date to the latest. The fixed points are 45, 30 and 14 days before each stay date and the latest observation (October 6). September’s settled results are values observed the day before each stay date.
• Estimated settled ADR: the settled price level (tax-excluded equivalent) estimated from OTA and other sales data (lowest-plan price level × category-specific factor, ensembled across multiple channels). Past months are settled values; current and future months are estimates based on current sales. Checked against published operating results, the median error is 6.6%. It is a monthly metric and does not cover daily or day-of-week price levels.
• Coverage: Yamanashi Prefecture. Booking curves use fixed cohorts of ryokan N=82 properties (2,477 rooms), resort hotels N=31 properties (1,842 rooms) and business hotels N=44 properties (3,792 rooms) (for October 10–12; for the reference dates of October 3–4 and September 19–22, N ranged from 80–94 ryokan, 31–32 resort hotels and 42–46 business hotels; September’s day-of-week averages cover a different number of properties for each stay date, 73–95 ryokan and 40–46 business hotels). N for estimated settled ADR is as stated for each month (ryokan N=148–172, resort hotels N=55–60, business hotels N=69–75).
• Data as of: October 7, 2026. Sales and inventory change daily, so the figures in this article are a snapshot as of the time of retrieval.
• Source: compiled by HotelBank Editorial Team from MetroEngines Research data
References and Sources
■ Data sources
Fixed cohorts of ryokan (N=82 properties, 2,477 rooms), resort hotels (N=31 properties, 1,842 rooms) and business hotels (N=44 properties, 3,792 rooms) in Yamanashi Prefecture were aggregated from the published OTA price and inventory data in Japan that MetroEngines Research tracks continuously (about 27,000 properties confirmed in operation). Data as of October 7, 2026; latest booking-curve observation October 6.
■ Calculation assumptions
The fixed points are four: 45, 30 and 14 days before each stay date, and the latest observation. Gains (pt) are simple differences between the estimates at each point. The ordinary weekend used for comparison (October 3–4) and the September holiday (September 19–23) were aligned to the same day counts before arrival. Estimated settled ADR is the monthly median by category, rounded to the nearest ¥100 in the text and shown to the yen in the tables. The sequence of holidays is based on the Cabinet Office’s published calendar.
■ Limitations
Estimates on an OTA-listed inventory basis read higher than actual room occupancy, because rooms not listed are counted as sold. This article is a snapshot as of the time of retrieval and does not forecast the holiday weekend’s outcome. Estimated settled ADR for October and November 2026 is based on current sales and may change at month-end settlement. Daily and day-of-week price levels are not covered.
■ Public sources
- Cabinet Office, “National Holidays” (in Japanese) (national holidays and other holidays of 2026)