

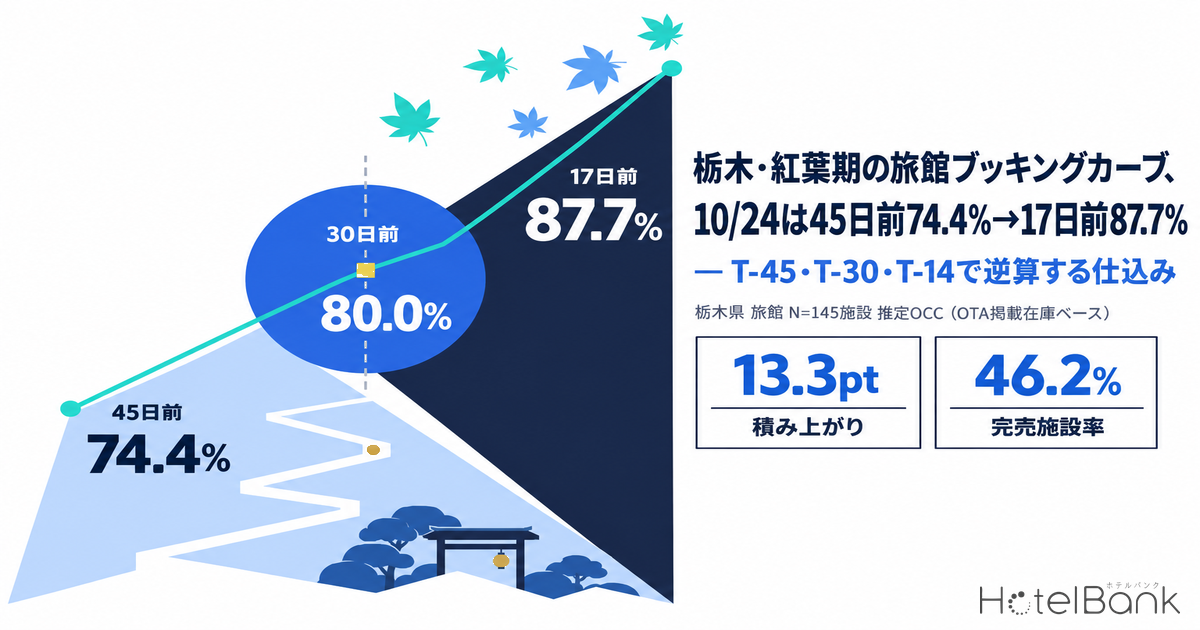
For 145 ryokan in Tochigi Prefecture (5,670 rooms, as listed on major booking sites), the booking curve for stays on Saturday, October 24 — the peak of the autumn foliage season — shows estimated OCC (OTA-listed inventory basis) building from 74.4% at 45 days out to 80.0% at 30 days out and 87.7% at the latest reading 17 days out. That is a gain of 13.3pt, and the sold-out property share nearly doubled from 23.4% to 46.2%. The following Sunday, October 25, moved from 68.9% at 45 days out to 83.3% at 18 days out: it started lower than Saturday but gained a larger 14.4pt. For 28 resort hotels (1,761 rooms), October 24 stood at 72.0% at 45 days out, 83.2% at 30 days out and 88.6% at 17 days out, running 3.2pt ahead of ryokan at the 30-day mark. This article lines up weekend stay dates from early October through late November at three points — 45 days out, 30 days out and the latest reading — and works backward to what Tochigi properties should set up at T-45, T-30 and T-14 during the foliage season.
Coverage: Tochigi ryokan N=145–146 properties (5,597–5,677 rooms) and resort hotels N=28 properties (1,761 rooms), both fixed cohorts based on listings on major booking sites. Occupancy is an estimate based on OTA-listed inventory; the definition is at the end of the article. Pricing is not the subject here; the only price figure cited, for reference, is the estimated transacted ADR (tax-exclusive equivalent) of Tochigi city hotels. Data as of October 8, 2026.
- — Ryokan on Saturday, October 24: 74.4% → 80.0% → 87.7%. Across the three points at 45, 30 and 17 days out, estimated OCC built 13.3pt and the sold-out property share rose from 23.4% to 46.2% (N=145 properties; estimates as of October 7, 2026).
- — The window in which bookings build differs by property type. Resort hotels (N=28 properties) add 9–11pt between 45 and 30 days out; ryokan add 6–10pt after the 30-day mark. Unsold rooms at T-30 should be read differently for each type.
- — Saturday, November 21 is already at 86.2% at 45 days out, almost level with where the October peak stood at 17 days out, while November Sundays sit at only 69.9–70.9%. November preparation centers on locking in the final rate tier for Saturdays and steering guests toward extended stays on Sundays and weekdays.
Ryokan — Saturday, October 24: 74.4% at 45 Days Out, 80.0% at 30, 87.7% at 17
We start by overlaying the ryokan booking curves for the four peak-foliage weekend dates, October 17–18 and 24–25. The starting points at 45 days out were 68.9% for Saturday the 17th, 66.9% for Sunday the 18th, 74.4% for Saturday the 24th and 68.9% for Sunday the 25th — only Saturday the 24th sat a step higher. By 30 days out, the 17th had reached 75.0% (+6.1pt), the 18th 70.9% (+4.0pt), the 24th 80.0% (+5.6pt) and the 25th 77.1% (+8.2pt), a build of 4–8pt over the 15 days from 45 to 30 days out.
The pace of the build, however, picks up after the 30-day mark. The 17th rose 7.9pt from 75.0% at 30 days out to 82.9% at 14 days out, and the 18th rose 8.1pt from 70.9% to 79.0% — larger gains than in the 45-to-30-day window. The 24th added 7.7pt in 13 days, from 80.0% at 30 days out to 87.7% at 17 days out. As of the latest reading (October 7), the sold-out property share was 35.6% for the 17th and 46.2% for the 24th: heading into the foliage peak, close to half of all properties are approaching the point where no listed inventory can be found on OTAs and similar channels for Saturday.
Source: MetroEngines Research; compiled by the HotelBank Editorial Team
Sundays read differently from Saturdays. The 18th barely moved through 30 days out — 66.9% at 45 days and 70.9% at 30 days — and then added 9.4pt to reach 80.3% at 11 days out. The 25th likewise built 14.4pt from 68.9% at 45 days out to 83.3% at 18 days out, a larger gain over that span than Saturday the 24th (13.3pt). Sunday inventory has more slack than Saturday at 45 days out, and the pattern suggests it fills after the 30-day mark as extended stays from Saturday and as Sunday–Monday multi-night stays. The sold-out property share tells the same story: at the latest reading it was 25.5% for the 25th against 46.2% for the 24th, roughly half the Saturday level.
Meanwhile, the three-day weekend of October 10–11, whose stay dates are now arriving, offers a reference point for how the tail of the curve behaves. Saturday the 10th ran 78.4% at 45 days out, 83.8% at 30 days, 89.6% at 14 days and 96.3% at 3 days — a further 6.7pt between 14 and 3 days out — and its sold-out property share reached 73.1%. Sunday the 11th also added 7.7pt, from 82.9% at 14 days out to 90.6% at 4 days out. Even at close to 90% with 14 days to go, the final two weeks still bring further gains; that should be a working assumption when planning sales for the 24th and later dates.
| Stay date | T-45 | T-30 | T-14 | Latest reading | Sold-out share, T-45 | Sold-out share, latest |
|---|---|---|---|---|---|---|
| Oct 10 (Sat) | 78.4 | 83.8 | 89.6 | 96.3 (T-3) | 32.4 | 73.1 |
| Oct 11 (Sun) | 73.2 | 76.7 | 82.9 | 90.6 (T-4) | 23.4 | 50.3 |
| Oct 17 (Sat) | 68.9 | 75.0 | 82.9 | 85.0 (T-10) | 17.2 | 35.6 |
| Oct 18 (Sun) | 66.9 | 70.9 | 79.0 | 80.3 (T-11) | 10.3 | 23.3 |
| Oct 23 (Fri) | 72.2 | 79.1 | — | 84.1 (T-16) | 19.3 | 31.7 |
| Oct 24 (Sat) | 74.4 | 80.0 | — | 87.7 (T-17) | 23.4 | 46.2 |
| Oct 25 (Sun) | 68.9 | 77.1 | — | 83.3 (T-18) | 12.4 | 25.5 |
| Oct 31 (Sat) | 74.8 | 79.8 | — | 83.6 (T-24) | 28.3 | 44.1 |
| Nov 1 (Sun) | 73.8 | 78.5 | — | 80.8 (T-25) | 18.6 | 33.1 |
| Nov 7 (Sat) | 79.8 | — | — | 84.4 (T-31) | 32.6 | 44.8 |
| Nov 8 (Sun) | 69.9 | — | — | 74.3 (T-32) | 16.7 | 20.0 |
| Nov 14 (Sat) | 78.7 | — | — | 81.9 (T-38) | 30.3 | 37.7 |
| Nov 15 (Sun) | 70.9 | — | — | 71.8 (T-39) | 9.0 | 11.0 |
| Nov 21 (Sat) | 86.2 | — | — | 86.2 (T-45) | 43.4 | 43.4 |
Source: MetroEngines Research; compiled by the HotelBank Editorial Team
Resort Hotels — A Bigger Build by 30 Days Out Than Ryokan
Next, the same four dates for 28 resort hotels (1,761 rooms). The starting points at 45 days out were 69.3% for Saturday the 17th, 68.3% for Sunday the 18th, 72.0% for Saturday the 24th and 72.8% for Sunday the 25th, about the same level as ryokan (differences of −2.4 to +3.9pt). By 30 days out, however, the 17th was at 79.6% (+10.3pt), the 18th at 78.7% (+10.4pt), the 24th at 83.2% (+11.2pt) and the 25th at 81.9% (+9.1pt): a build of 9–11pt over the 15 days from 45 to 30 days out, ahead of ryokan over the same window (4–8pt).
After the 30-day mark the pace is closer to that of ryokan. The 17th rose 4.7pt from 79.6% at 30 days out to 84.3% at 14 days out, and the 24th rose 5.4pt from 83.2% at 30 days out to 88.6% at 17 days out — somewhat less than ryokan over the same windows (7.7–7.9pt). In other words, resort hotels build heavily up to 30 days out and then rise gently, whereas ryokan accelerate after the 30-day mark. The latest readings for October 24 have converged at nearly the same level, 87.7% for ryokan and 88.6% for resorts, but the different paths taken to get there are the basis for separating the T-30 playbook by property type.
Source: MetroEngines Research; compiled by the HotelBank Editorial Team
The sold-out property share is lower for resort hotels. At the latest reading for October 24 it was 21.4% for resorts against 46.2% for ryokan, and for the 25th 21.4% against 25.5%. With only 28 properties in the cohort, a change at a single property moves the share by 3.6pt, which calls for caution. Still, a lower share of sold-out properties at the same estimated OCC is consistent with a structure in which resorts have more rooms per property (63 on average, versus 39 for ryokan), so the last few rooms tend to remain.
| Stay date | T-45 | T-30 | T-14 | Latest reading | Sold-out share, T-45 | Sold-out share, latest |
|---|---|---|---|---|---|---|
| Oct 10 (Sat) | 78.0 | 84.0 | 88.5 | 96.9 (T-3) | 25.0 | 75.0 |
| Oct 17 (Sat) | 69.3 | 79.6 | 84.3 | 86.7 (T-10) | 14.3 | 25.0 |
| Oct 18 (Sun) | 68.3 | 78.7 | 83.0 | 84.5 (T-11) | 14.3 | 28.6 |
| Oct 23 (Fri) | 76.5 | 79.6 | — | 83.2 (T-16) | 17.9 | 28.6 |
| Oct 24 (Sat) | 72.0 | 83.2 | — | 88.6 (T-17) | 17.9 | 21.4 |
| Oct 25 (Sun) | 72.8 | 81.9 | — | 86.6 (T-18) | 10.7 | 21.4 |
| Oct 31 (Sat) | 75.2 | 79.7 | — | 83.7 (T-24) | 25.0 | 10.7 |
| Nov 7 (Sat) | 74.8 | — | — | 79.3 (T-31) | 32.1 | 35.7 |
| Nov 14 (Sat) | 74.0 | — | — | 77.1 (T-38) | 10.7 | 17.9 |
| Nov 21 (Sat) | 76.8 | — | — | 76.8 (T-45) | 28.6 | 28.6 |
Source: MetroEngines Research; compiled by the HotelBank Editorial Team
November Weekends — The Build at 45 Days Out Exceeds October’s Foliage Peak
To recap, the October foliage peak has tracked within bands of 67–74% at 45 days out, 71–80% at 30 days out and 80–88% at the latest reading. What about November weekends? Lining up ryokan at 45 days out gives 79.8% for Saturday, November 7, 78.7% for Saturday the 14th and 86.2% for Saturday the 21st — starting 4–12pt above the 74.4% of Saturday, October 24. In particular, November 21, the first day of the three-day weekend that includes Labor Thanksgiving Day, came in at 86.2% with a sold-out property share of 43.4% at its first reading 45 days out, almost level with where October 24 stood at 17 days out (87.7% and 46.2%).
Behind this is the timing of the foliage front. Ryuzu Falls in Oku-Nikko is said to be at its best from early to mid-October in a typical year, and the Irohazaka road from mid-October to early November, with the color moving downhill along the elevation gradient (see the references). Bookings appear to be coming in early for the first half of November, when the towns, the area around Nikko’s shrines and temples, and the lower elevations of Nasu turn color.
Source: MetroEngines Research; compiled by the HotelBank Editorial Team
Sundays start low in November as well. Sunday the 8th stood at 69.9% and Sunday the 15th at 70.9%, a gap of 8–10pt to Saturday — wider than the Saturday–Sunday gap in October (5.5pt between the 24th and 25th). At the latest reading the 8th was at 74.3% and the 15th at 71.8%, gains of only 4.4pt and 0.9pt since 45 days out. The pattern of Saturdays filling early while Sunday inventory has slack was more pronounced in November than in October.
To confirm the day-of-week pattern, it is worth looking at the daily results for September, which are now final. Ryokan (N=117–150 properties) averaged an estimated OCC of 83.6% for the month, with Saturdays at 91.4%, Sundays at 86.1% and Mondays at 86.1%, against 79.5% on Wednesdays and 78.2% on Thursdays — a 13.2pt gap between Saturday and Thursday. Resort hotels (N=25–29 properties) show the same shape: a monthly average of 84.1%, Saturdays at 93.1% and Wednesdays at 78.6%. Foliage-season weekends start from a high position, while Tuesday-to-Thursday inventory tends to remain; that September pattern is a yardstick for deciding where extended stays can be absorbed in November.
Price levels are not the subject of this article, but for reference, the estimated transacted ADR (tax-exclusive equivalent, final) of Tochigi city hotels (N=14 properties) was ¥7,700 in October 2025 and ¥8,800 in November 2025; last year November was higher than October. The current estimate for October 2026 is ¥11,100 (N=15 properties), but this is an estimate based on sales conditions to date, and a straightforward comparison with final figures has to wait until the month closes.
For Revenue Managers Running Ryokan and Resort Hotels in Tochigi — Implications and Action Plan
Insights from an operator’s perspective
1. Overlay your own curve on the market’s three points. Peak-foliage Saturdays have tracked within bands of 69–74% at 45 days out, 75–80% at 30 days out and 85–88% at the latest reading. Checking where your own pace for the date sits within these bands at 45, 30 and 14 days out lets you tell whether your unsold rooms are simply in line with the market or have been left behind. Above the band, there is no need to cut rates; below it, break the cause down into how inventory is being released versus how plans are being presented.
2. Sundays fill after the 30-day mark. The Sundays of October 18 and 25 sat below Saturday through 30 days out, then added 6–9pt after the 30-day mark and 13–14pt from 45 days out. There is no need to be pessimistic about Sunday inventory at 45 days out; there is room to have the setup in place by 30 days out to take those rooms as extended stays from Saturday or as Sunday–Monday multi-night stays.
3. T-30 means something different for each property type. Resort hotels add 9–11pt between 45 and 30 days out and then slow, while ryokan add 6–10pt after the 30-day mark. For a resort-type property, a 30-day pace short of the market figure calls for early action; for a ryokan-type property, the natural reading is that rooms unsold at 30 days out still have room to fill.
4. The November three-day weekend is already at October-peak levels. Saturday, November 21 stood at 86.2% with a sold-out property share of 43.4% at 45 days out, level with where October 24 stood at 17 days out. For this date, the sensible course is to finish releasing all inventory and lock in the final rate tier this week, at T-45, and direct the remaining selling capacity toward Sunday the 22nd and the weekdays.
Action plan (T-45 / T-30 / T-14) — The plan below is organized on a timeline aimed at November weekends, in particular November 7–8 (31–32 days out as of the latest reading), 14–15 (38–39 days out) and 21–23 (45–47 days out). October stay dates are already at T-14 or later, so they are best used as reference values for comparison.
| Timing | Action | Decision trigger (figures from this article) | Objective |
|---|---|---|---|
| T-45 (45 days before the stay date; this week for the November 21–23 three-day weekend) | Release all inventory and lock in the final rate tier. Take stock of room types and room counts not yet offered on OTAs and similar channels, and align the allotments on sale | If your own pace for the date is below the market level at 45 days out (78.7–86.2% for ryokan on November Saturdays, 69.9–70.9% on Sundays) | Build a market-level position at 45 days out and capture, for your own property, the gain from 45 to 30 days out (for ryokan on October 17–25: +5.6 to 6.1pt on Saturdays, +4.0 to 8.2pt on Sundays) |
| T-45 | Separate the sales design for Saturday and Sunday. Hold the top rate tier on Saturday; for Sunday, put second-night combinations (Saturday–Sunday, Sunday–Monday) up front | Given that the market’s sold-out property share at 45 days out differs by more than a factor of two between Saturdays (23.4–43.4%) and Sundays (9.0–18.6%) for stay dates from October 24 onward, if your own Sunday pace lags far behind Saturday | Direct Sunday inventory toward extended stays from Saturday and Sunday–Monday multi-night stays, leveling occupancy across the weekend |
| T-30 (30 days out) | Swap the plans on unsold rooms. Rework the mix of room-only and half-board (dinner and breakfast) plans and the exposure of each room type to match the type of inventory that remains | If your own pace at 30 days out falls short of the ryokan market figure (80.0% for October 24, 75.0% for October 17) | Capture in full the +7.7 to 10.0pt the market added from 30 days out to the latest reading. If you are at the market figure, avoid easy rate cuts and respond by reworking plan exposure |
| T-30 | Because resort hotels build more by 30 days out than ryokan (+11.2pt for October 24), even with many rooms unsold at 30 days out, change how each room type is presented before cutting rates | If your own pace at 30 days out is below the market figure for resorts (83.2% for October 24) | Take the demand that concentrates after the 30-day mark without breaking the rate tier |
| T-14 (14 days out) | Last-minute promotion and extended-stay offers. For rooms unsold at 14 days out, propose an extra night after or before the stay on the weekday side (Tuesday to Thursday in the foliage season) | If your own pace at 14 days out is below the market figure (ryokan: 82.9% for October 17, 79.0% for October 18) | Channel demand toward weekdays, where September results show a gap (Saturday 91.4% versus Wednesday 79.5% and Thursday 78.2%), and sell out the remaining weekend rooms at the final rate tier |
| T-14 to arrival | Anticipate the late build ahead of arrival (October 10 rose +6.7pt, from 89.6% at 14 days out to 96.3% at 3 days out) and hold back any reduction of the final rate tier until the last moment | If your own pace at 14 days out is at or above the market | Take last-minute demand at the final rate tier and avoid eroding ADR through rate cuts |
Source: MetroEngines Research; compiled by the HotelBank Editorial Team
Summary — Three Yardsticks for Tochigi in the Foliage Season
The first is the three points at 45 days out, 30 days out and the latest reading. For ryokan, the peak-foliage Saturday has run 74.4% → 80.0% → 87.7% (October 24) and the Sunday 68.9% → 77.1% → 83.3% (October 25); overlaying your own curve on these three points is the starting point. The second is the shape of the build around 30 days out. Resort hotels add 9–11pt between 45 and 30 days out, while ryokan add 6–10pt after the 30-day mark. Which shape your property is closer to changes what to do at T-30. The third is the Saturday–Sunday gap and the capacity of weekdays to absorb demand. September results show Saturdays at 91.4% against Thursdays at 78.2%, and November weekends have a Saturday–Sunday gap of 8–10pt at 45 days out; across the market there is still room to channel demand toward weekdays through an extra night after or before the stay. With November 21 already almost level at 45 days out with the 87.7% that October 24 reached at 17 days out, preparation for November should be seen as starting this week rather than as something still ahead.
About the Data in This Article
| Estimated OCC (OTA-listed inventory basis) | OTA-listed inventory-based occupancy = 100 − 100 × rooms remaining on OTA listings ÷ total rooms. The cohort is fixed and made up of properties that list at least 30% of their total rooms on OTAs (the same set of properties for each stay date; property counts are given as N= in the text). It is an estimate based on how much of the inventory sold on OTAs has been taken up, and its definition differs from actual room occupancy (it runs higher because rooms not listed are counted as taken). The periods covered here are September 2026 (results for an elapsed month) and individual stay dates in October–November 2026 (on-the-books snapshots). |
| Booking curve | Based on readings from 45 days before the stay date through the latest date. The fixed points are 45 days out, 30 days out, 14 days out and the latest reading (October 7, 2026). The sold-out property share is the share of properties for which no listed inventory can be found on OTAs and similar channels (estimate). |
| Estimated transacted ADR | The transacted price level (tax-exclusive equivalent) estimated from sales data on OTAs and similar channels (lowest-plan level × a coefficient by property type; an ensemble across multiple channels). Past months are final; the current and future months are estimates based on sales conditions to date. The median error against published operating results is 6.6%. This article cites it only as a reference value for Tochigi city hotels. |
| Coverage (N) | Tochigi ryokan: 145–146 properties / 5,597–5,677 rooms depending on the stay date (117–150 properties for September results). Tochigi resort hotels: 28 properties / 1,761 rooms (25–29 properties for September results). Tochigi city hotels (reference value for estimated transacted ADR): 14–15 properties. |
| Data as of | October 8, 2026. Sales conditions and inventory change daily, so the figures in this article are a snapshot at the time of retrieval. |
References and Sources
■ Data sources
Aggregated data from MetroEngines Research (daily readings of inventory listed on major booking sites). For fixed cohorts of 145–146 ryokan and 28 resort hotels in Tochigi Prefecture, the trend for each stay date was compiled from 45 days out through October 7, 2026. Foliage viewing periods are taken from the public information in the table below.
■ Assumptions
This article makes no projections of future values and deals only with comparisons of fixed points already observed (45 days out, 30 days out, 14 days out and the latest reading). Gains (pt) are the difference between fixed points for the same stay date. The lead time of the latest reading differs by stay date (3–45 days out), so when comparing latest readings across stay dates, please also refer to the number of days shown in the tables.
■ Limitations and caveats
Estimated OCC is an estimate based on how much listed inventory has been taken up, and its definition differs from actual room occupancy. The resort hotel cohort is small at 28 properties, and a change at a single property moves the sold-out property share by 3.6pt. November 21 has only its single first reading, so no trend has been confirmed. The figures are prefecture-wide aggregates and do not reflect differences between areas such as Nikko, Nasu and Kinugawa, or the situation of individual properties.
| Autumn foliage at Irohazaka (Nikko): best viewing period | koyo.walkerplus.com |
| Autumn foliage in Nikko (Ryuzu Falls): best viewing period | koyo.walkerplus.com |
| Autumn foliage information for Irohazaka (Weathernews) | weathernews.jp |