

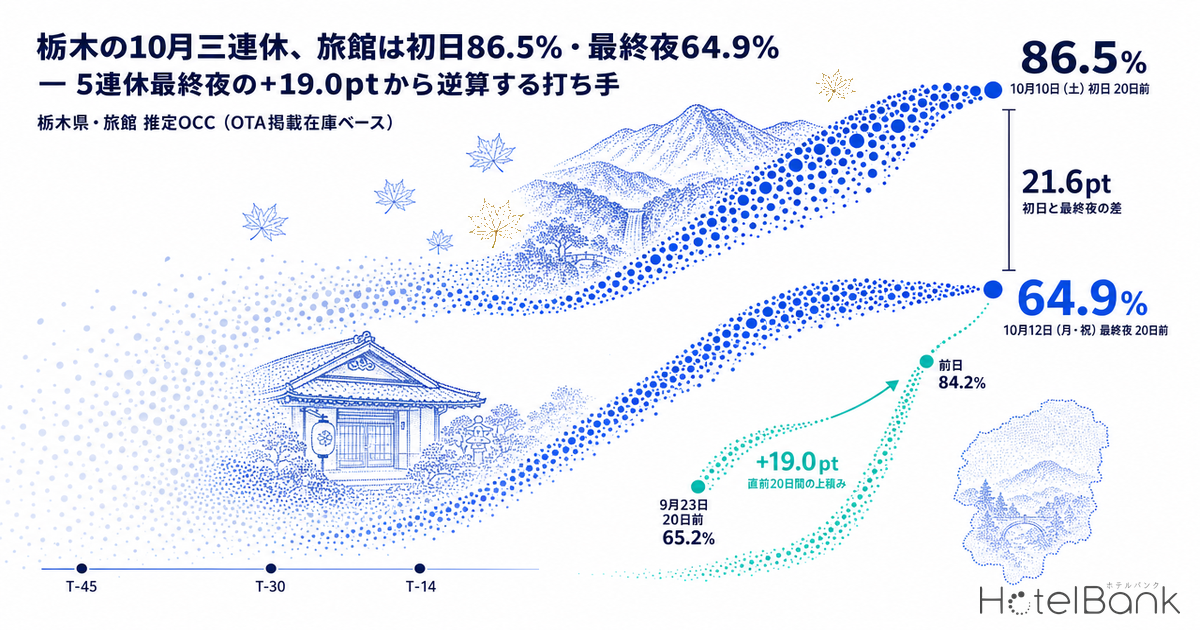
Within the same October three-day weekend in Tochigi Prefecture (October 10–12), booking progress has split sharply between the first night and the last night. Compared at 20 days before the stay date, estimated OCC (based on OTA-listed inventory) for ryokan (N=149–150 properties) stands at 86.5% for Saturday, October 10 and 64.9% for Monday, October 12 (a national holiday) — a gap of 21.6pt. For business hotels (N=65 properties) the figures are 80.8% and 44.8%, a 36.0pt gap. Resort hotels (N=28 properties), by contrast, narrowed a 21.5pt gap at T-45 to just 7.9pt at T-20: the same final night fills in very different ways depending on property type.
The Silver Week that has just ended (the five-day holiday of September 19–23) offers a useful reference. On the night of Wednesday, September 23 (a holiday followed by a weekday), ryokan were at 65.2% at T-20 and reached 84.2% the day before, adding +19.0pt in the final 20 days. At T-20, the October 12 ryokan figure of 64.9% sits in almost exactly the same place. This article lays out the booking curves for three property types, checks when final-night pickup happens, and organizes actions in three stages: T-45 (promoting 3-night and 2-night plans), T-30 (packaging a single final-night stay) and T-14 (how to present the remaining inventory).
Scope: Tochigi Prefecture ryokan N=148–150 properties (5,751–5,849 rooms), resort hotels N=28 properties (1,783 rooms), business hotels N=65 properties (5,629 rooms). Price metrics in this article are estimated settled ADR (the settled price level estimated from OTA and other sales data, tax-exclusive equivalent); occupancy is an estimate based on OTA-listed inventory. Definitions are at the end of the article. Data as of: September 23, 2026.
• ADR (estimated settled ADR) = an estimated settled room rate (tax-exclusive equivalent), calculated by applying property-type correction factors to the lowest-plan rate each property publishes on OTAs (per room, 2 guests per room, tax-inclusive). Checked against published operating results, the median error is 6.6%. This is an estimate and differs from each property’s actual settled prices and accounting figures.
• OCC (occupancy) = rooms sold as a share of total rooms in the area (an estimate based on OTA sales inventory). The formula and cohort are described in “About the Data” at the end of the article.
• Source: MetroEngines Research (continuously tracks OTA published prices for approximately 168,000 properties, of which approximately 27,000 are confirmed operating)
- — First-night vs final-night gap at T-20: 21.6pt for ryokan, 36.0pt for business hotels: ryokan are at 86.5% for the Oct 10 night vs 64.9% for Oct 12; business hotels at 80.8% vs 44.8% (estimates, based on OTA-listed inventory).
- — The final night is not growing more slowly — it simply starts lower: the ryokan Oct 12 night gained +9.4pt from T-45 to T-20, about the same as the first night (+7.7pt). The gap of roughly 23pt was already there at T-45.
- — Resort hotels narrowed the gap from 21.5pt to 7.9pt: their Oct 12 night went from 55.0% at T-45 to 67.9% at T-30, +12.9pt in 15 days. With only 28 properties the sample is small, but it shows the final-night gap can be closed through how rooms are sold.
- — The final night of the September five-day holiday gained +16.0pt in the last two weeks: ryokan on the Sep 23 night went from 68.2% at T-14 to 84.2% the day before — more than the preceding 31 days (+14.7pt), with +11.9pt in the final week alone. Even so, it finished 14.9pt short of the mid-holiday Sep 21 night.
- — Set prices on a two-night average: ryokan estimated settled ADR for August 2026 (final) was −7.4% YoY. To avoid offsetting a strong first-night rate by discounting the final night, judge pricing on the average rate of the first night plus the final night.
Line up the three nights of the October weekend and the final night follows a different curve
Start with the ryokan booking curves. The night of Saturday, October 10 stood at 78.8% estimated OCC at T-45 (October 10, 2026 stay date, T-45 snapshot, N=149 properties), 84.2% at T-30, and 88.8% at the latest reading, T-18. The night of Sunday, October 11 went 73.4% → 77.1% → 81.2% (T-19). Both were above 70% at T-45, so the first and second nights of the weekend have been running at high levels from early on.
The night of Monday, October 12 (holiday), by contrast, was 55.5% at T-45, 61.2% at T-30, and only 64.9% at the latest reading, T-20. Its pickup from T-45 to T-20 was +9.4pt, not much different from the +7.7pt for October 10 over the same window. In other words, the final night is not growing more slowly; it is moving in parallel while starting about 23pt lower. Because the following day, Tuesday the 13th, is a weekday, it is less likely to be chosen as the last night of a multi-night stay — a pattern typical of a holiday weekend’s final night. The same structure, in which a final night followed by a weekday stays below the mid-holiday nights, also appeared in Mie Prefecture during the September five-day holiday.
For a like-for-like final-night comparison, the chart below also overlays the ryokan curve for the final night of Silver Week (Wednesday, September 23, a holiday, with the 24th a weekday). At T-20, the October 12 curve nearly overlaps September 23 (65.2%).
Source: MetroEngines Research; compiled by HotelBank Editorial Team (Tochigi Prefecture, ryokan, N=147–150 properties. The horizontal axis is days remaining until the stay date. October stay dates are observed through September 22, 2026)
The next table lines up four points — T-45, T-30, T-20 and the latest reading — by property type. The sold-out property share is the (estimated) share of properties with no OTA-listed inventory visible.
| Type / stay date | N (properties/rooms) | T-45 | T-30 | T-20 | Latest | Sold-out share (latest) |
|---|---|---|---|---|---|---|
| Ryokan Oct 10 (Sat) | 149/5,763 | 78.8% | 84.2% | 86.5% | 88.8% (T-18) | 51.7% |
| Ryokan Oct 11 (Sun) | 148/5,751 | 73.4% | 77.1% | 81.3% | 81.2% (T-19) | 32.4% |
| Ryokan Oct 12 (Mon, holiday) | 150/5,849 | 55.5% | 61.2% | 64.9% | 64.9% (T-20) | 11.3% |
| Resort Oct 10 (Sat) | 28/1,783 | 76.5% | 82.1% | 82.2% | 84.1% (T-18) | 28.6% |
| Resort Oct 11 (Sun) | 28/1,783 | 70.3% | 74.9% | 76.8% | 77.5% (T-19) | 17.9% |
| Resort Oct 12 (Mon, holiday) | 28/1,783 | 55.0% | 67.9% | 74.3% | 74.3% (T-20) | 10.7% |
| Business Oct 10 (Sat) | 65/5,629 | 69.9% | 74.7% | 80.8% | 82.3% (T-18) | 29.2% |
| Business Oct 11 (Sun) | 65/5,629 | 47.3% | 52.2% | 56.5% | 56.8% (T-19) | 3.1% |
| Business Oct 12 (Mon, holiday) | 65/5,629 | 36.5% | 40.4% | 44.8% | 44.8% (T-20) | 1.5% |
Source: MetroEngines Research; compiled by HotelBank Editorial Team (estimated OCC = based on OTA-listed inventory. Latest = observed September 22, 2026)
Among ryokan, the sold-out property share reached 51.7% on the first night, October 10, meaning fewer than half of properties still show listed inventory. The October 12 sold-out share, however, is 11.3%, barely changed from T-45 (10.1%). The October 12 night is filling not through more properties selling out, but through rooms being taken a few at a time across many properties.
For reference, ryokan for Saturday, October 17 — the weekend after the holiday — were at 78.0% at T-25. At the same T-25 point, October 12 (63.9%) was about 14pt below an ordinary Saturday. Even in autumn-foliage season, the night of a holiday followed by a weekday cannot on its own stand in for a Saturday night.
How the gap with the final night narrows differs by type — resorts closed to 7.9pt
We compared the first-night/final-night gap by property type at two points, T-45 and T-20. For ryokan it barely narrowed, from 23.3pt to 21.6pt; for business hotels it actually widened, from 33.4pt to 36.0pt. The business-hotel October 10 night grew as tourist and travel demand overlapped, but the October 12 night was still only 44.8% at T-20, with pickup since T-45 of just +8.3pt.
Resort hotels are the contrast. Their October 12 night went from 55.0% at T-45 to 67.9% at T-30, +12.9pt in those 15 days, and reached 74.3% at T-20. Over the same period October 10 rose +5.6pt (76.5% → 82.1%) and then flattened at 82.2%. As a result, the gap narrowed from 21.5pt to 7.9pt. With only 28 properties the result cannot be generalized, but it is possible that bookings for “two nights including the final night of the weekend” came in as a block in the period up to T-30. The data can be read as showing that an unfilled final night is not a structural inevitability, but a gap that can be narrowed through how rooms are sold.
Source: MetroEngines Research; compiled by HotelBank Editorial Team (Oct 10 estimated OCC − Oct 12 estimated OCC. Ryokan N=149–150, resort N=28, business N=65 properties)
What happened on the Silver Week final night — +12.7 to +17.0pt in the last two weeks
A useful reference for how October 12 may develop is the final night of the September five-day holiday (Wednesday, September 23, a holiday). The following day, Thursday the 24th, was a weekday — the same condition as October 12. Set against the mid-holiday night of Monday, September 21 (a holiday), the curves look like this.
| Type / stay date | N (properties/rooms) | T-45 | T-30 | T-20 | T-14 | T-7 | Day before |
|---|---|---|---|---|---|---|---|
| Ryokan Sep 21 (Mon, holiday) | 147/5,701 | 84.0% | 90.9% | 98.7% | 99.6% | 99.7% | 99.1% |
| Ryokan Sep 23 (Wed, holiday) | 149/5,825 | 53.5% | 58.2% | 65.2% | 68.2% | 72.3% | 84.2% |
| Resort Sep 21 (Mon, holiday) | 26/1,743 | 87.1% | 94.1% | 98.3% | 99.4% | 99.9% | 98.6% |
| Resort Sep 23 (Wed, holiday) | 28/1,783 | 52.0% | 61.3% | 66.8% | 72.5% | 75.5% | 85.2% |
| Business Sep 21 (Mon, holiday) | 62/5,281 | 51.3% | 61.4% | 77.0% | 85.8% | 92.9% | 88.2% |
| Business Sep 23 (Wed, holiday) | 65/5,629 | 35.1% | 37.2% | 41.5% | 43.3% | 49.0% | 60.3% |
Source: MetroEngines Research; compiled by HotelBank Editorial Team (estimated OCC = based on OTA-listed inventory)
Final-night pickup has a clear signature. Ryokan on September 23 gained +14.7pt over the 31 days from T-45 to T-14, but +16.0pt over the 13 days from T-14 to the day before — a larger gain in less than half the time. Business hotels went from 43.3% at T-14 to 60.3% the day before (+17.0pt), and resorts from 72.5% to 85.2% (+12.7pt). Final-night bookings concentrate in the last two weeks, and especially in the final week. Ryokan added +11.9pt from T-7 to the day before alone.
Even so, the gap with the mid-holiday September 21 night remained right up to the end. On the day before, the gap was 14.9pt for ryokan, 27.9pt for business hotels and 13.4pt for resorts. A five-day holiday offers more scheduling flexibility than a three-day weekend, so conditions are not identical, but the pattern of “the final night picks up late but does not catch the mid-holiday nights” is a useful yardstick for October 12. At T-20, October 12 ryokan are at 64.9%, almost exactly where September 23 was at the same point (65.2%). With the last two weeks now beginning, how the remaining inventory is presented and where prices are set will determine the outcome.
Checking price levels — October estimated settled ADR up +6.2% for ryokan, final month vs final month
For pricing, we check levels using monthly estimated settled ADR. Because estimated settled ADR is a metric handled only on a monthly basis, prices for individual days of the three-day weekend are not covered here. Last October (final), ryokan were at ¥17,300 (N=203 properties), +6.2% versus the same month a year earlier (October 2024, ¥16,300). Resort hotels were at ¥17,000 (N=39), −2.4%, and business hotels at ¥6,900 (N=137), +4.0%. Differences in rate levels between municipalities within the prefecture are examined in depth in Tochigi Hotel ADR: 3.6x City Gap.
| Type | Oct 2024 (final) | Oct 2025 (final) | YoY | Aug 2025 (final) | Aug 2026 (final) | YoY |
|---|---|---|---|---|---|---|
| Ryokan | ¥16,283 (N=219) | ¥17,297 (N=203) | +6.2% | ¥19,554 (N=205) | ¥18,107 (N=211) | −7.4% |
| Resort hotels | ¥17,415 (N=36) | ¥16,992 (N=39) | −2.4% | ¥27,281 (N=38) | ¥24,884 (N=45) | −8.8% |
| Business hotels | ¥6,622 (N=131) | ¥6,884 (N=137) | +4.0% | ¥6,758 (N=137) | ¥6,905 (N=138) | +2.2% |
Source: MetroEngines Research; compiled by HotelBank Editorial Team (estimated settled ADR, tax-exclusive equivalent. Tochigi Prefecture)
In August 2026, the most recent final month, ryokan were −7.4% YoY and resorts −8.8%, below the prior year even in the summer peak month. This October is currently estimated at ¥18,700 for ryokan (N=203) and ¥17,100 for resorts (N=44) (both are estimates based on current sales and may change; a straightforward comparison with last October’s final figures should wait until the month closes).
Overlaying ryokan estimated settled ADR year by year, October sits between the August peak and the November–December peak. In 2025, October’s ¥17,300 was followed by a rise to ¥19,500 in November and ¥19,800 in December. Because the peak of the autumn-foliage season shifts into late October and November, the early-October three-day weekend can be positioned as days that lift the level of the month as a whole.
Source: MetroEngines Research; compiled by HotelBank Editorial Team (Tochigi Prefecture, ryokan estimated settled ADR, tax-exclusive equivalent. N=178–225 properties. September 2026 onward are estimates based on current sales and may change)
It is also worth checking the foliage calendar. According to Nikko City’s official tourism site, Nikko Tabi Navi, the usual peak viewing periods are mid-October to early November for Lake Chuzenji, Kegon Falls and the Irohazaka road; mid- to late October for the trees of Senjogahara and Odashirogahara; early to mid-October for Lake Yunoko, Yudaki Falls and Ryuzu Falls; and late October to early November around the Kinugawa Onsen Ropeway. Mt. Chausu in Nasu is usually at its best from late September to late October. October 10–12 falls in the period when colors are advancing in the mountains of Oku-Nikko and Nasu, with the peaks at Lake Chuzenji, Irohazaka and Kinugawa following later. Guests traveling specifically for the foliage may in fact be more numerous from the week after the three-day weekend onward.
For revenue managers running ryokan, resort and business hotels in Tochigi — implications and action plan
(a) Key points from an operator’s perspective
1. Track your own first-night vs final-night gap every day. Across the market, the ryokan gap between October 10 and October 12 is still 21.6pt at T-20. If your property’s gap is larger, the likely cause is that the final night is not built into your multi-night plans. If it is smaller, you have probably already captured multi-night bookings. The size of the gap is a better guide to choosing actions than the occupancy level itself.
2. Final-night bookings arrive in the last two weeks. Ryokan on the Silver Week final night gained +16.0pt over the 13 days from T-14 to the day before, more than the preceding 31 days (+14.7pt). A final night in the 60% range at T-20 is not, by itself, a reason to cut prices. It is not too late to revisit pricing after seeing how pickup develops over the last two weeks.
3. The resort hotels’ narrowing gap is evidence that there are levers to pull. Resort hotels (28 properties) saw the October 12 night gain +12.9pt in the 15 days up to T-30, narrowing the gap with the first night to 7.9pt. Designing 2- and 3-night products that lock in the final night is worth trying at ryokan and business hotels as well.
4. Work backward from the monthly price level. Estimated settled ADR for August 2026 was −7.4% YoY for ryokan, below the prior year even in a peak month. This October’s ryokan estimate is ¥18,700, but it is not yet final. Even if you set an aggressive rate for the first night of the weekend, discounting the final night will offset it over the month. The approach that fits is to look at the average rate on a two-night basis, combining the first and final nights.
(b) Action plan — The October 12 night is already just ahead of its last two weeks (T-19). For this weekend, the actions are “this week through the final days”; for the next three-day weekend (November 21–23, with the 23rd a Monday holiday), work backward from T-45 (October 9) and T-30 (October 24).
| Timing | Action | Trigger (figures from this article) | Aim |
|---|---|---|---|
| This week (T-19 to T-14 for Oct 12) | Put the Oct 11–12 two-night plan up front so two nights look easier to choose than a single Oct 10 night | If your gap between Oct 10 and Oct 12 is larger than the market’s 21.6pt for ryokan or 36.0pt for business hotels | Carry first-night demand through to the final night |
| This week | Add benefits to the Oct 12 single night, such as late checkout or a bundle with sightseeing the next morning | If your Oct 12 is below the market’s ryokan 64.9% (T-20) | Offset the weekday-next-day disadvantage with experience value |
| T-14 to the final days | Present the remaining final-night inventory through “only a few left” messaging and narrowing room types before cutting prices | Ryokan on Sep 23 gained +16.0pt from T-14 to the day before. Check daily whether your pickup is close to this pace | Capture late bookings without lowering rates |
| T-7 to the day before | Revisit prices in small steps only after confirming pickup in the final week | Ryokan on Sep 23 gained +11.9pt from T-7 to the day before. Consider only if pickup stalls in this window | Avoid selling late demand cheaply through premature discounts |
| Next three-day weekend T-45 (around Oct 9) | Release 3-night and 2-night (22nd–23rd) plans for Nov 21–23 early, selling the final night as part of a multi-night stay | This time, at T-45 the final night was 23.3pt (ryokan) and 33.4pt (business) below the first night | Make the starting-point gap smaller from the outset |
| Next three-day weekend T-30 (around Oct 24) | Launch a single final-night product (with benefits matched to next-day plans) and review how the two-night plan is progressing | Resorts narrowed the gap with +12.9pt on the final night in the 15 days from T-45 to T-30. If your final-night pickup is slower than this | Avoid over-reliance on the last two weeks |
All of these are guidelines for judging by comparing your own booking pace with the market curve. Effects will vary with each property’s location, room mix and guest profile.
Summary — three yardsticks for reading a holiday weekend’s final night
| Yardstick | Tochigi values this time | How to use it |
|---|---|---|
| 1. First-night vs final-night gap | At T-20: ryokan 21.6pt, resorts 7.9pt, business 36.0pt | Compare with your own gap to see whether the cause lies in how multi-night stays are sold |
| 2. Pickup in the last two weeks | Sep 23 final night, T-14 to the day before: ryokan +16.0pt, business +17.0pt, resorts +12.7pt | Do not decide on discounts based only on a low figure at T-20 |
| 3. Monthly level | Ryokan estimated settled ADR: October 2025 (final) ¥17,297; August 2026 (final) −7.4% YoY | Build prices on the two-night average of the first and final nights |
The final night of a three-day weekend starts more than 20% below the first night as early as T-45, picks up in the last two weeks, but does not catch the mid-holiday nights. That was the pattern shared by Tochigi’s ryokan and business hotels this time and by the September five-day holiday. Resort hotels, on the other hand, had narrowed the gap to 7.9pt by T-30. The final-night gap is best seen not as a fixed fate, but as room that can be narrowed through how rooms are sold.
Frequently Asked Questions
Q. What is estimated OCC? Is it the same as actual room occupancy?
Estimated OCC is an estimate based on OTA-listed inventory, calculated as “100 − 100 × OTA-listed rooms remaining ÷ total rooms”. A fixed cohort is built from properties that list at least 30% of their total rooms on OTAs, and the same set of properties is tracked for each stay date. Because rooms not listed are counted as sold, it runs higher than actual room occupancy.
Q. The final night of the holiday weekend (the Oct 12 night) is in the 60% range at T-20. Should we cut prices now?
Tochigi ryokan for the October 12 night are at 64.9% at T-20, almost exactly where the final night of the September five-day holiday (the September 23 night) was at the same point (65.2%). The September 23 night then gained +16.0pt over the 13 days from T-14 to the day before, including +11.9pt in the final week alone. Because final-night bookings concentrate at the end, it is better not to decide on discounts based only on a low T-20 figure, and instead to review prices in small steps after seeing how pickup develops over the last two weeks.
Q. Why is only the final night of a holiday weekend hard to fill?
Because the next day is a weekday, it is less likely to be chosen as the last night of a multi-night stay. Ryokan for the October 12 night were about 23pt below the first night at T-45, and their subsequent pickup (+9.4pt from T-45 to T-20) was not much different from the first night’s (+7.7pt). The sold-out property share has also barely moved, from 10.1% at T-45 to 11.3% at the latest reading: rooms are being taken a few at a time across many properties rather than more properties selling out.
Q. Why did only resort hotels narrow the gap with the first night?
Resort hotels’ October 12 night rose from 55.0% at T-45 to 67.9% at T-30, +12.9pt in 15 days, narrowing the gap with the first night from 21.5pt to 7.9pt. With only 28 properties the result cannot be generalized, but bookings for two nights including the final night may have come in as a block by T-30. Designing 2- and 3-night products that lock in the final night is worth trying at ryokan and business hotels as well.
Q. Is this October’s price level higher than last year?
Estimated settled ADR for October 2026 is currently estimated at ¥18,700 for ryokan (N=203 properties) and ¥17,100 for resort hotels (N=44 properties). A comparison with last October’s final figures (ryokan ¥17,300, resort hotels ¥17,000) needs to wait until the month closes. In August 2026, the most recent final month, ryokan were −7.4% YoY and resort hotels −8.8%. These are all monthly figures, not prices for the three days of the weekend alone.
About the Data
| Estimated OCC definition | Occupancy based on OTA-listed inventory = 100 − 100 × OTA-listed rooms remaining ÷ total rooms. Covers a fixed cohort of properties that list at least 30% of total rooms on OTAs (the same set of properties for each stay date; N in the text is the number of properties). This is an estimate based on how inventory sold on OTAs is being absorbed and is defined differently from actual room occupancy (it runs higher because unlisted rooms are counted as sold). |
| Booking curve | Based on observations from T-45 to the latest reading. October stay dates are observed through September 22, 2026 (latest readings: T-18 for Oct 10, T-19 for Oct 11, T-20 for Oct 12). |
| Estimated settled ADR definition | The settled price level (tax-exclusive equivalent) estimated from OTA and other sales data (lowest-plan rate × property-type factor, ensemble of multiple channels). Past months are final values; current and future months are estimates based on current sales. Checked against published operating results, the median error is 6.6%. |
| Breakdown of N | Tochigi Prefecture. Estimated OCC: ryokan N=147–150 properties (5,701–5,849 rooms), resort hotels N=26–28 properties (1,743–1,783 rooms), business hotels N=62–65 properties (5,281–5,629 rooms). N for each stay date is shown in the tables. Estimated settled ADR: ryokan N=178–225 properties (all months in the chart), resort hotels N=36–45 properties, business hotels N=131–138 properties (each month in the table; varies by month). |
| Data as of | Data as of: September 23, 2026. Because sales and inventory change daily, the figures in this article are a snapshot at the time of retrieval. |
References and Sources
■ Data sources
Daily observations of OTA-listed inventory and prices collected by MetroEngines Research (Tochigi Prefecture; stay dates September 21 and 23 and October 10, 11, 12 and 17, 2026; observations from T-45 for each stay date through September 22, 2026), and monthly estimated settled ADR by property type for Tochigi Prefecture based on the same data (January 2024 to February 2027). National holidays are from the Cabinet Office; foliage peak periods are from information published by Nikko City’s official tourism site and tenki.jp.
■ Calculation assumptions
Estimated OCC = 100 − 100 × OTA-listed rooms remaining ÷ total rooms. A fixed cohort is built from properties listing at least 30% of total rooms on OTAs, and the same set of properties is tracked for each stay date. City hotels, whose fixed cohort has fewer than 10 properties (9 in Tochigi Prefecture), were excluded from the comparison. The sold-out property share is the share of properties with no OTA-listed inventory visible. Estimated settled ADR is a tax-exclusive-equivalent estimate based on lowest-plan rate × property-type factor; past months are final values, and September 2026 onward are estimates based on current sales.
■ Limitations and caveats
Estimated OCC is based on OTA-listed inventory and runs higher than actual room occupancy because unlisted rooms are counted as sold. Dips along the way can also result from cancellations or added allotments and do not necessarily indicate weaker demand. The comparison with the September five-day holiday is a reference comparison across holidays of different length and timing and does not indicate the final outcome for the October 12 night. Resort hotels number only 28 properties, so the narrowing of their gap cannot be generalized. Estimated settled ADR for October 2026 may change until the month closes, and as a monthly figure it is not the price for the three days of the weekend alone.
| Nikko City official tourism site, Nikko Tabi Navi, “Autumn Leaves Status – Flowering Information” | https://www.nikko-kankou.org/flowering/autumn-leaves |
| tenki.jp, “Nasu Highlands Mt. Chausu: autumn foliage peak and weather information” | https://tenki.jp/kouyou/3/12/34451.html |
| Cabinet Office, “About National Holidays” | https://www8.cao.go.jp/chosei/shukujitsu/gaiyou.html |