

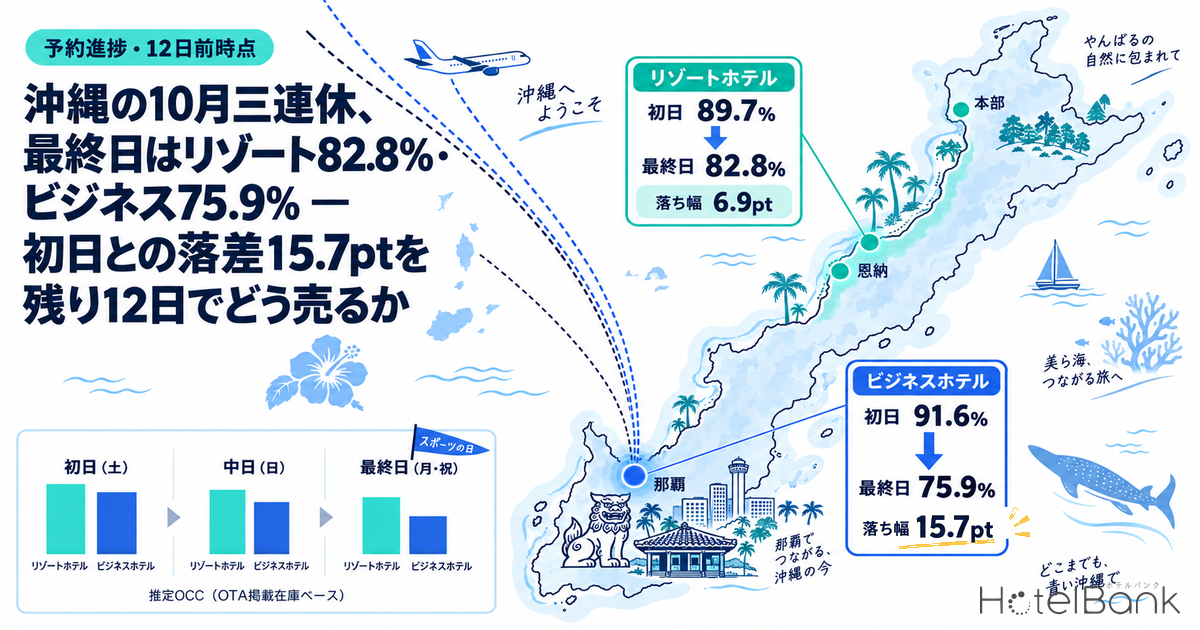
For Okinawa’s October three-day weekend (Sat, Oct 10 through Mon, Oct 12, a public holiday), we tallied booking progress by segment as of 12 days before each stay date. Estimated OCC (OTA listed-inventory basis) for the final night, Oct 12, stood at 82.8% for resort hotels (N=196 properties / 16,608 rooms) and 75.9% for business hotels (N=140 properties / 12,924 rooms). On the first night, Oct 10, resorts were at 89.7% against 91.6% for business hotels, so business hotels are the ones running short of inventory first. Put differently, the drop from the first night to the final night is 6.9pt for resorts but 15.7pt for business hotels, more than double, and that gap has barely moved since 45 days out (7.4pt and 15.2pt). This article confirms this segment-specific shape at the 45-day, 30-day and last-minute checkpoints, uses the final landing of the September holiday run as a yardstick, and considers how to sell final-night inventory over the remaining 12 days.
Scope: Okinawa resort hotels (N=196 properties / 16,608 rooms) and business hotels (N=140 properties / 12,924 rooms), based on listings on major booking sites. Occupancy is an estimate based on OTA listed inventory; see the definitions at the end of the article. This article covers booking progress only and does not cover price metrics. Data as of October 1, 2026.
• OCC (occupancy) = rooms sold as a share of total rooms in the area (an estimate based on inventory sold through OTAs). This article uses a fixed cohort of properties that list at least 30% of their total rooms on OTAs.
• Sold-out property rate = share of properties with no listed inventory found on OTAs and similar channels (estimate).
• This article covers booking progress only and contains no price metrics. See “About the Data” at the end of the article for full definitions. Source: MetroEngines Research
- — Final night Oct 12: Resort 82.8%, Business 75.9% (estimated OCC, OTA listed-inventory basis, 12 days out). The drop from the first night, Oct 10, is 6.9pt for resorts and 15.7pt for business hotels, with 2,852 and 3,118 listed rooms still unsold, respectively.
- — The gap is set by 45 days out — the first-to-final-night drop moved by less than 1pt in both segments between 45 days out (7.4pt and 15.2pt) and 12 days out. Only the segment gap on the final night narrowed (13.9pt → 6.9pt).
- — Pickup in the last 12 days does not favor any night — over the September holiday run, business hotels added +6.9 to +7.7pt on all five nights, and the final night, Sep 23, landed at 77.9%. The final night is something to sell together with first- and middle-night bookings, not something to wait on.
Where the October Three-Day Weekend Stands — Business Leads on Night One, Resorts Hold Up on the Final Night
We start by lining up the three nights at the same checkpoints. Monday, October 12, 2026 is Sports Day, making a three-day weekend from Saturday, Oct 10 (Cabinet Office, “National Holidays”). Because the number of days remaining differs by stay date, we take “12 days out,” the latest point observed for all three nights, as the most recent checkpoint and show it in Table 1 alongside 45, 30 and 14 days out (T-45, T-30, T-14).
Table 1 | Okinawa: Estimated OCC (OTA Listed-Inventory Basis) for the October Three-Day Weekend — T-45, T-30, T-14 and T-12 Checkpoints and Sold-Out Property Rate
| Stay date | Segment | T-45 | T-30 | T-14 | T-12 | T-45 → T-12 | Sold-out property rate (T-12) |
|---|---|---|---|---|---|---|---|
| Oct 10 (Sat) | Resort | 82.4% | 86.3% | 89.7% | 89.7% | +7.3pt | 28.6% |
| Oct 11 (Sun) | Resort | 78.6% | 82.3% | 85.3% | 85.7% | +7.1pt | 16.3% |
| Oct 12 (Mon, holiday) | Resort | 75.0% | 78.8% | 82.2% | 82.8% | +7.8pt | 11.7% |
| Oct 10 (Sat) | Business | 76.3% | 84.3% | 91.1% | 91.6% | +15.3pt | 25.7% |
| Oct 11 (Sun) | Business | 70.0% | 76.3% | 84.2% | 85.0% | +15.0pt | 8.6% |
| Oct 12 (Mon, holiday) | Business | 61.1% | 68.0% | 74.4% | 75.9% | +14.8pt | 7.1% |
Scope: resort hotels N=196 properties / 16,608 rooms; business hotels N=140 properties / 12,924 rooms (major booking site listings; same property set for all three stay dates). Sold-out property rate is the share of properties with no listed inventory found on OTAs and similar channels (estimate).
Source: MetroEngines Research; compiled by the HotelBank Editorial Team
On the first night, Oct 10, resorts led by 6.1pt at 45 days out (82.4% versus 76.3% for business hotels), but by 12 days out business hotels had built to 91.6% and overtaken resorts at 89.7%. Pickup from 45 to 12 days out was +15.3pt for business hotels and +7.3pt for resorts, meaning business hotels filled about twice as fast as resorts over those 33 days. The sold-out property rate has also reached 28.6% for resorts and 25.7% for business hotels, a level at which more than one in four properties shows no listed inventory.
The final night, Oct 12, looks different. Resorts are at 82.8% at 12 days out, only 6.9pt below the first night, whereas business hotels are at just 75.9%, widening the gap to the first night to 15.7pt. Listed rooms still unsold total 2,852 for resorts and 3,118 for business hotels, so the segment with fewer rooms has more left over. The sold-out property rate for business hotels is 7.1%, far below the 25.7% of the first night. Even within the same three-day weekend, business hotels show a shape in which only the first night is strong.
Figure 1 | Booking Curves for Oct 10 (First Night) and Oct 12 (Final Night) — T-45 to T-12
Source: MetroEngines Research; compiled by the HotelBank Editorial Team
Figure 1 overlays the first- and final-night curves by segment. The two resort lines rise gently and almost in parallel. The two business hotel lines are steeper, but they too are close to parallel. What this shows is that the pace of pickup is determined by segment, and the spacing between the first and final nights does not narrow as the days go by.
The Gap Is Set by 45 Days Out — Only the Final-Night Segment Gap Narrows
We want to confirm in numbers that this spacing does not narrow. Table 2 lines up, for each checkpoint, the drop from the first night to the final night and the gap between resorts and business hotels.
Table 2 | First-to-Final-Night Gap and Segment Gap by Checkpoint (Oct 10 and Oct 12)
| Checkpoint | Resort: first → final night | Business: first → final night | Final-night segment gap (Resort − Business) | First-night segment gap (Resort − Business) |
|---|---|---|---|---|
| T-45 | −7.4pt | −15.2pt | +13.9pt | +6.1pt |
| T-30 | −7.5pt | −16.3pt | +10.8pt | +2.0pt |
| T-14 | −7.5pt | −16.7pt | +7.8pt | −1.4pt |
| T-12 | −6.9pt | −15.7pt | +6.9pt | −1.9pt |
Scope: resort hotels N=196 properties / 16,608 rooms; business hotels N=140 properties / 12,924 rooms (major booking site listings). Estimated OCC is an estimate based on OTA listed inventory.
Source: MetroEngines Research; compiled by the HotelBank Editorial Team
The drop from the first night to the final night went from 7.4pt at 45 days out to 6.9pt at 12 days out for resorts, and from 15.2pt to 15.7pt for business hotels, in both cases a move of less than 1pt. The business hotel final night added +14.8pt over 33 days, but the first night also added +15.3pt, so the gap did not close. The weakness of the final night of a holiday weekend does not emerge at the last minute; it can be read as already visible in the shape at 45 days out.
The picture changes, however, when we turn to the gap between segments. The resort-business gap on the final night halved, from 13.9pt at 45 days out to 10.8pt at 30 days, 7.8pt at 14 days and 6.9pt at 12 days. On the first night, the +6.1pt at 45 days out reversed to −1.9pt by 12 days out. Resorts fill early and add little afterward, while business hotels move late and add more; the difference in how bookings arrive shows up directly in the figures.
So how does a holiday Monday compare with an ordinary Monday? Lining up October’s four Mondays at the 30-day checkpoint, the holiday, Oct 12, was the lowest in both segments (Table 3).
Table 3 | October’s Four Mondays Compared at the T-30 Checkpoint
| Stay date | Resort at T-30 | Business at T-30 | Segment gap |
|---|---|---|---|
| Oct 5 (Mon) | 81.0% | 70.9% | +10.1pt |
| Oct 12 (Mon, holiday) | 78.8% | 68.0% | +10.8pt |
| Oct 19 (Mon) | 82.6% | 76.9% | +5.7pt |
| Oct 26 (Mon) | 80.0% | 69.5% | +10.5pt |
Scope: resort hotels N=196–197 properties / 16,608–16,628 rooms; business hotels N=140 properties / 12,924 rooms (major booking site listings).
Source: MetroEngines Research; compiled by the HotelBank Editorial Team
Business hotels stood at 68.0% for Oct 12, below every ordinary Monday: 70.9% for Oct 5, 76.9% for Oct 19 and 69.5% for Oct 26. Because the day after a holiday Monday is a working day, leisure travelers head home, while the business-trip demand that would arrive on an ordinary Monday has not yet started moving. It appears to be a day on which both leisure and business demand run thin. Resorts are also lowest on Oct 12, at 78.8%, among the four days, but the gap to the highest, Oct 19, is only 3.8pt, a smaller swing than the 8.9pt for business hotels.
Figure 2 | Estimated OCC by Stay Date, October 2026 — T-30 Checkpoint (Oct 1–Oct 30)
Scope: resort hotels N=196–198 properties / 16,608–16,678 rooms; business hotels N=140 properties / 12,924 rooms (major booking site listings). Values as of 30 days before each stay date.
Source: MetroEngines Research; compiled by the HotelBank Editorial Team
Figure 2, which lines up 30 days of October at the same 30-day checkpoint, shows that this difference in swing extends across the whole month. Resorts ranged from a low of 78.0% on Oct 27 to a high of 86.3% on Oct 10, a spread of 8.3pt. Business hotels ranged from a low of 65.9% on Oct 13, the day after the holiday weekend, to a high of 84.5% on Oct 16, a spread of 18.6pt. The business hotel trough is deepest from the final night of the three-day weekend into the following Tuesday, and this is where attention to inventory belongs in the first half of October.
How the September Holiday Run Landed — The Final Night Did Not Catch Up in the Last 12 Days
How far will the final night fill in the remaining 12 days? As the most recent actual result, we check the landing of the September holiday run (Sat, Sep 19 through Wed, Sep 23, a public holiday) in the same framework. Okinawa’s estimated OCC for September 2026 averaged 87.7% for resorts (N=182–203 properties) and 86.7% for business hotels (N=134–142 properties) for the month. Table 4 shows three points for the five holiday nights: 12 days out, 3 days out and the final reading.
Table 4 | September 2026 Holiday Run (Sep 19–Sep 23) — Estimated OCC at T-12, T-3 and Final, and Pickup over the Last 12 Days
| Stay date | Segment | T-12 | T-3 | Final (T-1) | T-12 → final |
|---|---|---|---|---|---|
| Sep 19 (Sat) | Resort | 87.3% | 88.7% | 92.7% | +5.4pt |
| Sep 20 (Sun) | Resort | 92.9% | 93.3% | 96.5% | +3.6pt |
| Sep 21 (Mon, holiday) | Resort | 92.4% | 93.3% | 95.8% | +3.4pt |
| Sep 22 (Tue, holiday) | Resort | 85.3% | 88.4% | 92.5% | +7.2pt |
| Sep 23 (Wed, holiday) | Resort | 79.6% | 83.5% | 88.2% | +8.6pt |
| Sep 19 (Sat) | Business | 84.2% | 88.1% | 91.9% | +7.7pt |
| Sep 20 (Sun) | Business | 87.6% | 91.0% | 94.5% | +6.9pt |
| Sep 21 (Mon, holiday) | Business | 84.8% | 89.0% | 92.0% | +7.2pt |
| Sep 22 (Tue, holiday) | Business | 78.4% | 82.4% | 85.8% | +7.4pt |
| Sep 23 (Wed, holiday) | Business | 70.8% | 74.6% | 77.9% | +7.1pt |
Scope: resort hotels N=196–203 properties / 16,676–17,214 rooms; business hotels N=136–141 properties / 12,857–13,020 rooms (major booking site listings; the property set is fixed for each stay date).
Source: MetroEngines Research; compiled by the HotelBank Editorial Team
On the peak night, Sep 20, the final reading was 96.5% for resorts and 94.5% for business hotels, a gap of only 2.0pt, whereas on Sep 23, with a working day following, it was 88.2% for resorts and 77.9% for business hotels, a gap of 10.3pt. The drop from peak to final night was 8.3pt for resorts and 16.6pt for business hotels, close to the 6.9pt and 15.7pt observed at 12 days out for the current October three-day weekend. Even when the type of holiday run differs, each segment falls away in a similar shape.
Figure 3 | Landing of the Five September Holiday Nights — Final (T-1) Estimated OCC
Scope: resort hotels N=196–203 properties / 16,676–17,214 rooms; business hotels N=136–141 properties / 12,857–13,020 rooms (major booking site listings).
Source: MetroEngines Research; compiled by the HotelBank Editorial Team
The point to note is the pickup over the last 12 days. Business hotels stayed within a range of +6.9 to +7.7pt on all five nights, adding almost the same amount regardless of how strong or weak the stay date was. The final night, Sep 23, also added +7.1pt, taking 70.8% at 12 days out to only 77.9%. Resorts added little on peak nights (+3.4 to +3.6pt) and more on the final night, Sep 23 (+8.6pt), yet the segment gap of 8.8pt at 12 days out actually widened to 10.3pt by the final reading. At least in the September holiday run, no last-minute move was observed in which the business hotel final night caught up with the other nights.
Applying this yardstick to October, business hotels on the final night, Oct 12, stand at 75.9% at 12 days out, 5.1pt above the same point for the September final night (70.8%). Resorts, at 82.8%, are also 3.2pt above September’s 79.6%. The starting point is better than in September, but a scenario in which last-minute pickup lifts the final night to first-night levels looks unlikely. It is natural to treat final-night inventory not as something that fills if you wait, but as something to sell in connection with first- and middle-night demand.
For Revenue Managers Running Resort and Business Hotels in Okinawa — Implications and Action Plan
The final-night gap is a “45 days out” issue, not a “last-minute” issue — the drop from the first night to the final night was almost the same at 45 days out (resorts 7.4pt, business hotels 15.2pt) and at 12 days out (6.9pt and 15.7pt). When checking your own booking pace against the market curve, it is worth measuring not only the level for each night but also the spacing between the first and final nights once, at 45 days out. If your spacing is wider than the market’s, there is room to start working on the final night early.
For business hotels, first-night inventory is the lever for steering guests into multi-night stays — at 12 days out the first night is at 91.6% for business hotels with a sold-out property rate of 25.7%, so little is left. The final night, by contrast, is at 75.9% with 3,118 rooms remaining. Rather than selling out the first night as single-night stays, allocating it to bookings that stay through the final night is likely to lift occupancy across the whole weekend. A minimum length of stay (MLOS) is the tool for this, but applying it on the wrong nights or lifting it at the wrong time leads to lost first-night sales, so the decision points should be set in advance.
Last-minute pickup does not favor any stay date — over the September holiday run, business hotel pickup in the last 12 days was +6.9 to +7.7pt on all five nights. Weaker nights did not grow more at the last minute. A design that attaches the final night to first- and middle-night bookings is more likely to protect rate than filling the final night with last-minute discounts.
Because the resort gap is small, extension offers tend to work — the resort final night is high at 82.8%, yet 2,852 rooms remain. Given that bookings staying on the first and middle nights are already deep, it is worth considering post-stay extension offers to existing bookings and late check-out messaging rather than chasing new single-night stays. The fact that a holiday Monday comes in lower than an ordinary Monday (78.8% at 30 days out) is also a premise for planning post-holiday inventory.
We now organize the above into moves for the remaining 12 days and preparation for the next three-day weekend. In November, Sat the 21st through Mon the 23rd (a public holiday) is a three-day weekend, and 45 days before its first night falls on October 7. The timing allows the current observations to be used directly as decision criteria for the next one.
Table 5 | Action Plan — Moves for the Remaining 12 Days and Preparation for the Next Three-Day Weekend
| Time frame | Action | Decision trigger (figures from this article) | Aim |
|---|---|---|---|
| Today through this week (up to 7 days out) | Raise the visibility of multi-night plans spanning Oct 11–12 and Oct 10–12, and sell the final night as the last night of a multi-night stay | Your Oct 12 pace is short of the market level at 12 days out (resorts 82.8%, business hotels 75.9%) | Attach the final night to first- and middle-night demand instead of trying to sell it out on its own |
| Today through this week (up to 7 days out) | Review the minimum length of stay (MLOS) applied to the first night, Oct 10, and how single-night stays arriving Oct 11 and Oct 12 are opened | Your Oct 10 is as thin as the market (resorts 89.7%, business hotels 91.6%; sold-out property rate 28.6% and 25.7%) while Oct 12 is still open | Give priority for scarce first-night inventory to bookings that stay through the final night |
| Last minute (3 days out to the day before) | Decide whether to lift the first-night MLOS and, if lifting it, strengthen the final-night single-stay message at the same time | At 3 days out, first-night inventory remains and the final night is below the September 3-days-out level (resorts 83.5%, business hotels 74.6%) | Avoid both losing first-night sales to the multi-night condition and leaving the final night unsold |
| Last minute (3 days out to the day before) | For final-night-only bookings, consider messaging that adds non-price value (late check-out, breakfast, parking, etc.) | Using the September final-night landing (resorts 88.2%, business hotels 77.9%) as a guide, your Oct 12 looks unlikely to reach it | Supplement occupancy without eroding rate, on the premise that pickup in the last 12 days is limited |
| T-45 for the next three-day weekend (Nov 21–23) | On Oct 7–Oct 9, when the weekend reaches 45 days out, measure your own gap in pace between the first and final nights | That gap is wider than the range observed in the market at 45 days out this time (resorts 7.4pt, business hotels 15.2pt) | Start working on the final night before the gap sets |
| T-30 for the next three-day weekend (Nov 21–23) | Consider a design that releases perks and multi-night discounts for bookings including the final night ahead of first-night promotions | At 30 days out, your final night is short of this weekend’s market level at 30 days out (resorts 78.8%, business hotels 68.0%) | Build exposure on the final night first, adding depth to multi-night steering once the first night thins out |
All decision-trigger figures are the Okinawa segment-level aggregates shown in this article (estimated OCC, OTA listed-inventory basis). They should be adapted to your own guest mix and channel mix.
A note on when to lift the MLOS: whether to go into the last few days with a multi-night condition still on the first night depends on how much of the final night remains. Over the September holiday run, pickup from 3 days out to the final reading was +3.3pt for the business hotel final night (74.6% → 77.9%) and +4.7pt for resorts (83.5% → 88.2%). On the premise that this is roughly how much moves in the last three days, treating 3 days out as the decision point between continuing to steer guests into multi-night stays and opening up single nights is an effective approach.
Summary — Three Yardsticks for Final-Night Inventory
To sum up, the yardsticks for reading final-night inventory on a holiday weekend come down to three.
1. Measure the spacing between the first and final nights at 45 days out. The drop for the October three-day weekend started at 7.4pt for resorts and 15.2pt for business hotels, and was 6.9pt and 15.7pt at 12 days out. The shape is set early and then moves almost in parallel.
2. The segment gap narrows, but the gap to the first night does not. The resort-business gap on the final night halved from 13.9pt to 6.9pt. Even so, the business hotel final night is 15.7pt below the first night, with 3,118 rooms remaining.
3. Pickup in the last 12 days does not favor any night. Over the September holiday run, business hotels added around +7pt on all five nights, and the final night landed at 77.9%. The final night is something to sell together with the first and middle nights, not something to wait on at the last minute.
Resorts hold up even on the final night of a holiday weekend, while business hotels concentrate on the first night. With this difference in shape as the premise, the approach to selling the final night should be built segment by segment.
About the Data
| Estimated OCC | Occupancy on an OTA listed-inventory basis = 100 − 100 × rooms still listed on OTAs ÷ total rooms. Covers a fixed cohort of properties that list at least 30% of their total rooms on OTAs (same property set for each stay date). It is an estimate based on how inventory sold on OTAs is absorbed, and its definition differs from actual room occupancy (it runs higher because unlisted rooms are counted as sold). |
| Booking curve | Based on observations from 45 days before the stay date to the most recent date. The checkpoints in this article are 45, 30, 14 and 12 days out, plus 3 days out and the final reading (1 day out) for stay dates already past. |
| Sold-out property rate | Share of properties with no listed inventory found on OTAs and similar channels (estimate). |
| Scope | Okinawa. October three-day weekend (Oct 10–Oct 12): resort hotels N=196 properties / 16,608 rooms; business hotels N=140 properties / 12,924 rooms. Other October stay dates: resorts N=196–198 properties / 16,608–16,678 rooms; business hotels N=140 properties / 12,924 rooms. September holiday run (Sep 19–Sep 23): resorts N=196–203 properties / 16,676–17,214 rooms; business hotels N=136–141 properties / 12,857–13,020 rooms (all based on major booking site listings). City hotels are not included in the segment aggregates because only 8 properties are in scope. |
| Price metrics | This article covers booking progress only (estimated OCC and sold-out property rate) and contains no price metrics. |
| Data as of | Data as of October 1, 2026. Sales status and inventory change daily, so the figures in this article are a snapshot at the time of retrieval. |
Source: MetroEngines Research; compiled by the HotelBank Editorial Team
References and Sources
■ Data sources
Daily observation by MetroEngines Research of inventory listed on major booking sites (Okinawa, by segment). A fixed cohort of properties listing at least 30% of total rooms; for the October three-day weekend, resort hotels N=196 properties / 16,608 rooms and business hotels N=140 properties / 12,924 rooms. Holiday dates are as published by the Cabinet Office.
■ Calculation assumptions
Estimated OCC is “100 − 100 × rooms still listed ÷ total rooms.” Checkpoints are 45, 30, 14 and 12 days before the stay date (12, 3 and 1 days for the September holiday run), and the first-to-final-night drop and the segment gap are simple differences in estimated OCC at each checkpoint. Remaining rooms are the total of rooms still listed at 12 days out.
■ Limitations and caveats
Estimated OCC runs higher than actual room occupancy because unlisted rooms are counted as sold. The five-day September holiday run and the October three-day weekend differ in length and in the sequence of weekdays, so the September pickup range will not necessarily apply to October. City hotels are excluded because only 8 properties are in scope. Prices are not covered.
| Holiday dates | Cabinet Office, “National Holidays” |