

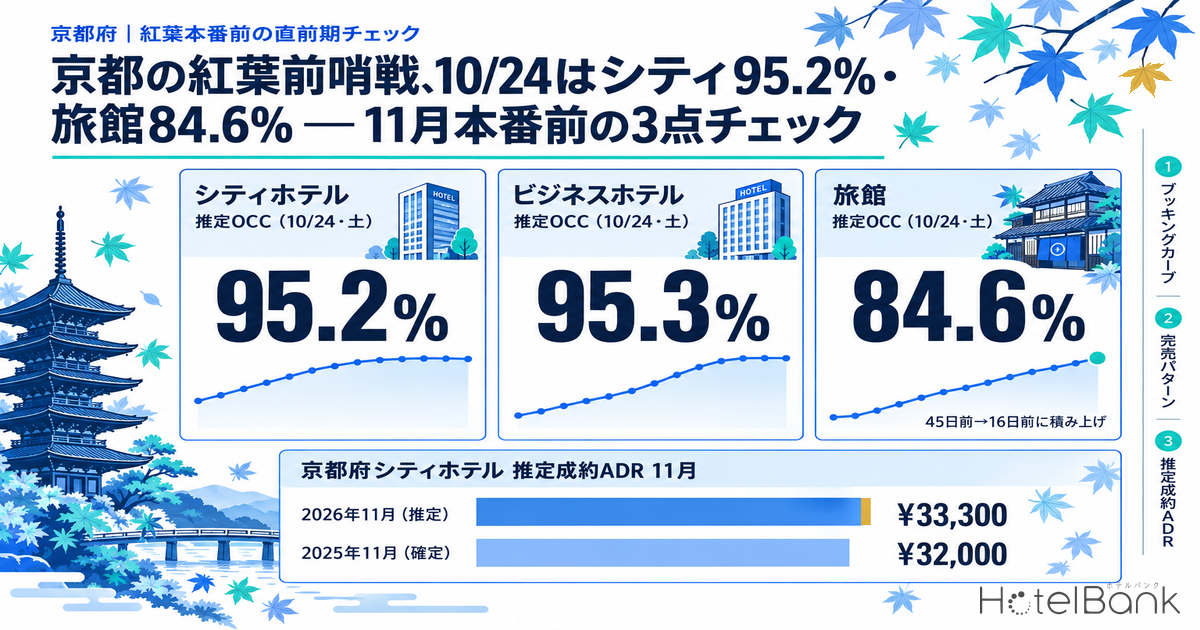
We checked how Kyoto Prefecture’s hotels and ryokan are filling in late October — before peak autumn-foliage season arrives in November — from three angles: booking curves, sell-out patterns and November’s estimated settled ADR. As observed on October 8, 2026, estimated OCC (based on OTA-listed inventory) for Saturday, October 24 already stood at 95.2% for city hotels (N=37 properties / 5,084 rooms) and 95.3% for business hotels (N=195 properties / 19,252 rooms) — above 95% with 16 days still to go. Ryokan, by contrast, had added +14.0 points from 70.6% at 45 days out yet still sat at 84.6% (N=122 properties / 2,194 rooms), so hotels and ryokan are filling in clearly different ways. On the price side, the estimated settled ADR for Kyoto Prefecture city hotels for November 2026 is ¥33,300 (N=62; an estimate based on current sales), running above the final November 2025 figure of ¥32,000 (N=58). This article puts those three data sets side by side and lays out, as a practical routine, the “three-point check for the final weeks” that revenue managers will want to run before peak foliage season.
Scope: Kyoto Prefecture city hotels N=37 properties / business hotels N=195 properties / ryokan N=122 properties (booking curves; fixed cohort as of Oct 24, based on listings on major booking sites). The price metric in this article is estimated settled ADR (the settled price level estimated from OTA and other sales data, tax-excluded equivalent); occupancy is an estimate based on OTA-listed inventory. Definitions for both are at the end of the article. Data as of October 9, 2026.
- — Estimated OCC for Oct 24 (Sat): city hotels 95.2%, business hotels 95.3%, ryokan 84.6% (16 days out, observed October 8, 2026). Gains since 45 days out were +7.6 points for city hotels, +11.1 points for business hotels and +14.0 points for ryokan, so a ryokan’s progress cannot be judged from its 45-day level alone.
- — Ryokan and business hotels share the same 31.1% sold-out rate, but for different reasons (Oct 24). 20 ryokan (19.4%) and 11 business hotels (10.4%) had recorded a sell-out more than 45 days out; 39 business hotels and 25 ryokan sold out for the first time from 45 days out onward.
- — The October→November step in estimated settled ADR was +9.3% for city hotels, +19.6% for business hotels and +60.3% for ryokan on 2025 final figures. Current 2026 estimates are +6.5%, +16.6% and +41.5%, so ryokan November pricing has not yet risen to last year’s shape.
Three late-October Saturdays — hotels are already near 90% at 45 days out, while ryokan add 11–17 points from there
First, let us pin down the booking curves for the three Saturdays before peak foliage season (Oct 17, Oct 24 and Oct 31) at three points: 45 days out, 30 days out and the latest observation. Kyoto Prefecture city hotels (N=37 properties / 5,084 rooms) stood at 87.6% at 45 days out for Oct 24 (Sat), 90.4% at 30 days out and 95.2% at the latest observation (16 days out) — already close to 90% at 45 days out, then adding 7.6 points gradually over the 29 days to 16 days out. Business hotels (N=195 properties / 19,252 rooms) rose +11.1 points from 84.2% at 45 days out to 95.3% at the latest observation, a larger gain than city hotels because they started lower. Ryokan (N=122 properties / 2,194 rooms), by contrast, went from 70.6% at 45 days out to 80.4% at 30 days out and 84.6% at the latest observation, adding +14.0 points over the same period. Ryokan pick up about 1.8 times the gain of city hotels and about 1.3 times that of business hotels over the same window, so reading only the 45-day figure and concluding they are “behind” would be a misreading. The same pattern was also observed on the Saturdays of Sep 26 and Oct 3.
Source: Compiled by MetroEngines Research and the HotelBank Editorial Team
Oct 17 (Sat) has been observed even closer in, to 9 days out. City hotels rose steadily to 88.9% at 45 days out and 92.1% at 30 days out, peaked at 95.5% at 15 days out, and at the latest observation stood at 94.4% — flat to slightly down. This shape suggests listed inventory has all but run out, and the remaining few percent are no longer unsold rooms but “inventory moving in and out.” Business hotels likewise rose +11.9 points from 81.8% at 45 days out to 93.7% at the latest observation and are close to plateauing, whereas ryokan rose +17.3 points from 63.6% at 45 days out to 80.9% at the latest observation and are still climbing with fewer than 10 days to go.
What about Oct 31 (Sat)? The latest observation is 23 days out: city hotels 93.1%, business hotels 90.1%, ryokan 79.9%. At the same 23-days-out point, Oct 24 stood at 94.0% for city hotels, 92.7% for business hotels and 82.8% for ryokan, so Oct 31 is running slightly behind the previous week at the same stage: −0.9 points for city hotels, −2.6 points for business hotels and −2.9 points for ryokan. The gaps are small, but the fact that ryokan lag by more than the two hotel types is consistent with the difference in sell-out patterns discussed below.
| Type / stay date | N / rooms | 45 days out | 30 days out | Latest observation | Gain |
|---|---|---|---|---|---|
| City hotels, Oct 17 (Sat) | 37 / 5,084 rooms | 88.9% | 92.1% | 94.4% (LT9) | +5.5pt |
| City hotels, Oct 24 (Sat) | 37 / 5,084 rooms | 87.6% | 90.4% | 95.2% (LT16) | +7.6pt |
| City hotels, Oct 31 (Sat) | 37 / 5,084 rooms | 88.0% | 90.7% | 93.1% (LT23) | +5.1pt |
| Business hotels, Oct 17 (Sat) | 195 / 19,252 rooms | 81.8% | 87.9% | 93.7% (LT9) | +11.9pt |
| Business hotels, Oct 24 (Sat) | 195 / 19,252 rooms | 84.2% | 90.4% | 95.3% (LT16) | +11.1pt |
| Business hotels, Oct 31 (Sat) | 192 / 19,038 rooms | 82.8% | 87.2% | 90.1% (LT23) | +7.3pt |
| Ryokan, Oct 17 (Sat) | 124 / 2,199 rooms | 63.6% | 72.2% | 80.9% (LT9) | +17.3pt |
| Ryokan, Oct 24 (Sat) | 122 / 2,194 rooms | 70.6% | 80.4% | 84.6% (LT16) | +14.0pt |
| Ryokan, Oct 31 (Sat) | 124 / 2,258 rooms | 68.5% | 76.4% | 79.9% (LT23) | +11.4pt |
Source: Compiled by MetroEngines Research and the HotelBank Editorial Team
Weekday event dates and Sundays — business hotels top 97% on Oct 21, while Sundays fall below 90%
Next, the peaks and dips created by day of week and events. Figure 2 lines up the latest estimated OCC for each type on eight dates in late October. Oct 21 (Wed) and Oct 22 (Thu) stand out: business hotels reached 97.4% on Oct 21 (13 days out), above Saturday Oct 24 (95.3%), and 94.0% on Oct 22 (14 days out), close to the Saturday level. City hotels were also at Saturday levels, with 95.7% on Oct 21 and 94.8% on Oct 22, and even ryokan reached 83.3% on Oct 21, close to their own Oct 24 figure (84.6%). Oct 22 is the day of the Jidai Matsuri, one of Kyoto’s three great festivals, and the same evening’s Kurama Fire Festival; it is reasonable to attribute the un-weekday-like occupancy on Wednesday Oct 21 — the night before — to this demand.
Source: Compiled by MetroEngines Research and the HotelBank Editorial Team
Sundays are the contrast. Oct 18 (Sun) stood at city hotels 87.7%, business hotels 85.0% and ryokan 78.1% (all 10 days out), and Oct 25 (Sun) at city hotels 88.7%, business hotels 86.7% and ryokan 75.5% (17 days out) — 6.5–8.7 points below the preceding Saturday for the two hotel types, and 2.8 points (Oct 18) and 9.1 points (Oct 25) lower for ryokan. Nov 1 (Sun) was at city hotels 83.1%, business hotels 79.9% and ryokan 71.1% (24 days out), and even at 45 days out its starting point was 8–11 points below the October Saturdays, at city hotels 78.7% and business hotels 73.5%. A private weather company forecasts peak foliage in Arashiyama around November 24 (see References), and the starting point of the curve also shows that the first week of November is still at “pre-peak” demand levels. As a practical rule of thumb, the gap between the full-house pressure of Saturdays and festival eves and the slack from Sunday through Thursday is about 10 points in late-October Kyoto.
Sell-out patterns — about 20% of ryokan “recorded a sell-out more than 45 days out,” while hotels sell out mostly from 45 days out onward
A booking curve shows the shape of the market average; it does not tell you when individual properties closed their inventory. So we narrowed the set to properties listing at least 30% of their total rooms on major booking sites and looked at the distribution of sell-out patterns by stay date. “Sold out” here is an estimate meaning no listed inventory can be found on OTAs and other channels; it does not match in-house actual occupancy. “First sold out more than 45 days out” and “first sold out from 45 days out onward” are property counts split by when a sell-out was first observed, and include properties whose inventory later reappeared. Note also that market-average estimated OCC and the sold-out property rate measure different things: the former reflects how thinly the remaining inventory is spread across the market, the latter how many properties have closed out completely.
| Type / stay date | Properties | Sold out now (sold-out rate) | First sold out >45 days out (incl. reappeared) | First sold out from 45 days out | Inventory reappeared after sell-out |
|---|---|---|---|---|---|
| Ryokan, Oct 17 (Sat) | 110 | 29 (26.4%) | 13 (11.8%) | 33 | 17 |
| Ryokan, Oct 24 (Sat) | 103 | 32 (31.1%) | 20 (19.4%) | 25 | 13 |
| Ryokan, Oct 31 (Sat) | 118 | 19 (16.1%) | 18 (15.3%) | 12 | 11 |
| Business hotels, Oct 17 (Sat) | 116 | 29 (25.0%) | 12 (10.3%) | 44 | 27 |
| Business hotels, Oct 24 (Sat) | 106 | 33 (31.1%) | 11 (10.4%) | 39 | 17 |
| Business hotels, Oct 31 (Sat) | 117 | 23 (19.7%) | 15 (12.8%) | 19 | 11 |
Source: Compiled by MetroEngines Research and the HotelBank Editorial Team
Comparing Oct 24 (Sat), the sold-out rate is about the same for ryokan at 31.1% (32 of 103 properties) and business hotels at 31.1% (33 of 106 properties), but the make-up differs. For ryokan, 20 properties — 19.4% of the set — had recorded a sell-out at least once more than 45 days before the stay date (including properties whose inventory later reappeared), compared with just 11 business hotels (10.4%); instead, 39 business hotels sold out for the first time between 45 days out and the latest observation, more than the 25 ryokan that did so. In other words, ryokan are polarized into “properties that close early” and “properties that sell to the end,” while hotels follow a pattern of sell-outs concentrated from 45 days out onward. The reason the market-average curve for ryokan stays around 70% at 45 days out can be read as follows: small properties that sell out early contribute little on a room-count basis, and the inventory of the remaining properties pulls the average down.
Another figure worth noting is the right-hand column: the number of properties whose “inventory reappeared after sell-out.” For Oct 24, 13 ryokan and 17 business hotels showed listed inventory again after a period in which none could be found. This is likely the result of cancellations returning to sale or additional inventory released close in, and this movement of inventory in and out also explains the slight late dip for city hotels on Oct 17 in Table 1. The closer the stay date, the higher the sold-out rate: Oct 17 is at 26.4% for ryokan and 25.0% for business hotels, while Oct 31, still 23 days out, is lower at 16.1% for ryokan and 19.7% for business hotels — consistent with how far the curves have progressed. Only 13 city hotels met the 30%-listed-inventory condition for Oct 24, 4 of them sold out, so we treat city hotels as a reference figure only.
Switching to November pricing — estimated settled ADR steps up 6–42% from October to November
Finally, the price side. Lining up Kyoto Prefecture’s estimated settled ADR (monthly, tax-excluded equivalent) using 2025 final figures and current 2026 estimates, the step from October to November differs sharply by type. In 2025, city hotels went from ¥29,200 in October (N=58) to ¥32,000 in November (N=58), +9.3%; business hotels from ¥18,100 (N=319) to ¥21,600 (N=314), +19.6%; and ryokan from ¥21,000 (N=182) to ¥33,700 (N=191), +60.3% — the ryokan foliage premium stood out. On current 2026 estimates (estimates based on sales so far, which may change once the month closes), city hotels go from ¥31,300 in October (N=61) to ¥33,300 in November (N=62), +6.5%; business hotels from ¥20,800 (N=322) to ¥24,300 (N=317), +16.6%; and ryokan from ¥20,900 (N=193) to ¥29,600 (N=192), +41.5%.
| Type | Oct 2025 (final) | Nov 2025 (final) | Nov / Oct | Oct 2026 (current est.) | Nov 2026 (current est.) | Nov / Oct |
|---|---|---|---|---|---|---|
| City hotels | ¥29,248 (N=58) | ¥31,958 (N=58) | +9.3% | ¥31,306 (N=61) | ¥33,348 (N=62) | +6.5% |
| Business hotels | ¥18,068 (N=319) | ¥21,610 (N=314) | +19.6% | ¥20,814 (N=322) | ¥24,259 (N=317) | +16.6% |
| Ryokan | ¥20,992 (N=182) | ¥33,659 (N=191) | +60.3% | ¥20,901 (N=193) | ¥29,570 (N=192) | +41.5% |
Source: Compiled by MetroEngines Research and the HotelBank Editorial Team
Note that October and November 2026 are both current estimates, so simple comparisons with final figures must wait for the month to close. Reading the shape alone, the two hotel types have already priced in a step toward November close to last year’s, whereas ryokan November pricing has not yet risen as far as last year: +41.5% now versus +60.3% a year earlier. Since ryokan keep adding occupancy from 45 days out onward, November prices also likely have considerable room to move from here.
Source: Compiled by MetroEngines Research and the HotelBank Editorial Team
Comparing final figures year over year, in the latest month, September 2026, city hotels were at ¥20,200 (N=61), −14.6% against ¥23,600 (N=58) a year earlier; business hotels at ¥11,700 (N=327), −2.4%; and ryokan at ¥19,700 (N=197), +6.1%. That city hotels head into the pre-foliage period with September well below last year — while late-October occupancy is in the 95% range — suggests the premise that “occupancy is sufficient, but rates have not fully recovered.” The year-over-year lines for city hotels in Figure 3 show the same: in 2026 the spring peak (¥30,000 in April) was 8.1% below the previous year (¥32,600), the summer trough was deeper than a year earlier, and from October onward the dotted line (current estimates) sits above the previous year.
For revenue managers running hotels and ryokan in Kyoto Prefecture — implications and action plan
Operational insights
First, read your own booking curve against the market’s three checkpoints (45 days out, 30 days out, latest). For Oct 24, Kyoto Prefecture city and business hotels stood at 87.6% and 84.2% at 45 days out, and 90.4% and 90.4% at 30 days out. If your property is below these checkpoints for the date, the remaining inventory has room to move over the final two weeks as the “last Saturday” before peak foliage season; if you are above them, you will plateau close in, as city hotels did on Oct 17, and you can judge that this is not the time to cut the price of remaining rooms to fill them.
Second, ryokan should check their position using the sell-out distribution rather than the market-average curve. For Oct 24, 19.4% of the ryokan in the set had recorded a sell-out at least once more than 45 days out, while 13 properties had re-released inventory after selling out. If your property is an early-sell-out type, the question is whether there is room to re-release inventory at November prices rather than keep it closed. If it is a sell-to-the-end type, check whether you are keeping pace with a market that starts from 70.6% at 45 days out and adds around 14.0 points close in.
Third, treat weekday event dates and Sundays as separate products. On Oct 21, business hotels stood at 97.4%, above Saturday (95.3%), and Oct 22 was close to Saturday at 94.0%, whereas the Sundays of Oct 18 and Oct 25 stayed at 85–89% for the two hotel types and in the high 70s for ryokan. Designing offers that fill Sunday slack with stays extended from Saturday or Sunday check-in perks is a standard move in late-October Kyoto.
Fourth, check the November price switch by comparing the shape of the step with last year. On last year’s final figures, November/October was +9.3% for city hotels, +19.6% for business hotels and +60.3% for ryokan; if your November rates step up from October by less than this, you may be selling peak-foliage demand at October prices.
| Timeframe | Action | Trigger (tied to figures in this article) | Aim |
|---|---|---|---|
| Today–this week (final days before Oct 17 and Oct 18) | Hold rates on remaining Oct 17 (Sat) rooms and release extended-stay / Sunday check-in offers for Oct 18 (Sun) | If your Oct 17 has reached the market’s latest 94.4% (city) / 93.7% (business) while your Oct 18 is below the 87.7% / 85.0% level | Fill Sunday slack with extended stays while protecting the Saturday rate |
| Today–this week | Review inventory shown as sold out for Oct 17 and Oct 24, and re-release returned cancellations using November pricing logic | If you are in the same position as the 13 ryokan / 17 business hotels that re-released inventory after selling out | Avoid missing sales on closed inventory |
| Within two weeks (toward Oct 24 and Oct 25) | Do not discount Oct 24 (Sat) if it is above the 30-day checkpoint; sell Oct 25 (Sun) as a second night after Saturday | If your Oct 24 is above the market’s 30-days-out 90.4% (city) / 90.4% (business) / 80.4% (ryokan) | Sell through remaining inventory without lowering the rate |
| Within two weeks | Decouple Oct 21 (Wed) and Oct 22 (Thu) from weekday rates and sell them at festival-demand price points | If your Oct 21 / Oct 22 are below the market’s 97.4% / 94.0% (business) yet still on weekday rates | Capture weekday event demand |
| Toward next month (Oct 31 and the first week of November) | Move remaining Oct 31 (Sat) inventory toward November price points, and target the first week of November from Nov 1 (Sun) with pre-foliage promotions | If your Oct 31 is below the market’s 23-days-out 93.1% (city) / 90.1% (business) / 79.9% (ryokan), and your Nov 1 is around 83.1% / 79.9% / 71.1% | Smooth out the price break between end-October and early November |
| Toward next month | Check November pricing by its step over October, and compare it with last year’s shape | If your November/October step is well below last year’s final city +9.3% / business +19.6% / ryokan +60.3% | Capture peak-foliage demand at peak-season prices |
None of these actions is guaranteed to be effective; please consider them in light of your own guest mix and contract terms.
Summary — the “three-point check” before peak foliage season
To sum up, late October in Kyoto Prefecture moved in two patterns: hotels near 90% at 45 days out and in the 95% range at the latest observation, and ryokan around 70% at 45 days out and in the 80% range at the latest observation. What to check in the final weeks comes down to the following three points.
| Check item | What to look at | Benchmark from this article |
|---|---|---|
| 1. Releasing inventory on dates that have not grown by 45 days out | Gap between your curve and the market’s three checkpoints; whether inventory is re-released after sell-out | Market at 45 days out: city 87.6%, business 84.2%, ryokan 70.6% (Oct 24). Re-released after sell-out: 13 ryokan, 17 business hotels |
| 2. Different sell-out patterns for ryokan and hotels | Share of properties that recorded a sell-out more than 45 days out vs. share that first sold out from 45 days out | 19.4% of ryokan recorded a sell-out more than 45 days out; 39 of 106 business hotels first sold out from 45 days out (Oct 24) |
| 3. Timing of the switch to November pricing | Compare the October→November step in estimated settled ADR with last year’s shape | Last year’s final: city +9.3%, business +19.6%, ryokan +60.3%; current estimate: city +6.5%, business +16.6%, ryokan +41.5% |
This yardstick can be reused beyond Kyoto, at any tourist destination heading into its autumn peak. Overlay your property on the market’s three checkpoints, confirm your type with the sell-out distribution, and compare the price step into the next month with last year. Checking in that order makes it easier to avoid giving away peak-foliage demand at pre-peak prices.
Frequently asked questions
Q. Why doesn’t estimated OCC match my property’s actual occupancy?
A. Estimated OCC in this article is a metric based on OTA-listed inventory; rooms not listed are counted as sold, so it runs higher than actual room occupancy. Compare against your property by the shape of the gains at 45 days out, 30 days out and the latest observation, not by level.
Q. Will the Oct 24 figures change?
A. Yes. This article is a snapshot taken on October 9, 2026; the latest booking-curve observation is October 8, with Oct 24 observed 16 days out and Oct 31 observed 23 days out. Sales and inventory change daily, so refer to the latest observation for close-in decisions.
Q. Is November’s estimated settled ADR a final figure?
A. October and November 2026 are estimates based on current sales and will change once the month closes. Year-over-year comparisons are made between final months only (in this article, through September 2026 and each month of 2025).
About the data
・Estimated OCC (based on OTA-listed inventory), definition: occupancy based on OTA-listed inventory = 100 − 100 × OTA-listed rooms remaining ÷ total rooms. The set is a fixed cohort of properties listing at least 30% of their total rooms on OTAs (the same set of properties for each stay date; the number of properties is the N). It is an estimate based on how inventory sold on OTAs is being absorbed, and its definition differs from actual room occupancy (rooms not listed are counted as sold, so it runs higher).
・Booking curves: based on observations from 45 days before the stay date to the latest. The checkpoints are three: 45 days out, 30 days out and the latest observation.
・Estimated settled ADR: the settled price level (tax-excluded equivalent) estimated from OTA and other sales data (lowest-plan level × type-specific factor; an ensemble across multiple channels). Past months are final figures; current and future months are estimates based on sales so far. Median error against published operating results: 6.6%.
・Scope: Kyoto Prefecture. Booking curves: city hotels N=37 properties / 5,084 rooms, business hotels N=192–195 properties / 19,038–19,252 rooms, ryokan N=121–125 properties / 2,165–2,262 rooms (varies by stay date; based on listings on major booking sites). Estimated settled ADR: city hotels N=55–62, business hotels N=312–329, ryokan N=182–207 (varies by month). Sell-out patterns cover properties listing at least 30% of their total rooms on major booking sites (103 ryokan, 106 business hotels, 13 city hotels as of Oct 24); “sold out” is the share of properties with no listed inventory found on OTAs and other channels (estimate).
・Treatment of current estimates: estimated settled ADR for October and November 2026 are mid-sale estimates whose level may change when finalized. Growth rates spanning final months (through September 2026) and estimated months should not be read as the size of a price increase.
・Data as of: retrieved October 9, 2026 (latest booking-curve observation October 8; sell-out patterns as of October 9). Sales and inventory change daily, so the figures in this article are a snapshot as of retrieval.
・Source: Compiled by MetroEngines Research and the HotelBank Editorial Team
References and sources
・Autumn-leaves forecast 2026: later than usual nationwide, Kyoto’s Arashiyama around November 24 — Weathernews (Travel Voice, September 4, 2026; in Japanese)
・Jidai Matsuri, October 22, 2026 — event information (Nippon Travel Agency; in Japanese)
・Kurama Fire Festival 2026 (Japan Travel)