

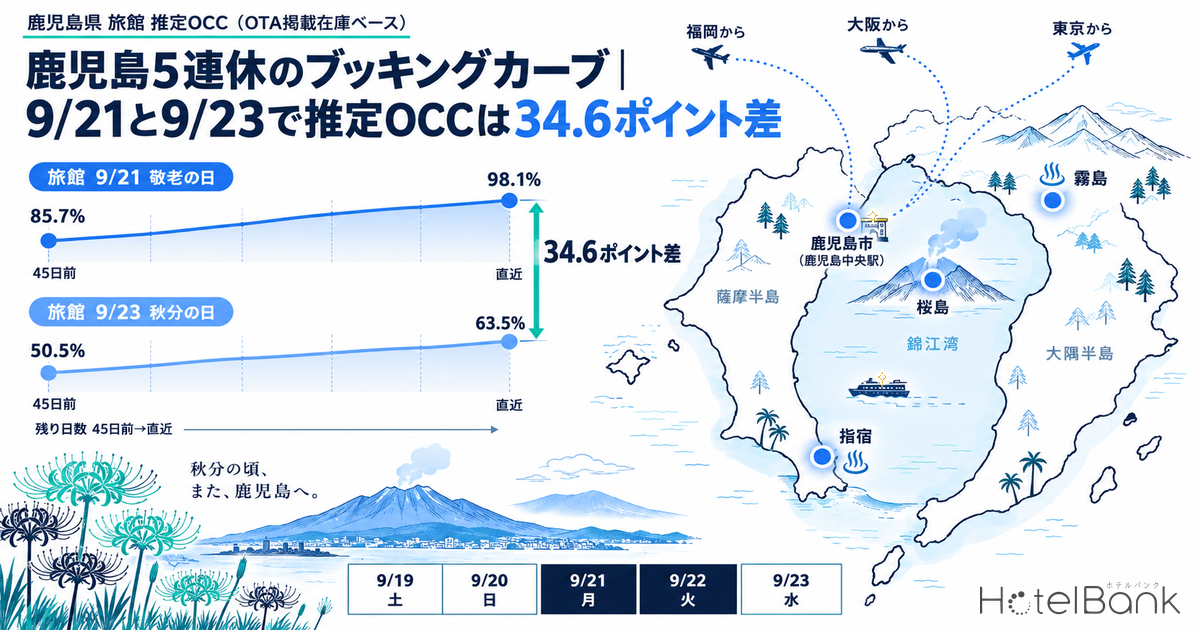
From Saturday, September 19 through Wednesday, September 23 (Autumnal Equinox Day), 2026, Tuesday the 22nd falls between Respect for the Aged Day and the Autumnal Equinox and is designated a “Citizens’ Holiday,” producing the first five-day holiday in 11 years. Tracking Kagoshima Prefecture’s lodging inventory by stay date shows that these five days are far from uniform. In the most recent observation (as of September 12, 2026), estimated OCC for ryokan (OTA-listed-inventory basis) reached 98.1% on September 21 (N=66 properties), while the final day, September 23, stood at 63.5% — a 34.6-point spread inside the same holiday. For business hotels the spread is even wider: 54.1% on September 21 against 16.5% on September 23 (N=76 properties). This article lays out booking curves by property type from 45 days before each stay date through the most recent observation, and organizes how to allocate remaining inventory at T-30 and T-14.
Scope: Kagoshima Prefecture — ryokan N=66 properties, resort hotels N=30 properties, city hotels N=16 properties, business hotels N=76 properties. Price figures in this article are estimated settled ADR (the transaction price level inferred from OTA and other sales data, tax-excluded equivalent); occupancy is an estimate on an OTA-listed-inventory basis. Both definitions appear at the end of the article. Data as of September 13, 2026.
• ADR (average daily rate) = an estimated settled rate (tax-excluded equivalent) calculated by applying a property-type correction coefficient to the lowest published plan level each property lists on OTAs (double occupancy, per-room rate, tax included). Cross-checked against property-level results disclosed by listed hotel REITs (91 properties, most recent three months), the median error is approximately 7%. These are estimates and differ from each property’s actual transaction prices and accounting figures.
• ADR at the area level (prefecture / municipality) is the median estimated settled rate across the target properties (the level of a typical property in that area).
• Where published prices are referenced, figures are per-room rates at double occupancy (tax included).
• OCC (occupancy rate) = the share of sold rooms against total rooms in the area (an estimate based on OTA sales inventory).
• Source: MetroEngines Research (continuous tracking of published OTA prices for approximately 168,000 properties nationwide, of which roughly 27,000 have confirmed occupancy data)
- — A spread of up to 37.6 points: in the most recent observation, estimated OCC (OTA-listed-inventory basis) for ryokan was 98.1% on 9/21 against 63.5% on the final day, 9/23 (N=66 properties). Business hotels went from 54.1% to 16.5%.
- — The level 45 days out determines where the day lands: the build-up for ryokan was +12.4pt for 9/21 and +13.0pt for 9/23 — nearly the same amount. The difference lay in the starting point 45 days out (85.7% vs 50.5%).
- — The “Citizens’ Holiday” on 9/22 gained +24.3pt: ryokan moved from 64.4% at 45 days out to 88.7% most recently. Rather than reading thinness at 45 days out as weak demand, holding inventory back past T-30 is worth considering.
The Five Days at the Latest Reading — Up to a 37.6-Point Gap Between the Peak Day and the Final Day
First, the most recent observed values for each of the five days, by property type. The figures are the newest observation obtained for each stay date (a reading taken 7 to 11 days before the stay date), expressed as estimated OCC on an OTA-listed-inventory basis.
Source: MetroEngines Research, compiled by the HotelBank Editorial Team
The shape is broadly common across the four property types. Sunday (9/20) and Respect for the Aged Day (9/21) form the peaks, Tuesday (9/22) steps down, and Wednesday (9/23), the Autumnal Equinox itself, is the lowest. The size of the drop, however, differs clearly by type. The gap between September 21 and September 23 is 34.6 points for ryokan, 29.0 points for city hotels, 25.3 points for resorts and 37.6 points for business hotels. Ryokan and resorts, driven mainly by leisure demand, fall from a high position; business hotels fall further from an already low one.
Another feature is that the opening Saturday (9/19) sits below the middle days. For ryokan, 9/19 is 86.4% against 98.4% on 9/20. The first day of a long holiday is used as a travel day, with lodging demand thickening on the second and third nights — the typical shape of an extended holiday.
From 45 Days Out to the Latest Reading — 9/21 Was Already Full, 9/23 Never Built Up
Next, booking curves from 45 days before the stay date through the most recent observation, drawn for ryokan and resort hotels across two stay dates each: September 21 and September 23. The horizontal axis is days remaining (45 days out → most recent).
Source: MetroEngines Research, compiled by the HotelBank Editorial Team
For ryokan, September 21 already stood at 85.7% 45 days out. It built up +12.4 points from there to 98.1% most recently, but the bulk of that gain is concentrated after T-30 (90.1% at 30 days out → 97.6% at 14 days out). In other words, the outcome was largely settled by the 45-day mark, and what remained was how to sell the last dozen or so points close in.
September 23 is the contrast: 50.5% at 45 days out → 53.4% at 30 days → 61.7% at 14 days → 63.5% most recently. The build-up over those 45 days is +13.0 points, almost the same absolute amount as September 21, but because the starting point is 35 points lower the landing stays low as well. The slope of the curve is similar and only the level is shifted in parallel — which means not that the day “failed to pick up late,” but that the booking base 45 days out was thin to begin with.
Resort hotels show the same structure: September 21 ran 86.0% → 95.5% (+9.5 points) and September 23 ran 61.8% → 70.2% (+8.4 points). The build-up is smaller than for ryokan, so the level 45 days out sets the landing level almost directly. The same three-point frame of 45, 30 and 14 days out was applied to Kagoshima’s summer by property type in Kagoshima Summer Booking Curves: 23.2pt Gap by Type at 45 Days Out, which likewise found that the types starting lower 45 days out are the ones that build up later.
| Property type (N) | Stay date | 45 days out | 30 days out | 14 days out | Latest | 45 days out → latest |
|---|---|---|---|---|---|---|
| Ryokan (66 properties, 1,477 rooms) | 9/21 (Mon, Respect for the Aged Day) | 85.7% | 90.1% | 97.6% | 98.1% | +12.4pt |
| Ryokan (66 properties, 1,477 rooms) | 9/23 (Wed, Autumnal Equinox Day) | 50.5% | 53.4% | 61.7% | 63.5% | +13.0pt |
| Resort (30 properties, 1,548 rooms) | 9/21 (Mon, Respect for the Aged Day) | 86.0% | 91.3% | 95.3% | 95.5% | +9.5pt |
| Resort (30 properties, 1,548 rooms) | 9/23 (Wed, Autumnal Equinox Day) | 61.8% | 65.2% | 67.8% | 70.2% | +8.4pt |
| City (16 properties, 1,931 rooms) | 9/21 (Mon, Respect for the Aged Day) | 89.6% | 92.3% | 94.5% | 95.4% | +5.8pt |
| City (16 properties, 1,931 rooms) | 9/23 (Wed, Autumnal Equinox Day) | 62.9% | 64.1% | 65.7% | 66.4% | +3.5pt |
| Business (76 properties, 6,034 rooms) | 9/21 (Mon, Respect for the Aged Day) | 32.8% | 39.8% | 50.6% | 54.1% | +21.3pt |
| Business (76 properties, 6,034 rooms) | 9/23 (Wed, Autumnal Equinox Day) | — | — | 1.2% | 16.5% | — |
Estimated OCC (OTA-listed-inventory basis). Based on observations from 45 days before the stay date through the most recent reading. Source: MetroEngines Research, compiled by the HotelBank Editorial Team
For business hotels on September 23, additions to listed inventory coincided with the first half of the observation window, so the 45-day and 30-day readings are not treated as progress indicators here (shown as “—” in the table). The most recent level of 16.5% itself shows that this date is carried neither by holiday demand nor by weekday business demand.
The Easily Overlooked 9/22 — A Day That Gained 24.3 Points From 45 Days Out
The day that moved most across the five is in fact Tuesday, September 22 — the “Citizens’ Holiday.” For ryokan, September 22 ran 64.4% at 45 days out → 69.5% at 30 days → 86.6% at 14 days → 88.7% most recently, a build-up of +24.3 points. That is the largest gain of any of the five stay dates. Resort hotels also rose, from 75.5% to 87.7% (+12.2 points).
At the 45-day mark, September 22 looked like a second-tier day, roughly level with September 19 (ryokan 69.4%). It then became the third peak after September 20 and 21 over the final month. The movement can be read as the first “Citizens’ Holiday” in 11 years taking time to register as part of a long holiday. September 23, by contrast, is the last day of the break, and with Thursday the 24th a working day, lodging demand never accumulated through to the end. An analysis comparing booking progress on the back two days of the holiday against onsen and resort prefectures and urban areas is covered in detail in Silver Week 2026 Back Half at T-47: Sep 23 Matches a Normal Wednesday.
The share of properties with no confirmable listed inventory (an estimate, referred to below as the “sold-out property rate”) tells the same story. For ryokan, September 21 moved from 37.9% at 45 days out to 81.8% most recently, and September 20 from 50.8% to 90.9% — most properties are sold out — while September 23 only moved from 13.6% to 19.7%. For city hotels on September 23, the sold-out property rate stayed at 0.0% from 45 days out through the latest reading. Whatever the property type, the final day of the holiday is the day that still has inventory left.
A Yardstick for Price Levels — Kagoshima’s Estimated Settled ADR
It is worth checking the price side as well. Kagoshima Prefecture’s estimated settled ADR (confirmed values) for July 2026 was ¥5,900 for business hotels (N=160 properties) and ¥7,400 for city hotels (N=26 properties). For the same month a year earlier (July 2025) the figures were ¥5,900 (N=155 properties) and ¥8,200 (N=23 properties) respectively, making year-on-year change +0.6% for business and −9.4% for city. As a reference point for September, the confirmed values for September 2025 were ¥5,900 for business (N=157 properties) and ¥9,700 for city (N=23 properties). September 2026 is still awaiting its monthly confirmation, so any direct comparison with confirmed values has to wait until the month closes.
Estimated settled ADR (confirmed values). Source: MetroEngines Research, compiled by the HotelBank Editorial Team
Viewed year over year, Kagoshima’s business hotels move within a narrow band of roughly ¥5,700–¥6,500 across the year; in 2025 August (¥6,500) was the peak and September (¥5,900) a step down from it. City hotels ran high at around ¥9,700 in August–September and November 2025, while in 2026 April through July all came in below the same month a year earlier (July 2026 ¥7,400, N=26 properties). At the monthly level the holiday peak is hard to see, and cutting price in line with the month’s overall average means forfeiting the revenue opportunity on the peak days themselves.
For Revenue Managers Running Ryokan, Resort, Business and City Hotels in Kagoshima Prefecture — Implications and Action Plan
1. Treat the holiday as a set of daily products. Within the same five-day break, estimated OCC for ryokan is 98.1% on September 21 and 63.5% on September 23 — 34.6 points apart. If a single flat rate calendar is applied across the whole holiday, the result may be the inversion of selling the peak day cheap and the trough day dear. There is room to lay out your own settings day by day and check whether their shape matches the market curve.
2. The level 45 days out has largely decided the landing. Ryokan on September 21 added +12.4 points from 85.7% at 45 days out; September 23 added +13.0 points from 50.5%. The amount built up was almost identical. Turning a trough day into a peak with a late discount is difficult; it is more natural to read the outcome as settled by the product build and exposure achieved before T-45. For future holidays, there is value in a routine that compares your own pickup at T-45 against the market level.
3. “Citizens’ Holiday”-type dates are easy to misjudge early. September 22 rose +24.3 points, from an unremarkable 64.4% at 45 days out to 88.7% most recently. For irregular dates on the holiday calendar, rather than concluding that thinness at 45 days out means weak demand, holding inventory back in anticipation of growth after T-30 is worth considering.
4. Leftover inventory on the final day means different things by property type. The sold-out property rate for city hotels on September 23 was 0.0% from 45 days out through the latest reading. Business hotels on the same date, meanwhile, sat at 16.5% most recently — a day where the absolute volume of demand is thin to begin with. The former is leftover inventory that pricing and plan design can pick up; the latter is a day when the whole market is empty, and the two deserve separate responses.
| Time horizon | Action | Decision trigger | Objective |
|---|---|---|---|
| Today to this week (within the last 10 days) | Shift the remaining inventory for Wed 9/23 toward products that fold it in as the final night of a multi-night stay | If your unsold volume for 9/23 exceeds the market level for that date (ryokan 63.5% / city 66.4%) | Pick up a day with thin single-night demand via extensions from the fully booked day before |
| Today to this week | Re-confirm floor prices on the last few rooms for 9/20 and 9/21 | If the market sold-out property rate has reached 90.9% for ryokan on 9/20 and 81.8% on 9/21 while your own low rate settings are still live | Avoid discounting the last few rooms in a market that is essentially sold out |
| Within two weeks | Check day by day how demand falls away after the holiday (9/24 onward) | If business hotels at 16.5% most recently for 9/23 indicate weak weekday demand as well, assume a slow restart after the break | Inventory allocation that prices in the post-holiday pullback |
| Within two weeks | Record your own results for this holiday day by day, overlaid on the market curve | Always retain the three points T-45 / T-30 / T-14 (the same frame used in this article) | Build an in-house yardstick usable for future holidays |
| Looking to next month | Set target levels at T-45 by property-type benchmark for holidays and weekends in October and November | For ryokan and resorts, roughly 85% at 45 days out marks a peak day; 50–60% marks a trough day to be handled separately | Identify peaks and troughs early and bring product build and exposure forward |
| Looking to next month | Assuming entry into the seasonal downswing, switch the rate revision calendar from monthly averages to daily | If settings below the prior-year September confirmed estimated settled ADR (business ¥5,900 / city ¥9,700) are being applied uniformly, peak days included | Keep peak days out of the monthly downward trend |
Source: MetroEngines Research, compiled by the HotelBank Editorial Team
Summary — Three Yardsticks for Reading a Long Holiday
Yardstick 1: the spread. Within the same holiday, the estimated OCC gap between the peak day and the final day is 34.6 points for ryokan, 37.6 for business, 29.0 for city and 25.3 for resorts. The moment a holiday is treated as a single block, that spread disappears from rate setting.
Yardstick 2: the starting point. The level 45 days out largely decides the landing. Ryokan on 9/21 started at 85.7% and landed at 98.1%; 9/23 started at 50.5% and landed at 63.5%. The build-up (+12.4pt / +13.0pt) was almost the same, and the difference lay in the starting point.
Yardstick 3: irregular dates. The first “Citizens’ Holiday” in 11 years, 9/22, went from 64.4% at 45 days out to 88.7% most recently — +24.3 points. In years when the calendar is irregular, not misreading thinness at 45 days out as weak demand is what separates good inventory allocation from bad.
About the Data
・Definition of estimated OCC (OTA-listed-inventory basis): OTA-listed-inventory occupancy rate = 100 − 100 × rooms remaining on OTA listings ÷ total rooms. The scope is a fixed cohort of properties listing at least 30% of their total rooms on OTAs (the same set of properties for every stay date). It is an estimate based on how listed OTA inventory is being taken up, and differs in definition from actual room occupancy (it runs high because rooms not listed are counted on the sold side). Target month: September 2026 (stay dates September 19–23, 2026).
・Booking curves: based on observations from 45 days before the stay date through the most recent reading.
・Definition of estimated settled ADR: the transaction price level (tax-excluded equivalent) estimated from OTA and other sales data (lowest plan level × property-type coefficient, an ensemble across multiple channels). Past months are confirmed values; the current and future months are estimates based on sales conditions at this point in time. Cross-checked against published operating results, the median error is 6.6%.
・Breakdown of target N: estimated OCC = Kagoshima Prefecture ryokan 66 properties / 1,477 rooms (September 19 only: 65 properties / 1,465 rooms), resort hotels 30 properties / 1,548 rooms, city hotels 16 properties / 1,931 rooms, business hotels 76 properties / 6,034 rooms (all on a major booking site listing basis). Estimated settled ADR = Kagoshima Prefecture business hotels 153–161 properties, city hotels 21–26 properties (varying by month; monthly N values are given in the text). The sold-out property rate is an estimate of the share of properties whose listed inventory cannot be confirmed on OTAs and similar channels.
・Data as of September 13, 2026. Sales conditions and inventory change daily, so the figures in this article are a snapshot at the time of retrieval.
References and Sources
・Cabinet Office, “About National Holidays” (in Japanese) https://www8.cao.go.jp/chosei/shukujitsu/gaiyou.html
・Impress Watch, “Silver Week returns: September 2026 brings the first long holiday in 11 years” (in Japanese) https://www.watch.impress.co.jp/docs/topic/2048266.html