

Halloween 2026, October 31, falls on a Saturday. It is the first time in six years that Halloween and a Saturday have coincided — the last time was 2020, when movement restrictions were in place. With 41 days still to go before the stay date, lining up the booking pace of three districts — Shibuya (Shibuya Ward, Tokyo), Minami (Chuo Ward, Osaka) and Sakae (Naka Ward, Nagoya) — at the same lead time shows three cities with clearly different shapes. In our earlier analysis, October 31 still sat outside the reliable observation window, so we held off comparing the curves. Now that the date has entered the comparable window, this article lines up every Friday, Saturday and Sunday in October at the same lead time and on the same set of properties, and examines the conditions that turn night-time crowds into overnight stays.
Metric Definitions Used in This Article
- ADR (average daily rate): An estimated settled rate (tax-exclusive equivalent), calculated by applying segment-specific adjustment factors to the lowest-plan price level each property publishes on OTAs and similar channels (per room, two guests per room, tax-inclusive). Benchmarked against property-level results disclosed by listed hotel REITs (91 properties, most recent three months), the median error is about 7%. This is an estimate and differs from each property’s actual settled prices and accounting figures. Area-level ADR is the median across the covered properties (the level of a typical property in the area).
- OCC (occupancy rate): The share of sold rooms in the area’s total room count (an estimate based on OTA sales inventory). In this article it is labelled “occupancy (estimated, based on OTA-listed inventory)”. It reflects how inventory sold on OTAs is being absorbed and differs from a property’s actual overall occupancy.
- LT (lead time): Days until check-in; LT0 = the stay date itself. The curves in this article use LT45 or less only. Observations more than 45 days before the stay date may include periods before properties top up their sales allocations, and so may not reflect booking progress.
- Listed price: The per-room price averaged across all plans published on OTAs and similar channels at the time of observation (two guests per room, tax-inclusive). Because its basis differs from the estimated settled ADR, the two are never treated as the same figure.
- Remaining-room ratio: The share of a property’s total rooms still available on OTAs.
- Data source: MetroEngines Research
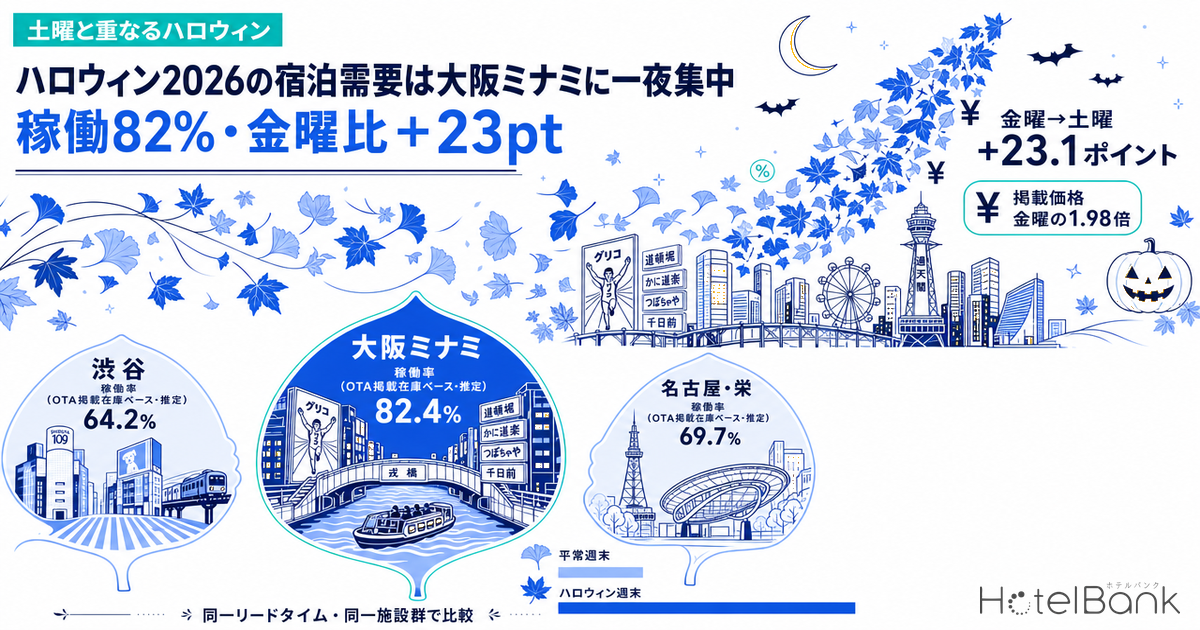
- — Osaka Chuo Ward at 82.4% — Occupancy for Halloween night (Saturday, October 31), measured 42 days before the stay date, is the highest of the month. Shibuya Ward (64.2%) and Nagoya’s Naka Ward (69.7%) sit at the lowest level among October’s four Saturdays.
- — Friday→Saturday +23.1 points — Comparing within the same week to hold seasonality constant, only Minami jumps. That is an order of magnitude above the +2.9 points of a normal weekend.
- — Listed price 1.98x — In Minami, prices rise from ¥21,900 on Friday to ¥43,400 on Saturday. City hotels are at 90.5% occupancy and ¥57,200, meaning the high-price tier is filling first.
- — Pricing headroom in Shibuya and Sakae — In the two wards where Halloween-night listed prices fall below other Saturdays in the same month, late-night check-in, next-morning late check-out and tiered pricing linked to the remaining-room ratio are ways to capture it.
Halloween-Night Occupancy: Osaka Minami 82.4%, Shibuya 64.2%, Nagoya Sakae 69.7%
First, we line up the supply-demand snapshot of the three areas on the same yardstick. The table below shows occupancy (estimated, based on OTA-listed inventory) and listed prices at the same lead time: 42 days before each stay date (43 days for November 1 only). To compare the same set of properties on the same day, each ward uses a fixed cohort: 20–21 properties / 3,880–3,938 rooms in Shibuya Ward, 134–135 properties / 19,752–19,821 rooms in Osaka’s Chuo Ward, and 56–57 properties / 10,248–10,383 rooms in Nagoya’s Naka Ward (based on listings on major booking sites). Observation coverage is 99–100% on every day.
Source: MetroEngines Research; compiled by HotelBank Editorial Team
Occupancy on Saturday, October 31 in Osaka’s Chuo Ward stands at 82.4% (as of September 19, 2026, 42 days before the stay date). That exceeds every other Saturday observed in the ward in October (54.9% on October 10, 58.3% on the 17th, 68.4% on the 24th), and is about 14 points above the closest, October 24. Shibuya Ward, by contrast, is at 64.2% and Nagoya’s Naka Ward at 69.7%. In these two wards, Halloween night is the lowest of October’s four Saturdays — level with, or slightly below, an ordinary Saturday.
| Stay date | Shibuya Ward occupancy | Shibuya Ward listed price | Osaka Chuo Ward occupancy | Osaka Chuo Ward listed price | Nagoya Naka Ward occupancy | Nagoya Naka Ward listed price |
|---|---|---|---|---|---|---|
| 10/10 (Sat) | 65.3% | ¥64,581 | 54.9% | ¥32,945 | 71.4% | ¥31,549 |
| 10/16 (Fri) | 66.5% | ¥53,297 | 55.4% | ¥21,951 | 82.2% | ¥24,975 |
| 10/17 (Sat) | 69.3% | ¥66,171 | 58.3% | ¥31,199 | 83.7% | ¥38,741 |
| 10/18 (Sun) | 67.3% | ¥47,755 | 53.6% | ¥20,455 | 79.1% | ¥23,509 |
| 10/24 (Sat) | 70.9% | ¥66,798 | 68.4% | ¥32,676 | 81.5% | ¥31,113 |
| 10/30 (Fri) | 63.6% | ¥53,460 | 59.3% | ¥21,945 | 63.9% | ¥17,113 |
| 10/31 (Sat, Halloween) | 64.2% | ¥59,553 | 82.4% | ¥43,429 | 69.7% | ¥32,196 |
| 11/1 (Sun) | 60.6% | ¥46,426 | 70.1% | ¥22,817 | 61.9% | ¥16,585 |
All figures at 42 days before the stay date (43 days for 11/1 only). Listed prices are all-plan averages, two guests per room, tax-inclusive. Source: MetroEngines Research; compiled by HotelBank Editorial Team
The same asymmetry appears in listed prices. In Osaka’s Chuo Ward, October 31 is priced at ¥43,400, about ¥10,000 above the other October Saturdays (¥31,200–¥32,900). In Shibuya Ward, by contrast, October 31 is at ¥59,600, below the ¥66,000-plus of October 17 and 24. Nagoya’s Naka Ward, at ¥32,200, also falls short of October 17 (¥38,700), the weekend of the Nagoya Festival. In other words, on price as well, Osaka Minami is the only area where October 31 is the most expensive Saturday of the month.
A +23.1-Point Friday-to-Saturday Jump — A One-Night Surge Seasonality Cannot Explain
At this point we want to tighten the methodology. Late October to early November is when the autumn-foliage season and inbound demand overlap, and the baseline in urban areas is itself stronger than at the start of the month. Comparing Saturdays alone cannot separate the Halloween effect from the seasonal lift. So we compare Friday and Saturday within the same weekend. Within a single week, seasonal factors are almost shared, so the difference gets closer to the event-specific effect.
Source: MetroEngines Research; compiled by HotelBank Editorial Team
The result is clear-cut. On a normal weekend (October 16→17), the Friday-to-Saturday rise in occupancy is almost identical across the three wards: +2.8 points in Shibuya Ward, +2.9 points in Osaka’s Chuo Ward and +1.5 points in Nagoya’s Naka Ward. On the Halloween weekend (October 30→31), however, Osaka’s Chuo Ward alone leaps to +23.1 points. Shibuya Ward stays at +0.6 points and Nagoya’s Naka Ward at +5.8 points.
Prices move in the same direction. The Friday-to-Saturday multiple on listed prices is 1.24x in Shibuya Ward, 1.42x in Osaka’s Chuo Ward and 1.55x in Nagoya’s Naka Ward on a normal weekend. On the Halloween weekend it is 1.11x, 1.98x and 1.88x respectively. In Osaka Minami, the market is already accepting prices roughly double for a single Saturday night at the early stage of 42 days before the stay date.
Listed price = all-plan average, two guests per room, tax-inclusive. Source: MetroEngines Research; compiled by HotelBank Editorial Team
The following Sunday is also worth reading. In Osaka’s Chuo Ward, Sunday, November 1 stands at 70.1%, 16.5 points above October 18 (53.6%), an ordinary Sunday. November 3 (Culture Day) falls on a Tuesday, so October 31 to November 1 is not a long weekend. Even so, Sunday night running above an ordinary Sunday indicates a spillover tail: part of the demand that gathered on Saturday carries over into the next day. In Shibuya Ward (60.6%) and Nagoya’s Naka Ward (61.9%), November 1 falls below an ordinary Sunday (67.3% and 79.1%), and no such tail is observed.
By Hotel Type, City Hotels Lead in Minami at 90.5%
Breaking October 31, 2026 down by hotel type (all as of September 19, 2026, 42 days before the stay date) reveals another layer of what the demand consists of. Only segments with an adequate sample size are shown.
| Area / hotel type | Properties | Rooms | Occupancy (est.) | Listed price |
|---|---|---|---|---|
| Osaka Chuo Ward — city hotels | 11 | 2,397 rooms | 90.5% | ¥57,206 |
| Osaka Chuo Ward — business hotels | 101 | 16,443 rooms | 81.3% | ¥36,851 |
| Nagoya Naka Ward — business hotels | 46 | 8,550 rooms | 68.7% | ¥25,606 |
| Shibuya Ward — business hotels | 12 | 2,524 rooms | 60.7% | ¥53,822 |
October 31, 2026 check-in, 42 days before the stay date. City-hotel segments for Shibuya Ward and Nagoya’s Naka Ward are not shown because the sample was too small to produce a curve. Source: MetroEngines Research; compiled by HotelBank Editorial Team
In Osaka Minami, city hotels (90.5%) are filling ahead of business hotels (81.3%). Their listed price of ¥57,200 is 1.55x that of business hotels (¥36,900). This suggests that visitors coming for the nightlife are not necessarily hunting for the cheapest rate. The room for acceptance even in the high-price tier can be read as upside for properties with upper-tier inventory.
Night-Time Crowds Are Down vs 2019 in All Three Cities — Why Overnight Demand Still Reacts Differently
Crowd size itself has in fact shrunk in every one of these districts. An analysis of Halloween 2025 using people-flow big data found that, compared with 2019, street gatherings shrank across the board: Shibuya −35.5%, Osaka’s Amerikamura −38.1%, Nagoya’s Sakae −38.3% and Fukuoka’s Tenjin −41.4%. Ikebukuro, meanwhile, held at pre-pandemic levels at +1.0%. The analysis frames this as demand shifting from spontaneous street gatherings toward events with an organizing body (Giken Shoji International, “Japan’s Halloween Read Through People-Flow Data, 2025 Edition”; the company’s note post, “People-flow data shows a ‘strategic contraction’ and the birth of ‘new crowd areas'”).
In Shibuya, the rules have changed too. Shibuya Ward amended its “Ordinance on Ensuring a Safe and Secure Environment in the Area Around Shibuya Station”, and since October 1, 2024 (Reiwa 6) drinking in public places has been banned year-round from 6 p.m. to 5 a.m. Before the amendment, the restriction applied only during the Halloween period and the year-end/New Year holidays; the time limit was removed and it now applies permanently. The restricted zone has also been expanded beyond the Center-gai side to areas such as Miyamasuzaka and Maruyamacho (Shibuya City portal, “Partial amendment of the Ordinance on Ensuring a Safe and Secure Environment in the Area Around Shibuya Station”). Under its “Zero Nuisance Street Drinking Declaration”, the ward has set out an approach built around patrols by security guards (Shibuya City portal). It is described as the first case in Japan of a year-round street-drinking restriction in an entertainment district (Research Institute for Local Government, “Ordinances Related to Halloween”; Tokyo Shimbun).
In Nagoya, too, the city has since 2021 closed parts of the rooftop and ground level of Oasis 21 and some walkways of Hisaya-odori Park during the Halloween period (Nagoya TV). In Sakae, events with a clearly identified organizer — such as the “Nagoya Halloween Rally”, which takes children around the district — have become established.
What this points to is that it is not the absolute size of the crowd but the “share of visitors who stay overnight” that differs from city to city. Shibuya sits at the center of the Tokyo metropolitan area, a vast day-trip catchment, and many visitors can get home by rail even after staying out late. Sakae is likewise mainly a day-trip destination from the Nagoya metropolitan area. Osaka Minami, by contrast, draws both visitors from a wide region beyond Kyoto–Osaka–Kobe and international travelers, and has a dense cluster of accommodation within walking distance of Shinsaibashi and Dotonbori. The Osaka Convention & Tourism Bureau also describes the Dotonbori and Amerikamura area as a place that fills with costumed visitors on October 31 (Osaka Convention & Tourism Bureau, “Guide to Halloween in Osaka”). Minami has all the conditions for night-time crowds to convert directly into overnight demand.
Nagoya Sakae’s Accommodation Peak Is the Nagoya Festival Weekend, October 17–18
In Nagoya’s Naka Ward, October’s biggest accommodation demand is created not by Halloween but by another event. The 72nd Nagoya Festival will be held on Saturday, October 17 and Sunday, October 18, 2026, with Hisaya-odori Park as the main venue (City of Nagoya, “Overview of the 72nd (FY2026) Nagoya Festival”). At 42 days before that weekend (September 5–6, 2026), occupancy was 83.7% for Saturday and 79.1% for Sunday — 14.0 and 17.2 points above October 31 (69.7%) and November 1 (61.9%) respectively. Its listed price of ¥38,700 on October 17 is also the highest among the month’s Saturdays.
On top of that, Nagoya is hosting the 20th Asian Games (Aichi-Nagoya 2026) from September 19 to October 4, 2026. It is the first Summer Asian Games held in Japan in 32 years, since Hiroshima in 1994, and a large-scale event featuring 43 sports (Japanese Olympic Committee). Because October’s monthly data includes the first four days of October that fall within the Games, this special factor needs to be separated out when reading the year-on-year change in monthly ADR discussed below. We have covered how Asian Games demand has spilled over to cities outside Nagoya in a separate analysis.
Monthly Estimated Settled ADR YoY — Shibuya +23.5%, Minami −19.6%, Sakae +60.0%
Stepping back from the daily snapshot, we check the underlying tone of the three wards with monthly estimated settled ADR. For October 2026, estimated settled ADR is ¥34,400 in Shibuya Ward (¥27,800 a year earlier, +23.5% YoY, N=31 properties), ¥13,300 in Osaka’s Chuo Ward (¥16,500 a year earlier, −19.6% YoY, N=189 properties) and ¥14,900 in Nagoya’s Naka Ward (¥9,300 a year earlier, +60.0% YoY, N=85 properties). For November, the figures are ¥33,900 in Shibuya Ward (+13.0% YoY), ¥13,300 in Osaka’s Chuo Ward (−7.5% YoY) and ¥11,900 in Nagoya’s Naka Ward (+8.4% YoY).
Source: MetroEngines Research; compiled by HotelBank Editorial Team
Source: MetroEngines Research; compiled by HotelBank Editorial Team
Source: MetroEngines Research; compiled by HotelBank Editorial Team
The decline in Osaka’s Chuo Ward reflects the fact that October 2025 coincided with the closing stretch of Expo 2025 Osaka, Kansai, which put the comparison base at an exceptionally high level. The 2025 curve formed a plateau of ¥14,500–¥16,500 from April through October, and 2026 can be read as a return to the pre-Expo level. It is therefore sensible not to judge the direction of demand from the YoY figure alone, but to read it alongside the daily snapshot; for the year after the Expo, comparing against two years earlier as well as one year earlier gives a steadier read. Indeed, on a daily basis, October 31 records both the highest occupancy and the highest listed price of the month.
The +60.0% in Nagoya’s Naka Ward stems from the inclusion of a period lifted by the Asian Games. Estimated settled ADR for September 2026 has risen to ¥20,200, and the Games effect extends into early October. To gauge Sakae’s normal level, November (+8.4% YoY), which does not include the Games period, is the cleaner indicator.
Characteristics of Properties Absorbing Inventory Fastest (An In-Progress Snapshot)
Next, we look at how inventory is being absorbed at the property level. Limiting the sample to properties that list at least 30% of their total rooms on OTAs, we tallied the remaining-room ratio for October 31 check-in. This condition prevents properties that deliberately run narrow listing allocations from being mistakenly picked up as having low remaining-room ratios.
| Area | Properties in area | With observation data | In scope | Remaining-room ratio under 10% | Lowest remaining-room ratio |
|---|---|---|---|---|---|
| Shibuya Ward, Tokyo | 203 | 37 | 16 | 0 properties | 10.4% |
| Chuo Ward, Osaka | 800 | 176 | 52 | 11 properties | 1.7% |
| Naka Ward, Nagoya | 333 | 91 | 33 | 5 properties | 0.0% |
October 31, 2026 check-in. Only properties whose OTA-listed allocation is at least 30% of total rooms are counted. Up to the 40 in-scope properties with the lowest remaining-room ratios are used in the analysis. Source: MetroEngines Research; compiled by HotelBank Editorial Team
Properties with a remaining-room ratio below 10% number 11 in Osaka’s Chuo Ward and 5 in Nagoya’s Naka Ward. In Shibuya Ward, none of the 16 in-scope properties is below 10%; even the furthest-along property still has 10.4% left. In Osaka’s Chuo Ward, six properties have reached a remaining-room ratio below 5%, with the lowest at 1.7% (a business hotel of around 60 rooms).
By property size, differences between the cities emerge. In Osaka’s Chuo Ward, the median remaining-room ratio is 19.0% for properties with 150 rooms or more (24 properties) and 13.9% for those with fewer than 80 rooms (12 properties), so smaller properties are absorbing faster. Nagoya’s Naka Ward shows the same pattern: 32.3% for 150 rooms or more (21 properties) versus 12.5% for fewer than 80 rooms (4 properties). Shibuya Ward, however, is reversed, at 39.7% for 150 rooms or more (6 properties) and 76.5% for fewer than 80 rooms (8 properties), meaning inventory is left over among small properties and hostels. It also means Shibuya’s small properties still have room to act on both pricing and stay design.
By hotel type, the fastest-absorbing properties are centered on business hotels in every ward (11 of 16 in Shibuya Ward, 30 of the top 40 in Osaka’s Chuo Ward and 28 of 33 in Nagoya’s Naka Ward).
How to Read These Figures
- This is a snapshot of bookings in progress and does not confirm sell-outs. There are 41 days to go before the stay date, and the picture will change with added inventory and price revisions.
- For five properties in Osaka’s Chuo Ward and three in Nagoya’s Naka Ward, zero remaining rooms were observed 45 or more days before the stay date. However, observations more than 45 days before the stay date may include periods before properties top up their sales allocations and so may not reflect booking progress (the properties concerned are within the in-scope set above; observation coverage is 99–100% on every day).
- Properties that appear to have low remaining-room ratios may reflect several possibilities: channel strategies centered on direct sales via official websites or travel-agency and corporate contracts, inventory control that releases rooms gradually as check-in approaches, or low contracted allotments. OTA public data alone cannot distinguish between these.
- A small number of remaining rooms refers only to what is left within the OTA-listed allocation and does not mean the property as a whole is fully booked.
Three Conditions for Turning Night-Time Crowds into Overnight Stays
Drawing on the data so far, we set out the conditions for turning Halloween night into overnight stays, tied to measured price and inventory figures. Please read these as proposals.
| Condition | Supporting data | Design direction |
|---|---|---|
| Plan around late-night check-in | October 31 is a single-night pattern. Osaka’s Chuo Ward moves +23.1 points in a single day, from 59.3% on Friday to 82.4% on Saturday. In Shibuya Ward, the following Sunday drops to 60.6%. | Extend the latest check-in time, publicize unstaffed/self check-in, and provide guidance so late-night arrivals can navigate the building easily. Make one-night, room-only stays the core offer. |
| Build next-morning late check-out into pricing | In Osaka’s Chuo Ward, Sunday, November 1 is at 70.1%, 16.5 points above October 18 (53.6%), an ordinary Sunday. There is a demand tail on the Sunday side as well. | Present late check-out as a paid option rather than a free perk. There is room to price a 10/31→11/1 two-night package above a Sunday-only stay. |
| Introduce tiered pricing early | In Osaka’s Chuo Ward, listed prices are already 1.98x Friday’s at 42 days out. City hotels lead in the high-price tier at 90.5% occupancy and a listed price of ¥57,200. Shibuya Ward’s October 31 is at ¥59,600, below the 17th and 24th of the same month (¥66,000-plus). | Raise prices in steps at remaining-room thresholds (e.g., 50%, 30%, 15%). Markets like Shibuya, where the event night sits below the month’s other Saturdays, can capture pricing headroom by promoting event-linked stay value. |
Source: MetroEngines Research; compiled by HotelBank Editorial Team
What the three have in common is treating Halloween not as “a costume day” but as “Saturday one-night night-time demand”. Given the people-flow finding that street gatherings are shrinking and demand is shifting toward organized events, what hotels should promote is not the costumes themselves, but the conditions that let guests stay out late and depart at leisure the next morning. A practical starting point is to find out early the end times of nearby events and the venue and crowd-flow information organizers announce, and reflect them in check-in times and plan design.
Inventory also behaves differently depending on whether demand follows a long-weekend pattern or a single-night pattern. Long-weekend demand tends to spread across consecutive nights, whereas single-night demand such as this Halloween concentrates on one date, so the handling of rooms left unsold close to the stay date also needs to be planned separately for each pattern.
⚠ Note on ADR and occupancy for future dates: The October and November figures in this article are estimates based on selling prices and inventory published on OTAs and similar channels at the time of the survey (September 20, 2026), and will change as check-in approaches. Monthly estimated settled ADR from September 2026 onward is estimated from current listing levels. Please bear in mind both that prices currently set high may fall through last-minute adjustments and that additional inventory may be released.
Summary
Halloween 2026, October 31, coincides with a Saturday for the first time in six years. Yet the response in terms of accommodation demand differed sharply across the three cities. At the same lead time of 42 days before the stay date, occupancy in Osaka’s Chuo Ward is 82.4% (as of September 19, 2026), the highest of the month, and its listed price of ¥43,400 is also the month’s highest. The rise from the Friday of the same weekend is +23.1 points, an order of magnitude above the +2.9 points of a normal weekend. A demand tail persists into the following Sunday, and city hotels lead at 90.5%.
Shibuya Ward, by contrast, is at 64.2% and Nagoya’s Naka Ward at 69.7%, both the lowest among October’s four Saturdays. Nagoya Sakae’s accommodation peak is the Nagoya Festival weekend of October 17–18, and Shibuya is a market that has had a year-round street-drinking restriction since October 2024. Night-time crowds are down versus 2019 in all three cities, but the rate at which they convert into overnight stays varies greatly with each city’s structure.
This gap also shows where pricing headroom remains. In Shibuya and Sakae, where Halloween-night listed prices sit below the month’s other Saturdays, there is room to capture higher rates by promoting event-linked stay value. Late-night check-in, next-morning late check-out and tiered pricing linked to the remaining-room ratio are all measures that can be put in place during the 41 days before the date.
Related Reading
References and Sources
■ Data sources
Observed selling prices and inventory published on major booking sites (MetroEngines Research). Daily occupancy and listed prices are aggregated on fixed cohorts: 20–21 properties / 3,880–3,938 rooms in Shibuya Ward, 134–135 properties / 19,752–19,821 rooms in Osaka’s Chuo Ward and 56–57 properties / 10,248–10,383 rooms in Nagoya’s Naka Ward, with observation coverage of 99–100% on every day. Monthly estimated settled ADR covers 31 properties in Shibuya Ward, 189 in Osaka’s Chuo Ward and 85 in Nagoya’s Naka Ward as of October 2026.
■ Calculation assumptions
All daily comparisons use a snapshot at the same lead time of 42 days before the stay date (43 days for November 1 only). Occupancy is the share of sold rooms in the area’s total room count (an estimate based on OTA sales inventory). Listed prices are all-plan averages, two guests per room, tax-inclusive. Estimated settled ADR is a tax-exclusive-equivalent estimate obtained by applying segment-specific adjustment factors to the lowest-plan price level; area values are the median across covered properties. Remaining-room ratios are tallied only for properties listing at least 30% of their total rooms on OTAs.
■ Limitations and caveats
October 31, 2026 was a future stay date at the time of writing, and the figures are a snapshot of bookings in progress. They will change with inventory additions and price revisions before the stay date. Because only public data are used, inventory handled through official-website direct sales, corporate contracts and allotments lies outside the observations. Observations at lead times beyond 45 days are not used, as they include periods before sales allocations are topped up. When reading YoY changes, the fact that October 2025 in Osaka coincided with the closing stretch of Expo 2025 Osaka, Kansai, and that September to early October 2026 in Nagoya coincides with the 20th Asian Games, needs to be treated separately.
■ Market data
- MetroEngines Research — estimated settled ADR, listed prices, occupancy (estimated, based on OTA-listed inventory), property-level remaining-room trends
■ Municipal and public sources
- Shibuya City, “Partial amendment of the Ordinance on Ensuring a Safe and Secure Environment in the Area Around Shibuya Station (effective October 2024)” (Japanese)
- Shibuya City, “Zero Nuisance Street Drinking Declaration” (Japanese)
- City of Nagoya, “Overview of the 72nd (FY2026) Nagoya Festival” (Japanese)
- Research Institute for Local Government, “Ordinances Related to Halloween” (Japanese)
- Japanese Olympic Committee, “Aichi-Nagoya Asian Games” (Japanese)
- Osaka Convention & Tourism Bureau, “Guide to Halloween in Osaka: Costumes and Fun in Dotonbori and Amerikamura” (Japanese)
■ People-flow and market research
- Giken Shoji International, “[2025 Edition] Japan’s Halloween Read Through People-Flow Data” (Japanese)
- Giken Shoji International note, “[How was Halloween 2025?] People-flow data shows a ‘strategic contraction’ and the birth of ‘new crowd areas'” (Japanese)
- INTAGE Shiru Gallery, “Halloween Is Coming: Shifting Consumer Attitudes and People Flow in Shibuya” (Japanese)
■ News coverage