

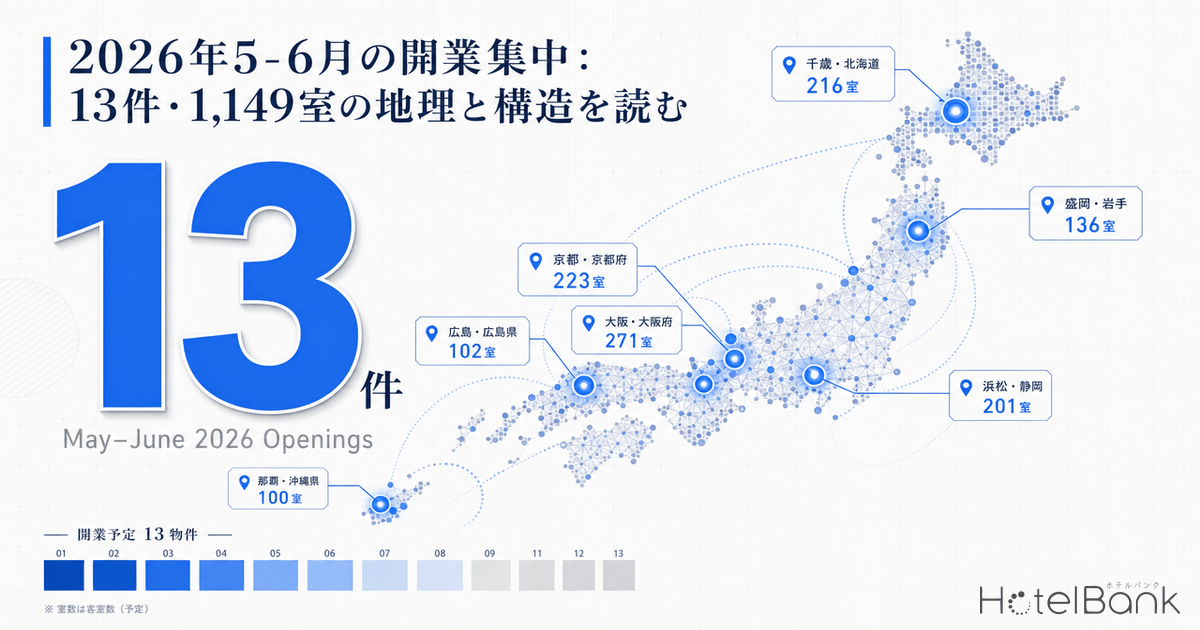

In May-June 2026, MetroEngines Research has identified a total of 13 hotel and accommodation property openings comprising 1,149 rooms. While large-scale city hotels and business hotels are concentrated in major tourist cities such as Okinawa, Osaka, Hokkaido, and Kyoto, vacation rentals account for 247 of the 475 annual openings (52%). Within this structure, the emergence of mid-sized business and city hotels in regional hubs stands out. This article analyzes the May-June opening cluster from four perspectives: geographic distribution, structure, supply increase ratio relative to existing ADR, and the investor viewpoint.
Metric Definitions Used in This Article
- ADR (Average Daily Rate): The average of selling prices publicly listed on OTAs and similar channels. This differs from actual transaction prices. Per-room rate for double occupancy (tax included), averaged across all plans (room-only through meal-inclusive).
- Sell-out Rate: The proportion of plans on OTAs that had closed reservations at the time of the survey. This differs from a property’s overall room occupancy rate.
- Data Source: MetroEngines Research
The opening hotel data discussed in this article reflects the scope captured by MetroEngines Research based on publicly available information from OTAs and construction/development announcements. It is not a comprehensive census conducted by the Japan Tourism Agency or local governments, and a certain number of unidentified small-scale facilities, vacation rentals, and simplified lodgings exist. Price data represents monthly averages of selling prices collected by MetroEngines Research (per-room rate for double occupancy, tax included).
Key Metric Definition: ADR (Average Daily Rate) refers to the average of selling prices publicly listed by surveyed properties and differs from actual transaction prices.
Overview of the 13 May-June Openings: 1,149 Rooms Distributed Across 12 Prefectures
May 2026 sees 6 openings and June sees 7, totaling 13 properties with 1,149 rooms in aggregate. While the count itself is lower than the Q1 monthly average (211 in January, 105 in February, 96 in March), this is largely due to the seasonal factor of vacation rental registrations being concentrated at the start of the year. What deserves more attention is the cluster of large and mid-sized properties opening in May-June.
The table below organizes the 13 May-June openings in order of room count.
| Opening Date | Property Name | Location | Category | Rooms |
|---|---|---|---|---|
| Jun 1 | The Gate Hotel Osaka by HULIC | Osaka | City Hotel | 223 |
| May 23 | South Gate Hotel Okinawa | Okinawa (Naha) | City Hotel | 216 |
| Jun 15 | Comfort Hotel Chitose | Hokkaido (Chitose) | Business Hotel | 201 |
| May 1 | Tokyu Stay Mercure Hiroshima | Hiroshima | Business Hotel | 182 |
| May 1 | Grids Premium Hotel Morioka | Iwate | Business Hotel | 153 |
| Jun 7 | Hoshino Resorts KAI Kusatsu | Gunma (Kusatsu) | Ryokan | 94 |
| Jun 21 | Omuro Kadensho | Kyoto (Omuro) | Ryokan | 67 |
| Jun 9 | First Step Hotel | Tokyo | Hostel | 8 |
| May 1 | The Villa Kotoshiro | Shimane | Vacation Rental | 1 |
| May 11 | RisoVillage1 | Gifu | Vacation Rental | 1 |
| May 31 | Iyashi-no-Yado Chiyo | Nara | Vacation Rental | 1 |
| Jun 9 | Girasole Kita-Karuizawa | Gunma | Vacation Rental | 1 |
| Jun 20 | Villa Fuso | Tochigi | Vacation Rental | 1 |
Source: MetroEngines Research, compiled by HotelBank Editorial Team (N=13)
Mid-sized and large properties exceeding 100 rooms account for 7 of the 13 openings, totaling 1,069 rooms or 93% of the overall count. Vacation rentals, while comprising 5 of the 13 openings, contribute only 5 rooms in total. This polarization between large-scale and ultra-small properties is the structural hallmark of the May-June opening cluster.
Geographic Distribution: Large Properties Dispersed North-to-South, Vacation Rentals Concentrated Inland
Geographically, the 13 properties span from Naha (Okinawa) in the south to Chitose (Hokkaido) in the north. The large-scale properties exceeding 100 rooms cluster around gateway locations adjacent to major airports and Shinkansen stations. Specifically: South Gate Hotel Okinawa within the Naha Airport access zone, The Gate Hotel Osaka in the Midosuji area, Comfort Hotel Chitose near New Chitose Airport, Tokyu Stay Mercure Hiroshima in the Hiroshima Station area, and Grids Premium Hotel Morioka around Morioka Station.
The chart below aggregates the room counts of the 13 May-June openings by prefecture.
Source: MetroEngines Research, compiled by HotelBank Editorial Team (N=13, MetroEngines Research scope)
Osaka, Okinawa, and Hokkaido each exceed 200 rooms, followed by Hiroshima and Iwate. By contrast, the 5 vacation rentals are distributed across Gunma, Tochigi, Shimane, Gifu, and Nara, all of which are inland tourist destinations or areas with vacation home demand. Geographic distribution alone shows a clear divide: large properties target “inbound gateway cities” while vacation rentals capture “domestic group demand at inland tourist areas.”
Tokyo’s openings are limited to a single hostel (8 rooms), with no large-scale new supply during May-June. This can be read as a reaction to the opening rush that continued in Tokyo from 2025 through early 2026. In fact, MetroEngines Research identifies 33 hotel openings in Tokyo across all of 2026—the second-largest volume nationwide—but the majority is concentrated in January-April and from September onward.
Structural Analysis: What “Mid-Sized Hotels Emerging in Regional Hubs” Means Within 247 Vacation Rentals
Aggregating the 475 openings across all of 2026 by category, vacation rentals account for 247, or 52% of the total. This represents an increased share compared to all of 2025 (661 of 1,601 openings, 41%), indicating that the long-tail distribution of openings is intensifying.
Source: MetroEngines Research, compiled by HotelBank Editorial Team (2026 annual scope, N=475)
Combining small-scale property types—vacation rentals, cottages, glamping, guesthouses, machiya, and minshuku—yields 344 openings, or 72% of the total. By contrast, mid-to-large categories—51 business hotels, 16 city hotels, 19 ryokans, and 20 resort hotels—total only 106 openings, or 22%.
Within this structure, it is notable that 5 of the 13 May-June openings (Tokyu Stay Mercure Hiroshima, Grids Premium Hotel Morioka, Comfort Hotel Chitose, South Gate Hotel Okinawa, and The Gate Hotel Osaka) are mid-to-large properties exceeding 150 rooms. Furthermore, their locations center on “regional hub cities”—Chitose, Morioka, Hiroshima, and Naha—rather than established hotspots like Tokyo or Kyoto.
In other words, while vacation rentals dominate by opening count, in terms of room supply volume, May-June’s market impact centers on mid-sized hotel deployment in regional hub cities. Regional accommodation markets are less mature than Tokyo or Kyoto, so each new property exerts a relatively larger impact on the market overall. The dual-brand format of co-locating Tokyu Stay and Mercure in Hiroshima is drawing attention as a new opening template for mid-sized cities, and the background is analyzed in detail in Tokyu Stay × Mercure Hiroshima: Dual-Brand Strategy. The next section verifies the scale of this supply increase by comparing it against existing ADR levels and property counts.
Existing ADR vs. Supply Increase Ratio: Greater Per-Property Impact in Regional Markets
We compare existing ADR levels in each area against the supply increase from new openings, using data captured by MetroEngines Research. Note that “existing property count” here refers to properties whose selling prices were captured by MetroEngines Research via OTAs and similar channels as of April 2026, and does not match the Japan Tourism Agency’s full census.
| Area | Major Opening | Existing Same-Category Properties | Existing ADR (Apr 2026) |
|---|---|---|---|
| Okinawa / Naha | South Gate Hotel Okinawa (216 rooms) | 13 city hotels | ¥24,100 |
| Osaka / Shinsaibashi | The Gate Hotel Osaka (223 rooms) | 92 city hotels | ¥24,100 |
| Hokkaido / Chitose | Comfort Hotel Chitose (201 rooms) | 393 business hotels | ¥15,600 |
| Hiroshima | Tokyu Stay Mercure Hiroshima (182 rooms) | 176 business hotels | ¥15,700 |
| Iwate / Morioka | Grids Premium Hotel Morioka (153 rooms) | 78 business hotels | ¥14,300 |
| Kyoto / Omuro | Omuro Kadensho (67 rooms) | 162 ryokans | ¥52,600 |
| Gunma / Kusatsu | Hoshino Resorts KAI Kusatsu (94 rooms) | 243 ryokans | ¥32,900 |
Source: MetroEngines Research, compiled by HotelBank Editorial Team (April 2026 aggregation, N=as listed)
Lining up the existing ADRs reveals the price structure across areas. There is a 3.7x gap between Kyoto ryokans (¥52,600) and Iwate business hotels (¥14,300), and Naha city hotels (¥24,100) sit at 57% of Tokyo’s level (¥42,600). It is also notable that business hotel price ranges in Chitose, Hiroshima, and Morioka cluster at remarkably similar levels (¥14,300-¥15,700).
Next, we estimate the “relative impact per property” by dividing new opening room counts by existing property counts. For instance, in Naha’s city hotel segment, a single 216-room large property is added to 13 existing properties. If we assume the existing 13 properties average 100 rooms each, total supply would be approximately 1,300 rooms; adding 216 rooms increases supply by roughly 16%. Applying the same logic, Iwate’s business hotel segment adds 153 rooms to 78 existing properties, with a relative impact far greater than Osaka or Tokyo.
Source: MetroEngines Research, compiled by HotelBank Editorial Team (Assumption: 100 rooms average per existing property)
Osaka’s city hotel market has a large base of 92 existing properties, so adding 223 rooms creates relatively little impact. By contrast, Iwate’s business hotel market is mid-sized with 78 existing properties, where adding 153 rooms boosts supply by approximately 2%. While the actual ratio varies depending on each existing property’s average room count and occupancy, the structural finding that Osaka and Iwate differ by nearly 2x remains broadly robust.
This suggests that in regional cities, each new opening exerts a larger impact on area-wide ADR and occupancy. Particularly in regional hub cities like Morioka and Chitose, the opening pricing strategy immediately following launch may influence area-wide ADR, making it worth observing how existing properties respond on price.
ADR Trends in 4 Major Cities and June Market Conditions: Reading the Timing of Openings
We track monthly ADR trends throughout the year for the major cities seeing May-June openings (Okinawa, Osaka, Hokkaido, Kyoto). The chart below shows monthly ADR trends from January through June 2026.
Source: MetroEngines Research, compiled by HotelBank Editorial Team (Monthly ADR; price per room for double occupancy, tax included)
Kyoto peaks in April (¥50,300) before trending down in May and June, dropping to ¥40,100 by June. Omuro Kadensho’s June 21 opening coincides with Kyoto’s ryokan market approaching its annual bottom. Osaka, on the other hand, peaks in May (¥27,900) and dips slightly to ¥26,400 in June. The Gate Hotel Osaka’s opening date (June 1) lands during a period when the Osaka market remains at relatively high ADR levels for the year.
Hokkaido is in recovery mode from its March-April low season into May-June (¥29,600 → ¥32,200). Comfort Hotel Chitose’s June 15 opening captures the timing of summer demand ramping up. Okinawa similarly sees ADR rise from May to June, and South Gate Hotel Okinawa’s May 23 opening rides the upswing following the post-Golden Week period.
Each operator’s opening timing thus appears to be strategically aligned with the area’s busy/slow calendar. In particular, the launches are designed to coincide with summer demand ramp-up in Hokkaido and Okinawa, and with stable demand periods in Osaka, allowing properties to lock in a certain ADR from the opening month.
Note on Data Source Mixing: This article uses both OTA published price data (selling price basis) and REIT monthly operational data (transaction price basis). Because there are structural level differences between the two, please focus on YoY (year-over-year) change rates rather than direct absolute value comparisons.
Investor Perspective: Reading Supply Impact Against Existing REIT Occupancy
From an investor’s perspective, the principal concern when interpreting May-June openings is the dilution effect new supply has on area occupancy and ADR. For reference, we survey the latest monthly data from major listed hotel REITs.
| REIT | Latest OCC | Latest ADR | Latest RevPAR |
|---|---|---|---|
| Invincible Investment Corporation (8963) | 87.6% | ¥14,500 | ¥12,700 |
| Japan Hotel & Residential REIT (3472) | 86.8% | ¥25,000 | ¥21,200 |
| Ichigo Hotel REIT Investment Corporation (3463) | 86.7% | ¥10,700 | ¥9,200 |
| Japan Hotel REIT Investment Corporation (8985) | 85.1% | ¥20,800 | ¥17,700 |
| Hoshino Resorts REIT (3287) | 76.5% | ¥20,800 | ¥15,900 |
| Kasumigaseki Hotel REIT (401A) | 76.5% | ¥26,300 | ¥20,100 |
| Mori Trust REIT (8961) | 71.1% | ¥31,100 | ¥22,300 |
Source: Each REIT’s monthly operational data, compiled by HotelBank Editorial Team (Latest month varies by company, January-March 2026)
Major REITs broadly maintain occupancy above 85%. Within an environment where hotel REITs are approaching their occupancy peak, new openings inject additional supply into a market that is already near full demand. While new supply tends to be absorbed easily during periods of continuing demand growth, if inbound growth enters a plateau, occupancy dilution pressure may emerge in competitive areas.
The three main takeaways for investors from this May-June opening cluster are as follows.
| Perspective | Key Takeaway |
|---|---|
| Regional Hub Shift | The center of major openings is shifting away from Tokyo and Kyoto toward regional hub cities like Chitose, Morioka, Hiroshima, and Naha. Regional cities have fewer existing properties, so each new property captures a larger share of the area, and first-mover advantage can be established depending on operational capability. |
| Supply Polarization | There is a clean split between 7 large properties exceeding 150 rooms and 6 ultra-small properties of 1-10 rooms. The absence of mid-sized (30-100 rooms) properties suggests the operationally efficient middle layer may be starting to drop out. |
| Opening on Summer Ramp-up | In Hokkaido and Okinawa, openings are timed to coincide with seasonal ADR upticks, making first-year RevPAR easier to secure. By contrast, Kyoto’s Omuro Kadensho launches into the slow season, so evaluating first-year results requires a full year of observation. |
The regional hub shift in particular warrants close attention as a medium-term trend. If the structure of inbound demand—currently concentrated in Tokyo, Kyoto, and Osaka—begins to disperse toward regional hub cities with airport and Shinkansen access, regional ADR levels could be lifted, providing a tailwind for local investors holding existing stock.
Summary: Three Signals from the May-June Opening Cluster
We summarize the principal signals from the May-June 2026 opening cluster (13 properties, 1,149 rooms within MetroEngines Research scope). First, while vacation rentals remain the largest category by opening count, mid-sized business and city hotels overwhelmingly dominate room supply volume—producing a dual structure where the picture seen by count differs greatly from the picture seen by rooms.
Second, the center of large May-June openings has shifted away from Tokyo and Kyoto toward regional hub cities (Chitose, Morioka, Hiroshima, Naha), suggesting a clear pivot from the major-city-hotspot-concentrated roadmap of the past two years. Inbound demand’s dispersion into regional areas and the timing of supply build-out at regional hubs are beginning to converge.
Third, comparison of existing ADR levels and new supply scale confirms a structural pattern in which regional cities experience larger market impact per property. Particularly in mid-sized cities like Iwate and Hiroshima, new openings may influence area-wide ADR formation, making selling price trends 3-6 months post-opening worth close monitoring.
For investors, operators, and existing stockholders alike, it is essential to view the May-June opening rush not merely as a new supply event, but as one phase in the process of Japan’s hotel market center of gravity expanding into regional hub cities. In future reports, once selling price data accumulates for these new openings, we plan to verify the actual impact on existing area ADR using real data. For broader context on how Osaka’s market has responded to demand spikes, see Osaka Expo’s Impact on Hotel ADR: REIT & OTA Data Verification.
Methodology and Notes
The opening hotel data discussed in this article reflects the scope captured by MetroEngines Research based on publicly available information from OTAs and disclosed construction/development information; it is not a comprehensive census conducted by the Japan Tourism Agency or local governments. Notably, small-scale vacation rentals, vacation rental homes, and simplified lodgings that do not sell via OTAs are outside the capture scope. Additionally, “existing property count” in this article refers to the number of properties whose selling prices were captured by MetroEngines Research via OTAs and similar channels as of April 2026, and differs from the Japan Tourism Agency’s accommodation counts (operating-license basis). All price data refers to per-room rates for double occupancy (tax included), and ADR is the monthly average of publicly listed selling prices for properties on sale. Note that this differs from actual transaction unit prices.
External references: Japan Tourism Agency Accommodation Travel Statistics Survey, Japan National Tourism Organization (JNTO) Statistical Data
Note on Future-Date ADR: ADR figures in this article represent the average of selling prices publicly listed on OTAs at the time of survey, and these figures fluctuate as the check-in date approaches. Please note that prices currently set high may decline due to last-minute discounts.