

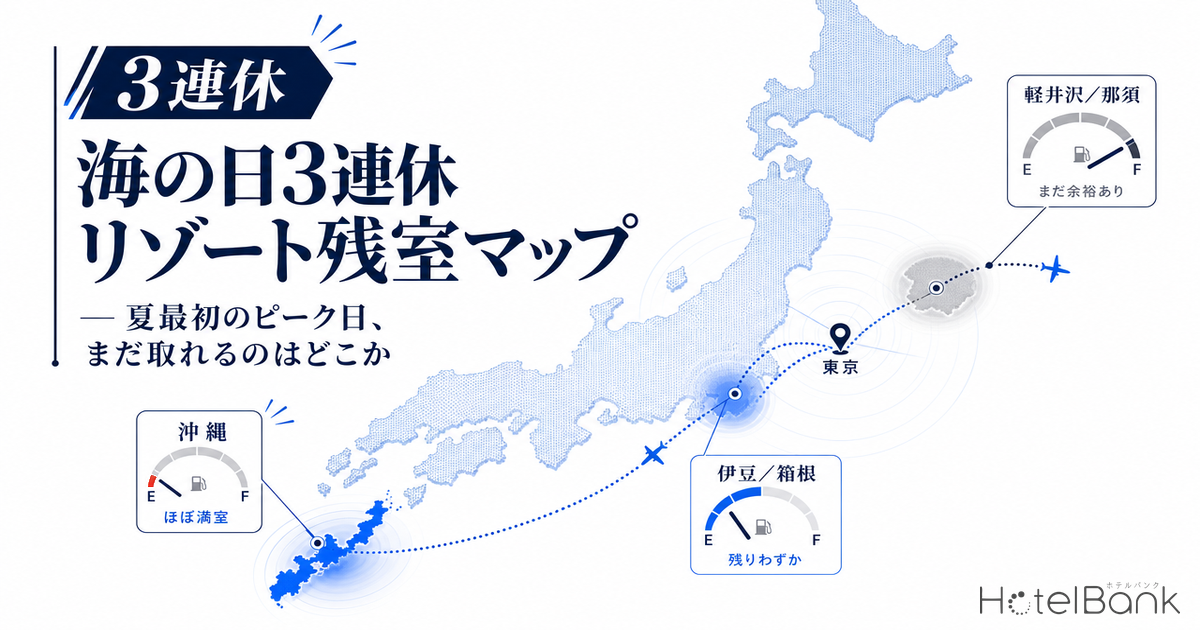
The three-day weekend of July 18 (Sat) to July 20 (Mon), which includes Marine Day on Monday, July 20, 2026, marks “summer’s first peak” ahead of the Obon holidays (August 13–16). Because the standard itinerary is a two-night, three-day trip departing on Saturday and returning on the holiday Monday, lodging demand skews heavily by check-in date. In this article, we aggregate the trend in available-room counts that facilities in major resort areas have published on OTAs and elsewhere, and use a map and supply-demand data to read which areas are tight by check-in date and where vacancies still remain.
Metric Definitions Used in This Article
- Available rooms: The number of vacant rooms published on OTAs and elsewhere at each observation point (room basis). All sold-out / tightness judgments in this article are made on a room basis; we do not use the ratio of plan counts.
- LT (lead time): The number of days until the check-in date. LT0 = same day, LT90 = 90 days prior. A larger value points to an earlier point in time.
- Early sell-out LT: The lead time at which available rooms first reached zero (a larger value indicates an earlier sell-out).
- Availability rate: The share of current available rooms relative to total room count. The lower it is, the more bookings have progressed.
- ADR (average daily rate): The average of selling prices published on OTAs and elsewhere. It differs from actual transaction prices. Per-room rate for double occupancy (tax included), averaged across all plans (from room-only to meals-included).
- Data source: MetroEngines Research (the population consists of facilities that could be confirmed operating on OTAs and that published at least 30% of their total rooms for the target three-day weekend). The aggregation point is mid-June 2026.
- — Demand is concentrated on the first day of the weekend (Sat, 7/18). Marine Day itself (Mon, 7/20) is a check-out day, so vacancies actually remain.
- — The highest share of sold-out facilities is Shimoda (Saturday, 51%), followed by Karuizawa 50%, Hakone 43%, and Nasu 33% — near-field resorts within reach of the Tokyo metropolitan area are tight in a concentrated way.
- — Okinawa is sold out at 15% with a median availability rate of 21.0%. For the three-day weekend alone it is loose, with the peak carried over to Obon (8/13-16).
- — Individual facilities’ inventory trends follow a rhythm of “early sell-out → inventory added → re-absorbed.” Cases are observed where allotments return around LT55 (Kurofune Hotel: 46 rooms added).
- — Okinawa’s ADR is +9.6% year-on-year (N=1,655 facilities). Degree of sell-out and price must be read as separate indicators.
The Three-Day Weekend Is “Saturday-Concentrated” — Marine Day Itself Eases Off
First, let us grasp the overall picture. The check-in demand for this three-day weekend concentrates on the first day, Saturday, July 18. For a two-night, three-day itinerary, the standard pattern is to check in on Saturday and return on Monday, so Monday, July 20 (Marine Day) — being the “final day = check-out day” — sees lodging check-in demand ease off substantially instead. The point that the final day is not crowded simply because it is a national holiday is important for travelers and operators alike.
Across the seven major resort areas analyzed, among the facilities that published at least 30% of their total rooms on OTAs and elsewhere (the area-total population), the share of facilities that reached zero available rooms on a room basis peaked at 51% on Saturday (the 18th), while on Marine Day itself, Monday (the 20th), it remained in the single digits to low-20% range across the board. The chart below shows the “share of sold-out facilities” by check-in date for each area.
Source: created by MetroEngines Research and the HotelBank Editorial Team (only facilities whose OTA-published allotment is 30% or more of total rooms are aggregated)
The tightest area was Shimoda at the southern tip of the Izu Peninsula, where a majority of facilities were sold out on both Saturday and Sunday. It is followed by Karuizawa (Saturday 50%), Hakone (Saturday 43%), and Nasu (Saturday 33%). By contrast, in Okinawa, sold-out facilities stayed at around 15% even on Saturday, and thanks partly to its large supply, it had the most vacancies remaining among the seven areas. On Marine Day itself (the 20th), sold-out facilities dropped sharply in every area, suggesting that demand to extend just one extra night on the final day, or to start moving from Monday, is limited.
Availability Map — “Tight Areas” and “Areas You Can Still Book”
The map below shows the tightness of each resort area by color. The darker (blue) the circle, the higher the share of sold-out facilities on the first day of the weekend (Sat, 7/18); the lighter (gray), the more vacancies remain. The size of the circle represents the scale of the target facility count (the population).
Source: created by MetroEngines Research and the HotelBank Editorial Team
The structure the map reveals is simple. “Drive-to resorts” close to the Tokyo metropolitan area — Izu, Hakone, Nasu, and Karuizawa — have thick Saturday check-in demand, and especially in Shimoda and Karuizawa, where many onsen inns and pensions have small room counts, facilities that fill their allotments early stand out. By contrast, Okinawa, which presupposes air travel, has a somewhat weaker concentration for the three-day weekend alone, and although the beach season has opened, it is still at a stage where it retains its peak demand for the full summer-vacation season (Obon).
| Area | Target facilities |
Median avail. rate |
7/18(Sat) sold out |
7/19(Sun) sold out |
7/20(Mon) sold out |
|---|---|---|---|---|---|
| Shimoda | 65 | 26.7% | 21/41 (51%) | 25/46 (54%) | 11/57 (19%) |
| Karuizawa | 73 | 20.6% | 23/46 (50%) | 19/50 (38%) | 4/64 (6%) |
| Hakone | 117 | 22.4% | 40/94 (43%) | 27/92 (29%) | 11/95 (12%) |
| Nasu | 128 | 33.3% | 33/100 (33%) | 23/107 (21%) | 12/115 (10%) |
| Atami | 107 | 33.3% | 29/90 (32%) | 13/92 (14%) | 17/77 (22%) |
| Ito | 141 | 27.9% | 30/117 (26%) | 21/114 (18%) | 6/126 (5%) |
| Okinawa | 154 | 21.0% | 17/115 (15%) | 16/116 (14%) | 8/137 (6%) |
Source: created by MetroEngines Research and the HotelBank Editorial Team (sold-out facility = a facility that reached zero available rooms on a room basis. The denominator for each day is the number of facilities observed that day)
“How Full” by Availability Rate — Shimoda and Karuizawa Lead
Beyond just the share of sold-out facilities, the median availability rate (the share of vacant rooms relative to total room count) is a clue to how much allotment an area as a whole has absorbed. The lower the value, the more it means the “median facility” within the area is filling up with bookings.
Source: created by MetroEngines Research and the HotelBank Editorial Team
The median availability rate is low for Karuizawa (20.6%) and Okinawa (21.0%), which works out to a majority of facilities in those areas having booked up to nearly 80% of their rooms. Shimoda (26.7%) and Ito (27.9%) follow, while Atami and Nasu (both 33.3%) still have a third of their allotment remaining. Although Okinawa looked loose by “share of sold-out facilities,” its median availability rate is low — this indicates that its large-scale resorts are steadily progressing their absorption overall while distributing and retaining inventory. The number of facilities that reached sold-out (zero available rooms) and an area’s overall degree of absorption need to be read as separate indicators.
Case Study: The “Early Sell-Out → Inventory Added” Rhythm at a Popular Shimoda Inn
Looking at the lead-time availability trend of an individual facility shows that booking absorption on a peak day is not a simple downward slope. Take as an example the July 18 (Sat) check-in at “Shimoda Onsen Kurofune Hotel (黒船ホテル)” (50 rooms), one of the popular onsen inns in Izu-Shimoda. During the aggregation period this facility published up to the equivalent of 92% of its total rooms on OTAs and elsewhere, giving an observation volume sufficient to read supply and demand.
Source: created by MetroEngines Research and the HotelBank Editorial Team (Kurofune Hotel, July 18 check-in, 43 observation points)
Following the trend, available rooms momentarily reached zero at LT74 (74 days before check-in). After that, however, 46 rooms were published at once around LT55, and from there, as the weekend approached, absorption progressed again, recently returning to 8 available rooms (availability rate 16%). The large addition at LT55 is naturally read not as a one-off cancellation but as the facility putting its weekend allotment on the market in earnest at this timing (an inventory release).
This rhythm of “showing fully booked once at an early point → allotment then released → re-absorbed by real demand” is frequently observed at popular inns on peak days. From the traveler’s standpoint, even if “fully booked” is shown tens of days in advance, allotment may return through subsequent inventory additions — meaning it is worth not giving up and re-checking after letting some lead time pass. From the operator’s standpoint, an apparent early sell-out does not necessarily reflect real demand, and the timing of phased inventory release shapes the final absorption curve.
On how to read the availability data in this article: The analysis targets observed inventory values published on OTAs and elsewhere as of the aggregation point (mid-June 2026, about 30–31 days before check-in). As the check-in date approaches, available-room counts rise and fall due to facilities’ additional releases and cancellations. In particular, data from more than 30 days before check-in is “an interim snapshot of an in-progress booking situation,” and even areas or facilities that are currently sold out may see allotment return just before the date. Please note that this is not a definitive final supply-demand result.
Price Is Supplementary — Okinawa’s ADR Is in Positive Territory Year-on-Year
The protagonist of supply and demand is the speed of availability absorption, but price trends deserve a supplementary mention. Based on OTA-published prices, Okinawa Prefecture’s ADR for July 2026 was about ¥33,400, up +9.6% year-on-year (N=1,655 facilities). Although Okinawa’s sold-out concentration for the three-day weekend alone was gentle, its average selling price has trended above the prior year, and summer demand as a whole is firm. In near-field resorts within reach of the Tokyo metropolitan area — Izu, Hakone, Nasu, and Karuizawa — the trend continues for peak-day prices to be set higher than weekdays, as bookings concentrate on Saturday.
That said, the ADR in this article is strictly an average of published selling prices and differs from actual transaction prices (because higher-priced plans that go unsold tend to remain, the average published price is prone to overshooting on a transaction basis). Reading the degree of availability absorption and price separately is the shortcut to correctly grasping peak-day supply and demand.
Summary — Avoid “Near-Field on Saturday” and Options Still Remain
Organizing the supply and demand of the Marine Day three-day weekend, the points come down to three. First, demand is concentrated on the first day, Saturday (7/18), and the holiday Monday (Marine Day) — being a check-out day — has a surprising amount of vacancy remaining. Second, the drive-from-Tokyo destinations of Shimoda, Karuizawa, Hakone, and Nasu have a high share of sold-out facilities on Saturday, so securing a booking early is advisable. Third, fly-to Okinawa still has allotment remaining for this three-day weekend alone, and while prices are in positive territory year-on-year, options remain easy to secure.
And this peak is positioned strictly as “summer’s first peak” heading toward Obon (8/13-16). Areas that were tight on Marine Day are highly likely to fill their allotments at an even earlier stage during the main Obon period. For those targeting an Obon stay, the Marine Day booking situation makes an excellent leading indicator. As a follow-up to this article, we plan to track and analyze availability trends over the Obon period as well.
References & Sources
■ Data Source
MetroEngines Research & Consulting aggregated data (the population consists of facilities that could be confirmed operating on OTAs and that published at least 30% of their total rooms for the target three-day weekend). The aggregation point is mid-June 2026, about 30–31 days before check-in.
■ Estimation Assumptions
Sold-out facility = a facility that reached zero available rooms on a room basis. The denominator for each day is the number of facilities observed that day. The median availability rate is the median of the population facilities within the area (the median is used rather than the mean to suppress the influence of outliers). ADR is based on published prices for double occupancy, averaged across all plans (from room-only to meals-included).
■ Limitations & Caveats
This data reflects observed inventory values as of the aggregation point (mid-June), and available-room counts rise and fall due to facilities’ additional releases and cancellations as the check-in date approaches. Data from more than 30 days before check-in is an interim snapshot of an in-progress booking situation, and even sold-out areas may see allotment return just before the date. ADR is an average of published selling prices and differs from actual transaction prices (it is prone to overshooting due to the influence of unsold higher-priced plans).
- MetroEngines Research — availability trend by check-in date, availability rate, early sell-out LT (7 target areas, aggregated with facilities publishing 30%+ of their OTA allotment as the population, aggregation point mid-June 2026)
- Kinki Nippon Tourist “Recommended Inns for the July 2026 Three-Day Weekend (Marine Day)”
- JTB “Recommended for July Travel! Domestic Travel Feature 2026”
- Rurubu Kids “When Is Marine Day in 2026?”