

The Japan Tourism Agency’s Accommodation Survey (宿泊旅行統計調査) publishes the same month’s figures three times. At the end of the second month following the reference month comes the First Preliminary Estimate, one month after that the Second Preliminary Estimate, and in July of the following year the Final Figures. The figure most often cited in practice is the first one released, yet little published work measures how far it ultimately moves.
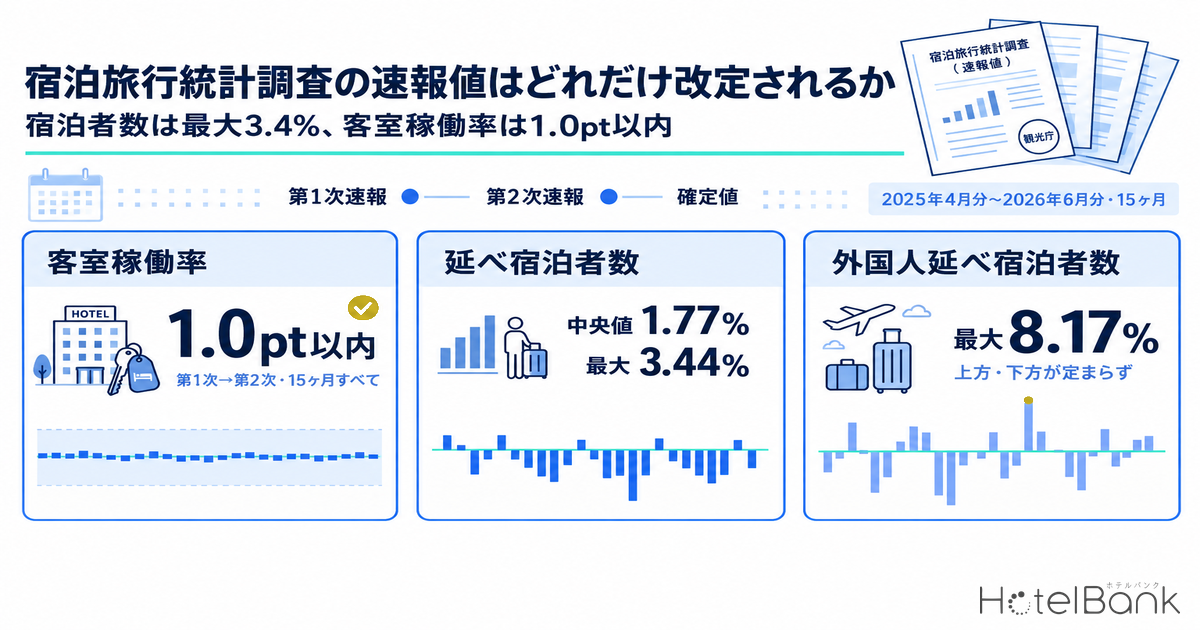
This article compares 15 months of Japan Tourism Agency press releases (April 2025 through June 2026) release by release, and quantifies the revision from the First Preliminary Estimate to the Second, and on to the Final Figures. The conclusion first: total guest nights move by a median of 1.77% and a maximum of 3.44%, while the room occupancy rate stayed within 1.0pt in all 15 months. How much a preliminary figure can be trusted depends entirely on which metric you are reading.
Metric Definitions Used in This Article
- Total guest nights: the estimated figure in the Japan Tourism Agency’s Accommodation Survey. Counted as persons x nights (three people staying two nights = six guest nights).
- Room occupancy rate (JTA): rooms sold divided by total available rooms. Total available rooms is the room count multiplied by the number of days in the month.
- Guest-capacity occupancy rate (JTA): total guest nights divided by total available capacity. Total available capacity is the guest capacity multiplied by the number of days in the month.
- Revision magnitude: in this article, how far a later-published figure moved from an earlier-published one. Total guest nights are expressed in %, room occupancy in points (pt).
- Occupancy rate (OTA listed-inventory basis, estimated): the share of rooms sold against total rooms in an area, estimated from inventory listed for sale on OTAs. This is our own metric, placed alongside the JTA room occupancy rate in Section 8; the definitions differ, so the levels do not match.
- Data sources: Japan Tourism Agency, Accommodation Survey press releases for each release / MetroEngines Research
- — Room occupancy is already near-final at the First Preliminary Estimate.In all 15 months the gap to the Second Preliminary Estimate was within 1.0pt, and the gap to the Final Figures had a median of 0.3pt and a maximum of 0.8pt.
- — Total guest nights move by a median of 1.77% and a maximum of 3.44%.From First to Second Preliminary, 11 of 15 months were revised downward, so the direction is skewed as well.
- — Foreign guest nights swing by as much as 8.17%.The direction is unsettled too, with 7 months revised up and 8 down; reading inbound demand from the First Preliminary Estimate alone can flip the sign.
- — The Second Preliminary Estimate undershoots, and the Final Figures come back.From Second to Final, 8 of 9 months were revised upward (median +1.86%). The net First-to-Final revision has a median of 0.87%, smaller than the first step.
- — The source of revisions is the response-rate gap between strata.At the First Preliminary Estimate the valid response rate had a median of 35.3%; it was 61.1% for properties with 10 or more employees against 39.7% for those with fewer than 10, a gap of 21.4pt.
The Same Month, Published Three Times — How the Release Cycle Works
The Accommodation Survey is monthly, but not every questionnaire comes back by the cut-off. The Japan Tourism Agency therefore publishes staged estimates from the valid responses in hand at each tabulation point, re-tabulating and replacing them as more responses arrive. Taking July 2026 as an example, the release sequence looks like this.
| Release stage | Release timing | July 2026 example | Valid response rate |
|---|---|---|---|
| First Preliminary Estimate | End of the second month after the reference month | Published 31 August 2026 (estimated from responses received by 12 August) | 32.9% |
| Second Preliminary Estimate | About one month after the First Preliminary Estimate | Scheduled for 30 September 2026 | (44.6% for June 2026) |
| Final Figures | Published the following year as part of the annual figures | Summer 2027 (the 2025 figures were published on 6 July 2026) | (52.6% average for calendar 2025) |
Source: compiled by the HotelBank Editorial Team from Japan Tourism Agency, Accommodation Survey press releases for each release
In other words, the First Preliminary Estimate estimates national figures from roughly one third of the questionnaires. The remaining two thirds arrive later and are reflected at the Second Preliminary and Final stages. Revision is an inevitable consequence of that structure — it is the design itself, raising estimation precision in stages. What matters is knowing quantitatively which stage’s figure is fit for which purpose.
Total Guest Nights Move by a Median of 1.77% — 15 Months of First-to-Second Revisions
Start with the revision from the First to the Second Preliminary Estimate. The period covered is the 15 months from April 2025 to June 2026, comparing the national figures carried in each month’s press release. The revision rate for total guest nights (all visitors) was a median of 1.77% and a maximum of 3.44% (September 2025). Eleven months were revised down and four up, a downward skew.
Foreign guest nights swing more widely still. The median revision rate is 3.83%, and the maximum is February 2026 at +8.17%, with direction almost evenly split at 7 months up and 8 down. Inbound stays are heavily concentrated by property type and region, so the estimate moves easily depending on which late-responding properties are added. Reading inbound trends from the First Preliminary Estimate alone can mean the sign reverses the following month.
Source: compiled by the HotelBank Editorial Team from Japan Tourism Agency, Accommodation Survey press releases for each release (N=15 months)
The room occupancy rate, by contrast, is revised very little. Across the 15 months, the First-to-Second revision had a median of 0.4pt and a maximum of 1.0pt (June 2026), with every month inside 1.0pt. Even in months where total guest nights moved on the order of 3%, occupancy moved only 0.3 to 0.9pt.
The reason lies in how the metrics are built. Total guest nights is an estimate of the aggregate volume across all accommodation properties in Japan, so as more questionnaires arrive the numerator simply accumulates. The room occupancy rate divides rooms sold by total available rooms — a ratio — so the numerator and denominator grow together as late responses come in, and the movements largely offset.
Source: compiled by the HotelBank Editorial Team from Japan Tourism Agency, Accommodation Survey press releases for each release (N=15 months)
| Month | First (10k guest-nights) |
Second (10k guest-nights) |
Revision | Foreign revision |
Occupancy First |
Occupancy Second |
Revision | Response rate First → Second |
|---|---|---|---|---|---|---|---|---|
| Apr 2025 | 5,336 | 5,305 | -0.58% | +5.49% | 61.7 | 61.6 | -0.1pt | 34.1% → 51.8% |
| May 2025 | 5,638 | 5,564 | -1.31% | +0.89% | 61.6 | 61.8 | +0.2pt | 33.6% → 50.6% |
| Jun 2025 | 4,921 | 4,945 | +0.49% | +6.65% | 58.7 | 59.0 | +0.3pt | 32.7% → 50.1% |
| Jul 2025 | 5,640 | 5,575 | -1.15% | -1.76% | 61.1 | 61.4 | +0.3pt | 36.5% → 50.1% |
| Aug 2025 | 6,682 | 6,598 | -1.26% | +2.37% | 65.9 | 65.9 | +0.0pt | 40.0% → 48.9% |
| Sep 2025 | 5,499 | 5,310 | -3.44% | -3.46% | 63.6 | 63.2 | -0.4pt | 39.5% → 48.3% |
| Oct 2025 | 6,025 | 5,861 | -2.72% | -4.35% | 67.4 | 67.1 | -0.3pt | 35.7% → 48.2% |
| Nov 2025 | 5,772 | 5,599 | -3.00% | -4.41% | 65.9 | 65.7 | -0.2pt | 38.9% → 47.9% |
| Dec 2025 | 5,342 | 5,359 | +0.32% | +3.83% | 59.1 | 59.7 | +0.6pt | 38.7% → 49.4% |
| Jan 2026 | 4,628 | 4,546 | -1.77% | -2.80% | 53.1 | 52.7 | -0.4pt | 32.7% → 44.9% |
| Feb 2026 | 4,625 | 4,765 | +3.03% | +8.17% | 59.0 | 59.6 | +0.6pt | 35.3% → 46.0% |
| Mar 2026 | 5,546 | 5,441 | -1.89% | -5.31% | 60.3 | 59.4 | -0.9pt | 28.3% → 45.6% |
| Apr 2026 | 5,063 | 4,911 | -3.00% | -2.35% | 59.7 | 59.1 | -0.6pt | 24.2% → 44.7% |
| May 2026 | 5,339 | 5,429 | +1.69% | +4.99% | 60.6 | 61.0 | +0.4pt | 34.5% → 45.9% |
| Jun 2026 | 4,678 | 4,582 | -2.05% | -2.32% | 56.2 | 57.2 | +1.0pt | 36.1% → 44.6% |
Source: compiled by the HotelBank Editorial Team from Japan Tourism Agency, Accommodation Survey press releases for each release
The Second Preliminary Estimate Undershoots and the Final Figures Come Back — Net Revision Across All Three Stages
So far only the single step from First to Second Preliminary has been examined. But with the 2025 Final Figures published on 6 July 2026, all three stages — First Preliminary, Second Preliminary, Final — can now be tracked for 2025. The table below lines up the nine months from April to December 2025.
| Month | First (10k guest-nights) |
Second (10k guest-nights) |
Final (10k guest-nights) |
First → Second |
Second → Final |
First → Final |
Room occupancy First → Second → Final |
Occupancy First → Final |
|---|---|---|---|---|---|---|---|---|
| Apr 2025 | 5,336 | 5,305 | 5,292 | -0.58% | -0.25% | -0.83% | 61.7 → 61.6 → 61.4 | -0.3pt |
| May 2025 | 5,638 | 5,564 | 5,607 | -1.31% | +0.78% | -0.55% | 61.6 → 61.8 → 61.7 | +0.1pt |
| Jun 2025 | 4,921 | 4,945 | 5,004 | +0.49% | +1.20% | +1.69% | 58.7 → 59.0 → 58.8 | +0.1pt |
| Jul 2025 | 5,640 | 5,575 | 5,665 | -1.15% | +1.62% | +0.44% | 61.1 → 61.4 → 61.2 | +0.1pt |
| Aug 2025 | 6,682 | 6,598 | 6,720 | -1.26% | +1.86% | +0.58% | 65.9 → 65.9 → 65.7 | -0.2pt |
| Sep 2025 | 5,499 | 5,310 | 5,424 | -3.44% | +2.14% | -1.37% | 63.6 → 63.2 → 62.8 | -0.8pt |
| Oct 2025 | 6,025 | 5,861 | 5,973 | -2.72% | +1.91% | -0.87% | 67.4 → 67.1 → 66.6 | -0.8pt |
| Nov 2025 | 5,772 | 5,599 | 5,704 | -3.00% | +1.87% | -1.18% | 65.9 → 65.7 → 65.4 | -0.5pt |
| Dec 2025 | 5,342 | 5,359 | 5,499 | +0.32% | +2.61% | +2.93% | 59.1 → 59.7 → 59.5 | +0.4pt |
Source: compiled by the HotelBank Editorial Team from Japan Tourism Agency, Accommodation Survey press releases for each release and the 2025 annual Final Figures (N=9 months)
What this shows is a structure in which the two revisions work in opposite directions. Seven of the nine months were revised down from First to Second (median 1.26%), whereas from Second to Final 8 of 9 months were revised up (median +1.86%). As a result the net revision from First Preliminary to Final has a median of just 0.87% — smaller than the First-to-Second revision (median 1.26%).
Put another way, in many months the Second Preliminary Estimate overshoots to the downside and the Final Figures pull back. September 2025 was revised sharply down from 54.99 million guest nights at the First Preliminary to 53.10 million at the Second (-3.44%), but the Final Figure was 54.24 million — a net -1.37% from the First. Even if you read the First Preliminary Estimate as a sharp drop in demand and the Second appeared to confirm it, the landing point was in between.
Source: compiled by the HotelBank Editorial Team from Japan Tourism Agency, Accommodation Survey press releases for each release and the 2025 annual Final Figures (N=9 months)
Room occupancy is stable here too. The gap between the First Preliminary Estimate and the Final Figures has a median of 0.3pt and a maximum of 0.8pt (September and October 2025). The gap between the Second Preliminary Estimate and the Final Figures has a median of 0.2pt and a maximum of 0.5pt, confirming that for occupancy the first release already lands essentially at its final form.
Source: compiled by the HotelBank Editorial Team from Japan Tourism Agency, Accommodation Survey press releases for each release and the 2025 annual Final Figures
The Same Pattern in Annual Figures — 2024 and 2025 Preliminary vs Final
The same tendency appears in annual figures, not only monthly ones. The Japan Tourism Agency publishes the previous year’s preliminary annual figures each February and the final annual figures around July, and discloses the difference between them itself as a list of changes.
| Year / metric | Preliminary | Final | Revision |
|---|---|---|---|
| 2024 total guest nights (all) | 650.28 million | 659.06 million | +1.35% |
| 2024 of which foreign | 163.60 million | 164.46 million | +0.53% |
| 2024 room occupancy rate (all) | 60.5% | 59.6% | -0.9pt |
| 2025 total guest nights (all) | 653.48 million | 661.11 million | +1.17% |
| 2025 of which foreign | 177.87 million | 179.92 million | +1.15% |
| 2025 room occupancy rate (all) | 61.8% | 61.6% | -0.2pt |
Source: compiled by the HotelBank Editorial Team from Japan Tourism Agency, Accommodation Survey (2024 annual Final Figures) and (2025 annual Final Figures)
In both years the combination is the same: total guest nights revised up, room occupancy revised down. Volume rising while the ratio falls looks contradictory, but it follows naturally from the response-rate structure described below.
Response Rates Are the Source — A 21.4pt Gap Between Large and Small Properties
The mechanism behind revisions becomes clear once you follow the valid response rates the Japan Tourism Agency publishes. Across the 15 months compared here, the valid response rate at the First Preliminary Estimate had a median of 35.3% (minimum 24.2%, maximum 40.0%), and at the Second Preliminary Estimate a median of 48.2% (minimum 44.6%, maximum 51.8%). In the space of a month roughly 13pt more questionnaires are added, and the estimate is replaced to that extent.
Source: compiled by the HotelBank Editorial Team from Japan Tourism Agency, Accommodation Survey press releases for each release (N=15 months)
The decisive point is that response rates differ sharply by property size. Averaging the response rates by size band in the 2025 Final Figures documentation over 12 months, properties with 10 or more employees returned 61.1% against 39.7% for those with fewer than 10 — a gap of 21.4pt. The overall figure was 52.6%.
Source: compiled by the HotelBank Editorial Team from Japan Tourism Agency, Accommodation Survey (2025 annual Final Figures) (N=12 months)
Sample design compounds this. Through the 2025 data the survey stratified by employee count, with properties of 10 or more employees fully enumerated, 5 to 9 employees sampled at one third, and 0 to 4 employees at one ninth. A sampling rate of one ninth means one property’s response carries the weight of nine properties in the national estimate. When small properties, which tend to respond late, arrive together at the Second Preliminary and Final stages, they push the total up with heavy weights attached.
This is how total guest nights can be revised up in the annual figures while room occupancy is revised down at the same time. The small properties joining late add guest nights, but their occupancy levels are low. By property type in the 2025 Final Figures, room occupancy was 75.3% for business hotels and 74.1% for city hotels against 38.2% for ryokan and 29.6% for budget lodgings — so the more weight small properties carry, the more the national average occupancy is pulled down.
One caveat: across these 15 months there was no clear correlation between the level of the response rate at the First Preliminary Estimate and the size of the subsequent revision (correlation coefficient -0.07). A low response rate in a given month does not necessarily mean a large revision. What matters is which stratum of properties responded late, so the response rate alone cannot predict the size of the revision.
From January 2026 the Stratification Switches to Room Count — A Precision Revision
From the January 2026 survey the Japan Tourism Agency changed the stratification criterion from employee count to room count. The agency explains the purpose as “to conduct a survey with higher statistical precision,” specifically replacing five employee-count bands with six room-count bands, with properties of 20 or more rooms fully enumerated and those under 20 rooms sampled. Sampling rates for the sampled strata also moved from a nationwide employee-count basis to settings defined per prefecture.
In practical terms, room count expresses supply scale more directly than employee count does. Employee count varies by property depending on part-time ratios and management-contract structures, whereas room count does not. Aligning the stratification variable with supply volume itself should improve the stability of the estimates. The trade-off is that year-on-year comparisons spanning the change carry a discontinuity that is a matter of survey design rather than demand.
The population of properties was built using the same method as before, and as of January 2026 stood at roughly 76,000 properties, of which the surveyed population is roughly 23,000 properties. The 2025 Final Figures documentation records a confirmed register of 74,590 properties, with 20,395 to 22,347 properties surveyed per month.
Stratification change and year-on-year comparisons: The Japan Tourism Agency states explicitly in its press releases that “year-on-year ratios and differences may include the effects of the revision.” From January 2026 onward, year-on-year comparisons can mix actual demand change with the effect of the design change. Where a judgement rests on a year-on-year figure, that note should be taken as a given.
36 of 47 Prefectures Revised Up — Ibaraki +6.25%, Kyoto -2.39%
Revision magnitude can be checked by prefecture as well as nationally. The preliminary 2025 annual figures published on 27 February 2026 were compared against the Final Figures published on 6 July 2026 across all 47 prefectures. For total guest nights the revision was up in 36 prefectures and down in 11, with a median absolute revision of 1.23%. More than half of prefectures move more than the national figure of +1.17%.
The largest upward revision was Ibaraki (+6.25%), where a preliminary 6.84 million guest nights became a final 7.27 million. Fukuoka (+5.41%), Okinawa (+4.87%) and Toyama (+4.80%) followed. The largest downward revision was Kyoto (-2.39%), followed by Saitama (-2.07%) and Kanagawa (-1.53%).
Source: compiled by the HotelBank Editorial Team from Japan Tourism Agency, Accommodation Survey (2025 annual preliminary figures / 2025 annual Final Figures) (N=47 prefectures)
| Prefecture | Preliminary (guest-nights) | Final (guest-nights) | Revision | Room occupancy | Revision |
|---|---|---|---|---|---|
| Ibaraki | 6,841,440 | 7,269,120 | +6.25% | 54.0 → 54.1 | +0.1pt |
| Fukuoka | 24,175,890 | 25,483,210 | +5.41% | 72.6 → 72.1 | -0.5pt |
| Okinawa | 32,288,990 | 33,862,060 | +4.87% | 60.0 → 60.3 | +0.3pt |
| Toyama | 3,748,560 | 3,928,440 | +4.80% | 55.3 → 55.5 | +0.2pt |
| Nagasaki | 7,383,830 | 7,657,250 | +3.70% | 55.9 → 56.3 | +0.4pt |
| Tottori | 2,489,690 | 2,571,870 | +3.30% | 51.9 → 52.2 | +0.3pt |
| Yamanashi | 9,685,330 | 9,935,970 | +2.59% | 44.7 → 43.8 | -0.9pt |
| Shimane | 3,344,990 | 3,428,130 | +2.49% | 54.7 → 54.2 | -0.5pt |
| Shiga | 4,718,070 | 4,833,790 | +2.45% | 53.8 → 53.2 | -0.6pt |
| Hokkaido | 45,434,840 | 46,503,620 | +2.35% | 61.2 → 61.2 | +0.0pt |
| Prefecture | Preliminary (guest-nights) | Final (guest-nights) | Revision | Room occupancy | Revision |
|---|---|---|---|---|---|
| Aichi | 22,801,460 | 22,750,670 | -0.22% | 69.2 → 69.2 | +0.0pt |
| Hiroshima | 11,705,950 | 11,631,520 | -0.64% | 64.7 → 64.4 | -0.3pt |
| Iwate | 5,588,130 | 5,551,600 | -0.65% | 55.1 → 54.9 | -0.2pt |
| Miyagi | 10,493,490 | 10,417,370 | -0.73% | 59.5 → 60.2 | +0.7pt |
| Aomori | 5,125,880 | 5,077,310 | -0.95% | 61.4 → 61.1 | -0.3pt |
| Oita | 8,232,770 | 8,128,890 | -1.26% | 53.6 → 54.4 | +0.8pt |
| Ishikawa | 9,653,310 | 9,516,310 | -1.42% | 58.2 → 57.1 | -1.1pt |
| Kanagawa | 27,212,050 | 26,794,990 | -1.53% | 66.0 → 66.2 | +0.2pt |
| Saitama | 5,517,670 | 5,403,310 | -2.07% | 65.7 → 66.7 | +1.0pt |
| Kyoto | 33,968,650 | 33,157,290 | -2.39% | 66.7 → 66.8 | +0.1pt |
Source: compiled by the HotelBank Editorial Team from Japan Tourism Agency, Accommodation Survey (2025 annual preliminary figures / 2025 annual Final Figures)
Here too the difference between metrics is clear. The revision in room occupancy by prefecture had a median of -0.1pt, with the largest being Nara at -1.3pt — all 47 prefectures within 1.3pt. Twenty were revised up, 24 down and 3 unchanged, close to symmetric. Even in a prefecture where total guest nights move 6%, occupancy moves only about 0.1pt.
The size of the revision is easier to read alongside the composition of a prefecture’s accommodation supply. The greater the weight of small properties subject to sampling, the more heavily the late-arriving questionnaires count. Conversely, in urban areas where large hotels dominate supply, the preliminary stage tends to come out close to the final level already.
Room Occupancy, Guest-Capacity Occupancy, and the Scope of the Population
Two definitions are worth settling before reading revision magnitudes. The first is the two occupancy series. The Japan Tourism Agency’s room occupancy rate divides rooms sold by total available rooms (room count x days), while the guest-capacity occupancy rate divides total guest nights by total available capacity (guest capacity x days). The Accommodation Survey publishes both as statistical tables; the one that headlines the monthly press release is the room occupancy rate.
The two move differently even within the same month. If two people share a room, room occupancy advances by one room while guest-capacity occupancy advances by two people. Ryokan and resorts with high occupancy per room tend to show relatively higher guest-capacity occupancy, while the reverse holds for business hotels dominated by single rooms.
The second is the scope of the population. The Accommodation Survey’s register is built by the Japan Tourism Agency from the Establishment Frame Database (Ministry of Internal Affairs and Communications) defined in Article 27 of the Statistics Act, with adjustments applied, and covers hotels, ryokan and budget lodgings plus company and organisation lodging facilities. Its population therefore does not match the count of properties licensed under the Hotel Business Act administered by each local government. Comparing the two property counts and arguing about the difference does not work in the first place.
Properties with fewer than 10 employees were also added to the survey from the second quarter of 2010, so the population differs from earlier series. Drawing a long time series requires a note on any comparison that spans that expansion. The Japan Tourism Agency itself carries the history of that expansion in the Final Figures documentation under “points to note when using these results.”
Public Statistics Next to a Private Estimate — Levels 17.7pt Apart, Direction Agreeing in 7 of 8 Prefectures
Once the revision magnitude is understood, the practical question is what to look at while waiting for publication. Here the Japan Tourism Agency’s room occupancy rate is placed alongside the occupancy rate MetroEngines Research estimates from inventory listed on major booking sites, for the same month and the same prefecture. The scope is May and June 2026 across eight prefectures.
To emphasise first: the two are defined differently, so the levels do not match. The Japan Tourism Agency’s room occupancy rate is an actual figure with the total room count of all accommodation properties as its denominator, whereas our estimate is based on how inventory offered on OTAs sells through, which is not the same as a property’s overall occupancy. Rooms held for direct bookings, groups or corporate contracts are not in the denominator, so the estimate comes out structurally higher.
Source: Japan Tourism Agency, Accommodation Survey press releases for each release (Second Preliminary Estimate) / MetroEngines Research (N=16 points, 8 prefectures x 2 months)
In practice the level gap across the 16 points has a median of +17.7pt (minimum +11.0pt, maximum +29.8pt), and the size of the gap varies by prefecture as well. The correlation of the levels themselves is only 0.70, so the absolute figure cannot be used as a substitute metric.
On the other hand, the direction of change from the previous month lines up well. Comparing the change from May 2026 to June 2026, the sign agreed in 7 of 8 prefectures (correlation coefficient 0.92). Tokyo was -2.5pt on the Japan Tourism Agency figure and -2.5pt on our estimate; Kyoto -10.3pt against -8.1pt; Hokkaido +8.3pt against +6.6pt. The only split was Okinawa, at -1.6pt on the Japan Tourism Agency figure against +1.5pt on our estimate.
| Prefecture | JTA room occupancy | Change | Occupancy (listed-inventory basis, estimated) | Change | Direction | Estimation scope (June 2026) |
|---|---|---|---|---|---|---|
| Tokyo | 77.9% → 75.4% | -2.5pt | 93.0% → 90.5% | -2.5pt | Agrees | 780 properties / 103,314 rooms |
| Osaka | 72.8% → 65.3% | -7.5pt | 83.8% → 77.6% | -6.2pt | Agrees | 405 properties / 59,272 rooms |
| Kyoto | 72.0% → 61.7% | -10.3pt | 89.9% → 81.8% | -8.1pt | Agrees | 540 properties / 31,355 rooms |
| Hokkaido | 55.1% → 63.4% | +8.3pt | 79.1% → 85.7% | +6.6pt | Agrees | 664 properties / 52,439 rooms |
| Okinawa | 56.7% → 55.1% | -1.6pt | 83.4% → 84.9% | +1.5pt | Differs | 702 properties / 35,277 rooms |
| Fukuoka | 71.7% → 70.3% | -1.4pt | 88.4% → 87.8% | -0.6pt | Agrees | 381 properties / 28,992 rooms |
| Aichi | 65.8% → 61.7% | -4.1pt | 82.6% → 79.6% | -3.0pt | Agrees | 328 properties / 33,663 rooms |
| Kanagawa | 66.1% → 64.4% | -1.7pt | 85.5% → 80.2% | -5.3pt | Agrees | 390 properties / 30,735 rooms |
Source: Japan Tourism Agency, Accommodation Survey (May 2026 Second Preliminary Estimate / June 2026 Second Preliminary Estimate) / MetroEngines Research (major booking site listing basis)
The practical implication is simple: levels from public statistics, direction and timing from private data. The Japan Tourism Agency’s First Preliminary Estimate lands at the end of the second month after the reference month — July demand, for instance, is known on 31 August. To read the market’s direction earlier than that, a listed-inventory estimate can work as a leading indicator, but its level cannot be mixed with the Japan Tourism Agency’s figures. The same logic applies wherever a public series and a private estimate are read side by side: treat the gap between two differently defined occupancy series as the stable part, and use its movement rather than its level to project where a month will land.
Five Working Rules for Using Preliminary Figures
Translated into day-to-day decisions, the measured results above come down to the following five points.
Before the five points, it helps to restate the measured results as “how much range to allow for once a preliminary figure is in hand.” The observed ranges in the table below are the minimum and maximum across the full period compared in this article. They do not guarantee future revision magnitudes, but they give a basis for attaching a range to a document.
| Metric | Interval | N | Median revision (absolute) |
Observed range | Directional skew |
|---|---|---|---|---|---|
| Total guest nights (all) | First → Second | 15 months | 1.77% | -3.44% to +3.03% | Down 11 / 15 |
| Total guest nights (all) | First → Final | 9 months | 0.87% | -1.37% to +2.93% | Down 5 / 9 |
| Foreign guest nights | First → Second | 15 months | 3.83% | -5.31% to +8.17% | Down 8 / 15 |
| Room occupancy rate | First → Second | 15 months | 0.4pt | -0.9pt to +1.0pt | Down 7 / 15 |
| Room occupancy rate | First → Final | 9 months | 0.3pt | -0.8pt to +0.4pt | Down 5 / 9 |
| Total guest nights (by prefecture, annual) | Preliminary → Final | 47 prefectures | 1.23% | -2.39% to +6.25% | Down 11 / 47 |
Source: compiled by the HotelBank Editorial Team from Japan Tourism Agency, Accommodation Survey press releases for each release and the 2025 annual Final Figures (monthly N=15 months / three-stage tracking N=9 months / by prefecture N=47)
| Rule | Measured evidence |
|---|---|
| 1. Room occupancy can be used at the First Preliminary Estimate | The gap from First Preliminary to Final has a median of 0.3pt and a maximum of 0.8pt (April to December 2025). Even First to Second stayed within 1.0pt in all 15 months. There is no need to wait for a later release to speak to the level of occupancy. |
| 2. Allow a range of plus or minus 3% on total guest nights | The First-to-Second revision rate has a median of 1.77% and a maximum of 3.44%. A small difference such as “+2% year on year” can flip sign at the next release. Always state the release stage in any document. |
| 3. Allow an even wider range for foreign guest nights | The revision rate for foreign guest nights has a median of 3.83% and a maximum of 8.17% (February 2026). The direction is unsettled too, at 7 months up and 8 down. Monthly judgements on inbound demand are safer from the Second Preliminary Estimate onward. |
| 4. Do not treat the Second Preliminary Estimate as final | From Second to Final, 8 of 9 months were revised up (median +1.86%). The Second Preliminary Estimate often stays undershooting and comes back at the Final Figures, so it can sit further from the truth than the net First-to-Final revision (median 0.87%). |
| 5. Prefecture figures move more than the national figure | In the 2025 preliminary-to-final revision, 36 of 47 prefectures were revised up, with a median absolute revision of 1.23% and a maximum of 6.25% (Ibaraki). If an investment decision or a plan rests on an annual figure for a single prefecture, either wait for the Final Figures (around July of the following year) or carry a range. |
Source: compiled by the HotelBank Editorial Team from Japan Tourism Agency, Accommodation Survey press releases for each release
There is also a caveat about where the data is taken from. The Accommodation Survey statistical tables held in the database edition of the government statistics portal (e-Stat) stopped being updated with the 2016 data (Table 8, room occupancy rate, and all 32 tables cover the survey period 201601 to 201612). Pulling the latest values from the database edition means picking up an old series, so recent figures have to be read directly from the press releases and tabulated results on the Japan Tourism Agency website.
Note also that because this survey includes a sample component, its estimates carry standard errors. The Japan Tourism Agency publishes standard error rates for major items alongside the tabulated results, so the precision of a published figure can be checked from the publication itself.
Conclusion — Each Metric Has Its Own Stage Worth Waiting For
What 15 months of comparison show is that the preliminary figures of the Accommodation Survey have completely different stability depending on the metric. Room occupancy is effectively final at the First Preliminary Estimate, staying within 1.0pt. Total guest nights move by a median of 1.77% and a maximum of 3.44%, and narrowing to foreign guest nights, by up to 8.17%. Annual figures by prefecture move by up to 6.25%.
That difference follows inevitably from the survey design. The response rate at the First Preliminary Estimate has a median of 35.3%, with a 21.4pt gap between properties with 10 or more employees and those with fewer. A metric that accumulates volume moves as late questionnaires arrive; a ratio whose numerator and denominator grow together does not. Understanding the mechanism makes it possible to judge in advance which figure is usable when.
From January 2026 the stratification criterion switched to room count, and the stability of the estimates should improve further. For the time being, though, year-on-year comparisons can carry the effect of the design change, so as the Japan Tourism Agency’s own note says, a year-on-year figure should not stand as the sole basis for a judgement. Use a preliminary figure as a preliminary figure, and check the answer against the Final Figures. That is how to work with Japan’s accommodation statistics.
Related Reading
References and Sources
■ Data sources
Revision magnitudes were calculated from the national and prefecture-level figures carried in 16 Japan Tourism Agency Accommodation Survey press releases (from the release covering March 2025 to the release covering July 2026). The monthly First and Second Preliminary Estimates come from each release; the annual figures (preliminary and final) come from the releases of 27 February 2026 and 6 July 2026. The occupancy rate (OTA listed-inventory basis, estimated) placed alongside them in Section 8 is an estimate MetroEngines Research calculates from inventory listed on major booking sites, covering May and June 2026 for eight prefectures (Tokyo, Osaka, Kyoto, Hokkaido, Okinawa, Fukuoka, Aichi and Kanagawa; 16 points in total).
■ Calculation assumptions
Revision magnitude was calculated by subtracting the earlier-published figure from the later-published one. Total guest nights are expressed as a revision rate (%), room occupancy in points (pt). “Median” always refers to the median of the absolute revision, with upward and downward cases recorded separately as direction. Observed ranges are the minimum and maximum actually observed, not interval estimates. First and Second Preliminary Estimates were matched for the same reference month, with no comparison across release rounds. The level gap and correlation for occupancy were calculated over 16 points matching the Japan Tourism Agency’s room occupancy rate (Second Preliminary Estimate) against our estimate for the same month and prefecture.
■ Limitations and caveats
The scope is 15 months for First-to-Second, 9 months for three-stage tracking and a single year (2025) by prefecture — all limited sample sizes. The observed ranges in this article do not guarantee future revision magnitudes. The Accommodation Survey is also an estimate that includes a sample component, so published figures themselves carry standard errors. From the January 2026 survey the stratification criterion changed from employee count to room count, so comparisons spanning that change may include the effect of the design revision. Our estimate placed alongside in Section 8 uses inventory listed on OTAs as its denominator, and differs from the Japan Tourism Agency’s room occupancy rate in both population and definition, so the levels cannot be compared directly.
■ Japan Tourism Agency press releases (each release compared in this article)
- Accommodation Survey (July 2026 First Preliminary Estimate, June 2026 Second Preliminary Estimate) (31 August 2026)
- Accommodation Survey (May 2026 Second Preliminary Estimate, June 2026 First Preliminary Estimate)
- Accommodation Survey (April 2026 Second Preliminary Estimate, May 2026 First Preliminary Estimate, and 2025 annual Final Figures) (6 July 2026)
- Accommodation Survey (March 2026 Second Preliminary Estimate, April 2026 First Preliminary Estimate)
- Accommodation Survey (February 2026 Second Preliminary Estimate, March 2026 First Preliminary Estimate)
- Accommodation Survey (January 2026 Second Preliminary Estimate, February 2026 First Preliminary Estimate)
- Accommodation Survey (December 2025 Second Preliminary Estimate, January 2026 First Preliminary Estimate) and 2025 annual preliminary figures (27 February 2026)
- Accommodation Survey (November 2025 Second Preliminary Estimate, December 2025 First Preliminary Estimate)
- Accommodation Survey (October 2025 Second Preliminary Estimate, November 2025 First Preliminary Estimate)
- Accommodation Survey (September 2025 Second Preliminary Estimate, October 2025 First Preliminary Estimate)
- Accommodation Survey (August 2025 Second Preliminary Estimate, September 2025 First Preliminary Estimate)
- Accommodation Survey (July 2025 Second Preliminary Estimate, August 2025 First Preliminary Estimate)
- Accommodation Survey (June 2025 Second Preliminary Estimate, July 2025 First Preliminary Estimate)
- [Partially corrected] Accommodation Survey (May 2025 Second Preliminary Estimate, June 2025 First Preliminary Estimate)
- [Partially corrected] Accommodation Survey (April 2025 Second Preliminary Estimate, May 2025 First Preliminary Estimate) and 2024 annual Final Figures
- Accommodation Survey (March 2025 Second Preliminary Estimate, April 2025 First Preliminary Estimate)
■ Japan Tourism Agency survey outline and statistical tables
- Japan Tourism Agency, Accommodation Survey (statistics top page and survey outline)
- Japan Tourism Agency, Accommodation Survey (2025 annual Final Figures), PDF
- Japan Tourism Agency, On the changes accompanying the revision of the stratification criteria for the Accommodation Survey (from the January 2026 survey), PDF
- Japan Tourism Agency, Past Second Preliminary Estimates
- e-Stat, Accommodation Survey Table 8 Room Occupancy Rate (database edition, covering data through 2016)
■ Private data
- MetroEngines Research — occupancy rate (OTA listed-inventory basis, estimated). May and June 2026, eight prefectures (major booking site listing basis)