

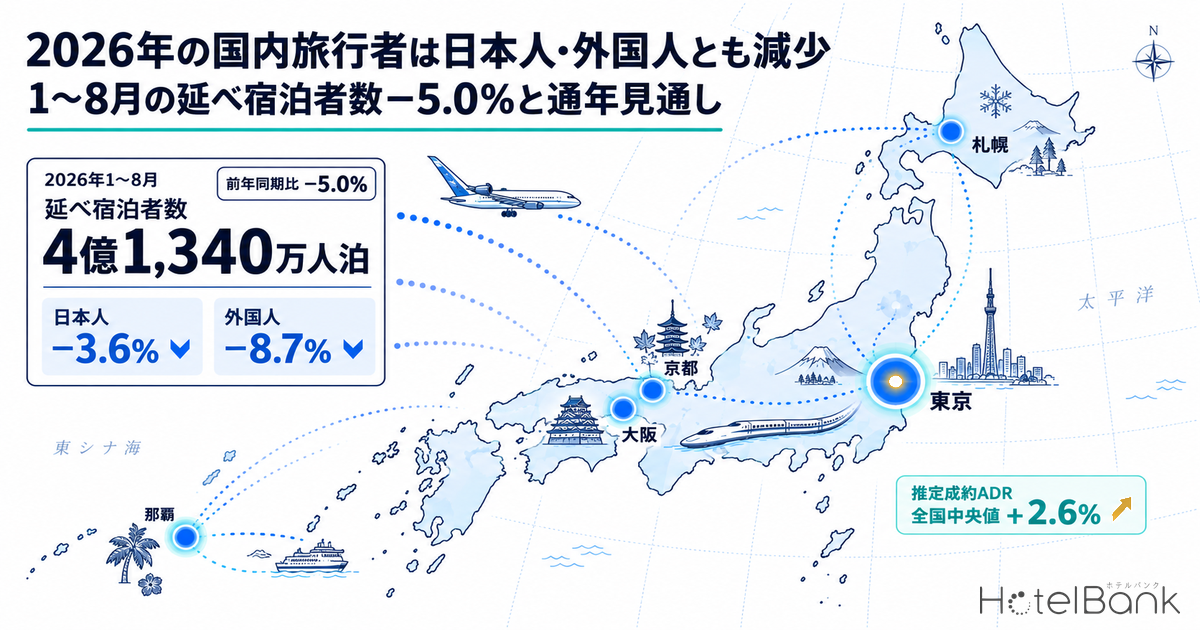
Adding up the Japan Tourism Agency (JTA) Overnight Travel Statistics released on September 30, 2026 (July 2026 second preliminary figures and August 2026 first preliminary figures), Japan’s total guest nights for January–August 2026 came to 413.4 million, down 5.0% year on year. Japanese guests accounted for 304.2 million guest nights (−3.6%) and foreign guests for 109.2 million (−8.7%), meaning both pillars of the market — domestic stays by Japanese residents and stays by inbound visitors — are running below last year. 2025 was a record year, with foreign guest nights reaching 179.92 million, and 2026 is likely to be remembered as the year the “volume” phase turned. This article organizes the published figures from the JTA, JNTO and JTB without mixing official statistics with estimates, examines how the rise and fall in demand has shown up in room rates using the estimated settled ADR we track, and presents a full-year 2026 outlook as an upper and lower range.
Metric Definitions Used in This Article
- Guest nights and visitor arrivals: Published figures from the JTA “Overnight Travel Statistics Survey” and JNTO “Visitor Arrivals Statistics”, used as released. January–July 2026 are second preliminary figures and August is a first preliminary figure (subject to revision in the second preliminary release scheduled for October 30, 2026). 2025 figures are final (released July 6, 2026). From the January 2026 survey, the JTA changed its stratification basis from “number of employees” to “number of guest rooms”, and notes that year-on-year comparisons may include the effect of this change.
- ADR (Average Daily Rate): An estimated settled rate (tax-excluded equivalent) calculated by applying property-type correction factors to the lowest published plan level on OTAs (per room, two adults sharing, tax included). Compared against property-level results disclosed by listed hotel REITs (91 properties, most recent 3 months), the median error is about 7%. These are estimates and differ from each property’s actual transaction prices and accounting figures. Area-level ADR is the median of covered properties (the level of a typical property in the area). “Nationwide” is the median of the estimated settled ADR across the 47 prefectures (our own aggregation).
- Listed price (all-plan average, tax included): The average price of all plans published on OTAs, per room for two adults sharing (tax included). This is not a transaction price.
- Distinguishing estimates: Except for figures explicitly labeled “our estimate”, all figures are published values from public agencies or companies.
- Data sources: Japan Tourism Agency, JNTO, JTB, Japan Travel and Tourism Association (JTBF), MetroEngines Research
- — Total guest nights for January–August 2026 were 413.4 million (−5.0% YoY). Japanese guests 304.2 million (−3.6%) and foreign guests 109.2 million (−8.7%) — both segments fell below last year (JTA; August is a first preliminary figure).
- — Visitor arrivals −2.7%, foreign guest nights −8.7%. China fell 56.7% for January–August cumulative, and gains from South Korea (+21.2%) and Taiwan (+19.8%) have not been enough to fill the gap in guest nights.
- — Traveler-side statistics point in a different direction. In April–June 2026, Japanese domestic trips rose 3.3% and spending per trip rose 8.2%, suggesting a behavioral shift toward fewer nights but higher spending per trip.
- — The nationwide median estimated settled ADR averaged ¥9,500 for January–September (+2.6%). Okinawa +13.4%, Hokkaido +5.1%, Tokyo +1.8%, Kyoto −1.0%; Osaka −22.6% on the post-Expo rebound.
- — Full-year 2026 is projected at 624–639 million guest nights (−5.7% to −3.3%, our estimate). Even the upper case falls short of 2024 (659.06 million).
January–August 2026 Guest Nights — Japanese −3.6%, Foreign −8.7%: Both Engines Slow
Start with the monthly trend. Total guest nights in 2026 began with 45.46 million in January (−6.5% YoY), narrowed their decline in February (−0.7%) and March (−2.2%), then widened again to −7.2% in April and −8.4% in June. August, the peak summer month, came in at 62.68 million (−6.7%), about 4.5 million below last year’s 67.2 million. Splitting Japanese and foreign guests, Japanese stays declined only modestly in January–March (−1.5% to −2.3%), but the declines were larger in months containing long holidays or summer vacation: April (−5.5%), June (−6.3%) and August (−5.8%). Foreign stays, by contrast, opened with a sharp −15.8% drop in January and were below last year in every month except February (+1.8%).
The foreign share has shifted as well. Foreign guests accounted for 31.3% of guest nights in January 2025 but only 28.2% in January 2026. In August, partly reflecting the seasonal swelling of Japanese summer stays, the share was 20.2% (21.0% a year earlier). The cumulative January–August foreign share was 26.4% (27.5% a year earlier), a decline of just over 1pt. Accommodation guest mix has tilted back toward Japanese guests compared with 2025, but since Japanese stays are also below last year, the overall picture is one in which both engines have slowed.
Source: Prepared by HotelBank Editorial Team from JTA “Overnight Travel Statistics Survey” (January–July 2026 second preliminary, August first preliminary, 2025 final figures)
| Month | Total (10k guest nights) | YoY | Japanese (10k guest nights) | YoY | Foreign (10k guest nights) | YoY | Foreign share |
|---|---|---|---|---|---|---|---|
| Jan | 4,546 | −6.5% | 3,263 | −2.3% | 1,283 | −15.8% | 28.2% |
| Feb | 4,765 | −0.7% | 3,362 | −1.6% | 1,404 | +1.8% | 29.5% |
| Mar | 5,441 | −2.2% | 4,013 | −1.5% | 1,428 | −3.9% | 26.2% |
| Apr | 4,911 | −7.2% | 3,374 | −5.5% | 1,536 | −10.8% | 31.3% |
| May | 5,429 | −3.2% | 3,978 | −0.9% | 1,451 | −9.0% | 26.7% |
| Jun | 4,582 | −8.4% | 3,360 | −6.3% | 1,222 | −14.0% | 26.7% |
| Jul | 5,397 | −4.7% | 4,066 | −4.1% | 1,331 | −6.5% | 24.7% |
| Aug (1st preliminary) | 6,268 | −6.7% | 5,004 | −5.8% | 1,264 | −10.3% | 20.2% |
| Jan–Aug cumulative | 41,340 | −5.0% | 30,420 | −3.6% | 10,920 | −8.7% | 26.4% |
Source: Prepared by HotelBank Editorial Team from JTA “Overnight Travel Statistics Survey”. August is a first preliminary figure (valid response rate 36.5%), January–July are second preliminary figures, and prior-year figures are final
As the JTA itself notes, the stratification basis changed from employee count to guest room count starting with the January 2026 survey, so year-on-year comparisons may include the effect of that revision. Month-to-month differences of 1–2pt should therefore not be over-interpreted. That said, the direction itself — Japanese stays below last year in all eight months and foreign stays below in seven of eight — is hard to explain by the change in sample design alone.
By region, foreign guest nights in July (second preliminary) fell 9.2% in the three major metropolitan areas versus only 0.9% in regional areas, so the decline is concentrated in the metro areas. Total guest nights fell 10.7% in Tokyo, 14.9% in Osaka, 9.6% in Hokkaido and 10.3% in Okinawa — major destinations all showing declines of around double digits — while several regional prefectures, led by Japanese stays, came in above last year, including Ibaraki (+23.3%), Ehime (+36.6%), Kochi (+28.0%) and Toyama (+19.7%). The share of regional areas outside the three major metro areas rose 1.9pt year on year to 58.4%. The structure of regional dispersion by prefecture is covered in detail in Domestic Demand H1 2026: Tottori & Ibaraki +27.7%, Kochi OCC +7.2pt, so this article focuses on the nationwide aggregate.
Compared with 2025 Final Figures — What Happens the Year After a Record
The 2025 final figures (released July 6, 2026), which serve as the comparison baseline, were 661.11 million total guest nights (+0.3% YoY, +10.9% vs. 2019), 481.18 million for Japanese guests (−2.7%, +0.2% vs. 2019) and 179.92 million for foreign guests (+9.4%, +55.6% vs. 2019). In other words, 2025 was a year in which growth in foreign stays outweighed the decline in Japanese stays and nudged the total slightly upward. In 2026 that structure has broken down: with the foreign-side growth gone, the overall decline shows through in full.
Source: Prepared by HotelBank Editorial Team from JTA “Overnight Travel Statistics Survey” (2025 final figures, January–July 2026 second preliminary, August first preliminary)
The question here is how to read “domestic travel demand in 2025”. According to the 2025 annual figures of the JTA “Travel and Tourism Consumption Trend Survey” (final, released April 30, 2026), Japanese domestic travel spending was ¥26.7845 trillion (+6.5% YoY), Japanese domestic trips totaled 553.13 million (+2.4%), and spending per person per trip was ¥48,424 (+3.9%). From the traveler side, domestic travel in 2025 grew in both volume and spending, whereas from the accommodation side the Overnight Travel Statistics show Japanese guest nights down 2.7%. Part of the gap can be explained by more day trips, shorter stays, and overnight stays that do not use commercial lodging, such as visits home or staying with friends — neither statistic is wrong. For accommodation operators, the figure that matters is the accommodation-side number: guest nights in the Overnight Travel Statistics.
Inbound Progress Through January–August Visitor Arrivals — South Korea and Taiwan Cannot Fill China’s −56.7%
Looking at the foreign slowdown from the arrivals side, JNTO’s visitor arrivals (August 2026 estimate, released September 16) were 3,098,900 in August (−9.6% YoY), bringing the January–August cumulative total to 27,626,300 (−2.7%). This is a reversal from the record 42,683,301 (+15.8%) for full-year 2025. By market, China fell by more than half to 2,904,600 for January–August cumulative (−56.7%); reports cite as background the Chinese government’s call for its citizens to refrain from travel to Japan following the deterioration in Japan–China relations from November 2025 onward. Flights to and from China on the summer schedule were cut by more than 50% year on year.
In contrast, South Korea rose to 7,420,300 (+21.2%), Taiwan to 5,402,000 (+19.8%) and Hong Kong to 1,818,300 (+8.7%), and JNTO announced that 14 markets, including South Korea, Malaysia and Mexico, set August records. On an arrivals basis, other markets nearly offset China’s decline, holding the total to −2.7%, but on a guest-night basis the decline is a much larger −8.7%. Visitors from China tend to stay longer on average and are more likely to stay in metro-area hotels, so their decline hits guest nights harder than headcount. Moreover, visitors from South Korea and Taiwan mostly make short stays, so rising arrivals do not translate proportionally into guest nights. This “gap between headcount and guest nights” is the key to reading foreign stays in 2026. Breaking guest nights down into nights per visitor would show how much of the divergence is explained by the shift in nationality mix, with long-staying Chinese visitors replaced by short-staying Korean and Taiwanese visitors.
| Market | Jan–Aug 2026 cumulative (persons) | YoY | Full-year 2025 (persons) |
|---|---|---|---|
| Total | 27,626,300 | −2.7% | 42,683,301 |
| South Korea | 7,420,300 | +21.2% | 9,459,711 |
| Taiwan | 5,402,000 | +19.8% | 6,763,424 |
| China | 2,904,600 | −56.7% | 9,095,931 |
| Hong Kong | 1,818,300 | +8.7% | 2,517,399 |
Source: Prepared by HotelBank Editorial Team from JNTO “Visitor Arrivals Statistics” (August 2026 estimate, 2025 final figures)
Domestic Travel Appetite in 2026 — JTB Outlook and JTBF Survey Point to “Lower Volume, Higher Spend”
For the outlook on Japanese demand, we cite published figures from companies and research institutes as released. In its “2026 Travel Trend Outlook” announced on January 8, 2026, JTB forecast 307 million Japanese domestic travelers (97.8% of the prior year), domestic travel spending per person of ¥52,900 (102.9%), and total domestic travel spending of ¥16.23 trillion (100.6%). It projected 41.4 million inbound visitors (97.2%). In its summer vacation outlook (July 15–August 31) announced on July 2, JTB expected 69 million domestic travelers (95.6%) with average spending of ¥48,500 (103.2%). Its survey found that 30.6% of respondents said they “will travel / will probably travel”, down 3.6pt from the prior year, while 41.8% said they “want to reduce travel spending over the next year”, rising for the third consecutive year. The top reasons for not traveling were “crowds” (29.2%) and “no room in the household budget” (26.3%).
The Japan Travel and Tourism Association’s “Annual Report on Travel 2025” (based on the JTBF Travel Attitude Survey) likewise reports that the top barriers among people who did not travel in 2024 were “could not take time off due to work, etc.” (27.6%), “household budget constraints” (25.2%) and “just never got around to traveling” (24.7%), and notes a sharp rise in the share selecting “travel products, accommodation or transport were expensive”. The most desired trip types were “hot spring trips” (53.9%), “nature sightseeing” (47.4%) and “gourmet” (45.2%), in that order.
The same pattern appears in actual results. In the JTA “Travel and Tourism Consumption Trend Survey”, January–March 2026 (second preliminary) showed 121.0 million Japanese domestic trips (+0.9% YoY) with spending per trip of ¥49,441 (+5.1%), and April–June (first preliminary) showed 149.58 million trips (+3.3%), spending per trip of ¥50,381 (+8.2%) and total spending of ¥7.5361 trillion (+11.7%) — headcount roughly flat while spending per trip and total spending grew. In the same quarters, the Overnight Travel Statistics show Japanese guest nights down 1.8% in January–March and 4.1% in April–June, so the traveler-side and accommodation-side statistics do not move in the same direction. Because the stratification change mentioned above also plays a role, we cannot be definitive, but it is reasonable to infer a behavioral shift sitting between the two statistics: travelers are keeping the number of trips but limiting nights, while spending more per trip. JTB’s “lower volume, higher spend” outlook is at least consistent with the published first-half figures.
How Demand Shifts Showed Up in Rates — Estimated Settled ADR in Major Areas (January–September 2026)
From here we use our own data to examine how the demand slowdown has shown up in room rates. Of the roughly 27,000 properties tracked by MetroEngines Research with confirmed operations, we took the property types eligible for estimated settled ADR (business, city, resort, ryokan and capsule), defined the median across the 47 prefectures as “Nationwide”, and compared it with five areas: Tokyo, Osaka, Kyoto, Hokkaido and Okinawa. The survey date is October 10, 2026, and the target months are January–September 2026, for which results are settled.
Source: Prepared by HotelBank Editorial Team from MetroEngines Research (estimated settled ADR, YoY. Nationwide = median of 47 prefectures; properties covered as of September 2026: Nationwide 17,136, Tokyo 1,139, Osaka 655, Kyoto 604, Hokkaido 960, Okinawa 515)
| Area | Est. settled ADR, Jan–Sep 2025 avg. | Jan–Sep 2026 avg. | YoY | Listed price 2025 | 2026 | YoY | Properties covered (Sep 2026) |
|---|---|---|---|---|---|---|---|
| Nationwide (median of 47 prefectures) | ¥9,278 | ¥9,517 | +2.6% | ¥22,454 | ¥24,270 | +8.1% | 17,136 |
| Tokyo | ¥13,769 | ¥14,011 | +1.8% | ¥24,335 | ¥24,560 | +0.9% | 1,139 |
| Osaka | ¥11,963 | ¥9,261 | −22.6% | ¥19,746 | ¥16,569 | −16.1% | 655 |
| Kyoto | ¥15,251 | ¥15,091 | −1.0% | ¥31,365 | ¥32,628 | +4.0% | 604 |
| Hokkaido | ¥9,853 | ¥10,359 | +5.1% | ¥23,823 | ¥25,337 | +6.4% | 960 |
| Okinawa | ¥10,847 | ¥12,300 | +13.4% | ¥23,790 | ¥26,435 | +11.1% | 515 |
Source: Prepared by HotelBank Editorial Team from MetroEngines Research. Estimated settled ADR is a tax-excluded-equivalent estimate; listed price is the all-plan average (tax included). Monthly medians averaged arithmetically over January–September
At the nationwide median, estimated settled ADR averaged ¥9,500 for January–September 2026, up 2.6% year on year. Even as guest nights run around −5%, rates have held, and listed prices (all-plan average) have been even stronger at +8.1%. The pattern was positive YoY in January–May, below last year at −2.9% to −5.6% in June–August, and back to +4.9% in September — so rate weakness coincided with June and August, the months with the largest declines in guest nights. The demand slowdown can be summarized as follows: prices held in the first half, the weakness spilled over into rates in summer, and rates recovered again in early autumn.
Differences by area are large. Okinawa averaged ¥12,300 for January–September (+13.4%), above last year in every month and up 31.0% in February. Hokkaido was also positive at ¥10,400 (+5.1%), rising in every month except August, including +26.5% in January. Both areas saw guest nights fall about 10% year on year in July (Hokkaido −9.6%, Okinawa −10.3%), yet on the rate side they are clearly offsetting lower volume with higher prices. Tokyo was at ¥14,000 (+1.8%): solid at +4% to +10% in January–May, below last year at −3.9% to −9.2% in June–August, then back to +1.9% in September. Kyoto was nearly flat at ¥15,100 (−1.0%), with spring and September offsetting weakness in June–August.
Osaka is a different story. Its estimated settled ADR averaged ¥9,300 for January–September (−22.6%), running at −22% to −33% every month since April. This is the rebound from Expo 2025 Osaka, Kansai, held April–October 2025, which pushed rates up sharply; the prior-year comparison base was itself unusual. Osaka’s estimated settled ADR ran at ¥11,900–¥13,800 in April–September 2025, versus ¥8,100–¥10,300 in the same period of 2026 — better read as a return to levels close to pre-Expo January–March 2025 (¥9,000–¥10,400). Osaka Prefecture’s guest nights in July were down 14.9% (Japanese −18.1%), so the market is past the Expo-year peak in both volume and rates. For Osaka in the year after the Expo, reading the YoY change alongside the change versus two years earlier gives a more accurate picture than YoY alone.
Full-Year 2026 Landing Range — Our Estimate
The following is our estimate, starting from the JTA’s published figures (January–August 2026) and extending the remaining September–December period under two assumptions. The lower bound assumes “September–December YoY deteriorates a further 2pt from the cumulative January–August YoY”, and the upper bound assumes “September–December returns to prior-year levels”. These are not actual official statistics, so please do not treat them on the same footing as final or preliminary figures.
| Segment | Full-year 2025 (final) | Jan–Aug 2026 cumulative (published) | Full-year 2026 range (our estimate) | YoY range (our estimate) |
|---|---|---|---|---|
| Japanese guest nights | 481.18 million | 304.2 million (−3.6%) | 461–470 million | −4.3% to −2.4% |
| Foreign guest nights | 179.92 million | 109.2 million (−8.7%) | 163–170 million | −9.4% to −5.8% |
| Total | 661.11 million | 413.4 million (−5.0%) | 624–639 million | −5.7% to −3.3% |
Source: Estimated by HotelBank Editorial Team starting from published JTA “Overnight Travel Statistics Survey” figures (as of October 10, 2026). September–December 2025 actuals use final figures
Even in the upper case, the total is 639 million guest nights (−3.3%), below 2024 (659.06 million). Foreign guest nights reach 170 million in the upper case — above the 2024 actual (164.46 million) but short of the 2025 record. Japanese guest nights land at 461–470 million, likely making 2026 a year below the 2019 level (the 2025 final figure of 481.18 million Japanese guest nights was +0.2% vs. 2019). Against JTB’s start-of-year outlook of 97.8% for domestic travelers and 97.2% for inbound visitors, actual guest-night results are tracking weaker on both counts.
Factors that could move the range include, first, the Chinese market. If the travel advisory is lifted or eased, foreign stays would move toward the upper bound, but with summer 2026 airline seat capacity cut by more than half, a recovery within the year is likely to be limited. Second, the August data is a first preliminary figure (valid response rate 36.5%) and will be revised in the second preliminary release on October 30. July’s figures moved as the response rate rose from 32.9% in the first preliminary to 45.1% in the second, and August has similar room for revision. Third, Japanese stays in December, which includes the year-end and New Year holidays, are sensitive to the calendar; in 2026, December 26 falls on a Saturday, making a nine-day break easy to take, which is an upside factor.
Implications for Operators and Investors — Read 2026 Through Rates Rather Than Volume, and Regions Rather Than Metro Areas
The fact that the nationwide median estimated settled ADR is above last year even in a year when guest nights fall around 5% indicates that the 2026 accommodation market is in a “volume adjustment phase”, not a “price collapse phase”. For operators, a strategy of holding rates and waiting for occupancy to recover is, at least at the nationwide level, more consistent with the data than cutting rates to fill rooms. The JTA’s August 2026 occupancy rate (first preliminary) was 64.4% overall (−1.3pt YoY), 72.3% for city hotels (−3.0pt), 75.7% for business hotels (−0.7pt) and 47.4% for ryokan (+1.7pt). The improvement at ryokan aligns with the hot-spring- and nature-oriented domestic travel appetite (53.9% for “hot spring trips” in the JTBF survey).
From an area-selection perspective, two facts matter: the decline in foreign stays is concentrated in the three major metro areas (July −9.2% versus −0.9% in regional areas), and Japanese stays are above last year in many regional prefectures. Metro-area hotels will see results swing with the timing of China’s recovery, while regional areas, supported by short-distance Japanese travel and short-stay demand from South Korea and Taiwan, are showing relatively stable trends. For investment decisions, two views are both tenable: treating 2026 metro-area figures as the “bottom” and looking for acquisition opportunities, or assuming a structural change in the Chinese market and shifting allocation toward regional areas and areas where rates keep rising, such as Okinawa and Hokkaido. Either way, Osaka’s YoY change against the 2025 Expo year should not be treated on par with other areas.
Finally, a word on how to read the statistics themselves. 2026 is the first year of the stratification change in the Overnight Travel Statistics, so YoY comparisons may include the effect of the design change. With the traveler-side consumption survey and the accommodation-side Overnight Travel Statistics pointing in different directions, it is risky to talk about “domestic travel demand” based on either one alone. We placed both statistics side by side with our rate data because only by cross-checking volume, rates and traveler behavior does the full picture of 2026 come into three-dimensional view: “trip frequency maintained, nights restrained, spending per trip up, and inbound down as other markets fail to fill China’s gap.”
Frequently Asked Questions
Q. Which is declining in 2026 domestic travel — Japanese or foreign travelers?
A. According to the JTA Overnight Travel Statistics, January–August 2026 guest nights were 304.2 million for Japanese guests (−3.6% YoY) and 109.2 million for foreign guests (−8.7%), both below last year. The decline is larger for foreign guests, driven mainly by fewer visitors from China.
Q. What did domestic travel demand look like in 2025?
A. Traveler-side statistics (JTA “Travel and Tourism Consumption Trend Survey”, final) show growth, with 553.13 million Japanese domestic trips (+2.4%) and spending of ¥26.7845 trillion (+6.5%). Accommodation-side statistics (Overnight Travel Statistics), however, show 481.18 million Japanese guest nights (−2.7%), with 179.92 million foreign guest nights (+9.4%) supporting the total.
Q. Which surveys show domestic travel appetite for 2026?
A. JTB’s “2026 Travel Trend Outlook” (announced January 8) and its summer vacation travel trends (announced July 2), as well as the JTBF Travel Attitude Survey included in the Japan Travel and Tourism Association’s “Annual Report on Travel 2025”, are publicly available. All of them point to a slight decline in traveler numbers, rising spending per person, and travel restraint due to household budget constraints.
Summary
Japan’s total guest nights for January–August 2026 were 413.4 million (−5.0% YoY), with both Japanese (−3.6%) and foreign (−8.7%) stays below last year. On the foreign side, the gap between visitor arrivals (−2.7% cumulative for January–August) and guest nights (−8.7%) is large, as the 56.7% drop in the long-staying Chinese market weighs heavily on guest nights. On the Japanese side, traveler-side statistics show growth in both headcount and spending, suggesting a behavioral shift toward fewer nights and higher spending per trip. On rates, the nationwide median estimated settled ADR held at +2.6% for the January–September average, led by Okinawa (+13.4%) and Hokkaido (+5.1%), while Osaka fell 22.6% on the post-Expo rebound. Full-year 2026 is projected by our estimate at 624–639 million total guest nights (−5.7% to −3.3%), a year best described as one where volume adjustment and rate resilience coexist.
Related Reading
References and Sources
■ Data Sources
Guest nights and occupancy rates are from the JTA “Overnight Travel Statistics Survey” (January–July 2026 second preliminary, August first preliminary, 2025 final); traveler-side headcount and spending from the JTA “Travel and Tourism Consumption Trend Survey”; visitor arrivals from JNTO “Visitor Arrivals Statistics”; and travel appetite from published figures by JTB Corp. and the Japan Travel and Tourism Association. Rates are estimated settled ADR and listed prices aggregated by MetroEngines Research (47 prefectures, January 2025–September 2026, survey date October 10, 2026; nationwide properties covered in September 2026: 17,136).
■ Estimation Assumptions
The full-year 2026 landing range is our estimate. January–August uses JTA published figures, and September–December is extended by applying a YoY rate to the same period’s 2025 final actuals. The upper bound assumes September–December flat with the prior year (±0%), and the lower bound assumes a further 2pt deterioration from the cumulative January–August YoY (Japanese −5.6%, foreign −10.7%); the total is the sum of Japanese and foreign guest nights.
■ Limitations and Caveats
August 2026 is a first preliminary figure and may be revised in the second preliminary and final releases. The stratification basis changed from the January 2026 survey, and YoY comparisons may include its effect. Estimated settled ADR is an estimate and differs from each property’s actual transaction prices. “Nationwide” is the median of 47 prefectures, not a room-weighted national average. Osaka’s YoY change is a comparison with the Expo year.
- Japan Tourism Agency “Overnight Travel Statistics Survey” (August 2026 first preliminary, July 2026 second preliminary, 2025 annual final figures) (Japanese)
- Japan Tourism Agency “Overnight Travel Statistics Survey (August 2026 first preliminary, July 2026 second preliminary)” press release (September 30, 2026) (Japanese)
- Japan Tourism Agency “Overnight Travel Statistics Survey (2025 annual, final)” press release (July 6, 2026) (Japanese)
- Japan Tourism Agency “Travel and Tourism Consumption Trend Survey, January–March 2026 (second preliminary)” (July 31, 2026) (Japanese)
- Japan Tourism Agency “Travel and Tourism Consumption Trend Survey, April–June 2026 (first preliminary)” (August 19, 2026) (Japanese)
- Japanese domestic travel spending reached ¥26.7845 trillion in 2025 (JTA final) — Travel Voice (April 30, 2026) (Japanese)
- JNTO “Visitor Arrivals (August 2026 estimate)” (September 16, 2026) (Japanese)
- JNTO “Visitor Arrivals Statistics” by nationality/month (2003–2026) (Japanese)
- Japanese domestic travelers forecast to fall below prior year to 307 million in 2026 — JTB forecast (Travel Voice, January 8, 2026) (Japanese)
- JTB Corp. “2026 Summer Vacation (July 15–August 31) Travel Trends” (July 2, 2026) (Japanese)
- Japan Travel and Tourism Association “Annual Report on Travel 2025”, I-4 “Japanese Attitudes Toward Travel” (JTBF Travel Attitude Survey) (Japanese)
- August visitor arrivals down 9.6% to 3.1 million — JNTO: China down 60% (nippon.com, September 2026) (Japanese)
- Report on summer 2026 flight cuts on China routes (Honichi Lab, August 19, 2026) (Japanese)
- MetroEngines Research — Estimated settled ADR and listed prices (47 prefectures, January 2025–September 2026; nationwide properties covered as of September 2026: 17,136)