

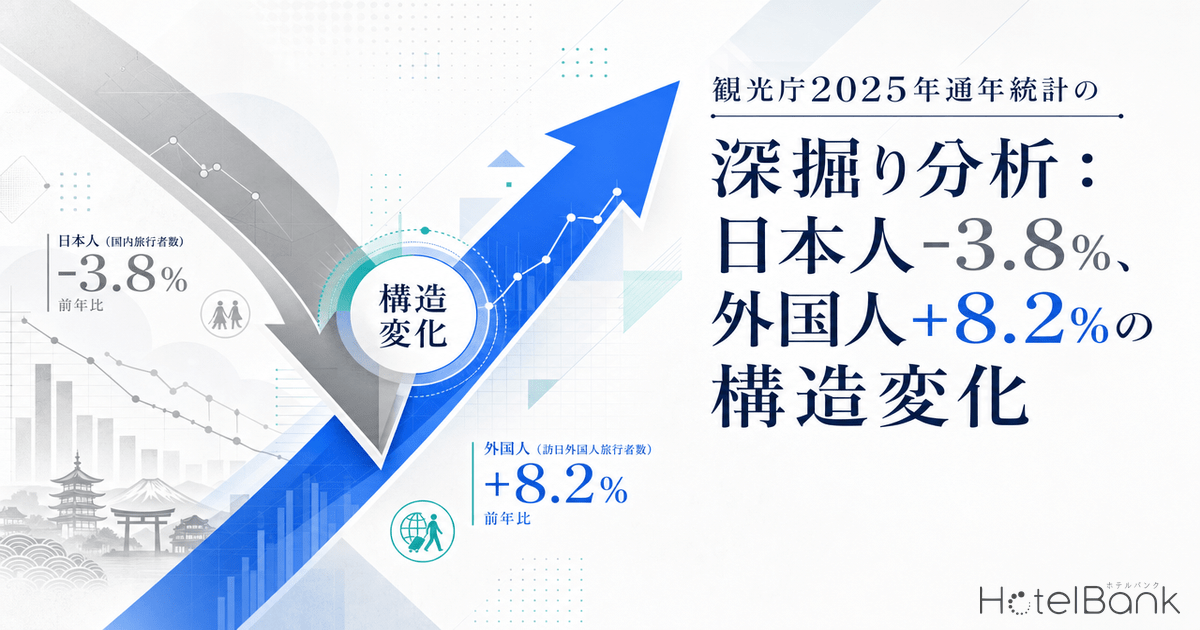
The Japan Tourism Agency’s “Overnight Travel Statistics Survey: Annual 2025 (Preliminary)” released on February 27, 2026 may at first glance look like a modest, slightly negative result for the industry as a whole. Total overnight stays totaled 653.48 million person-nights, down 0.8% year-on-year. However, the breakdown reveals a tectonic shift within the industry. Japanese overnight stays fell 3.8% YoY—a second consecutive year of decline—while foreign overnight stays rose 8.2% YoY, hitting a new all-time high. This article cross-references the survey’s micro-level data with the operating results of major hotel REITs to quantitatively dissect what the structural shift of “modest overall decline but rising foreign and falling Japanese demand” actually means at the operational frontline.
Metric Definitions Used in This Article
- ADR (Average Daily Rate): Average of advertised prices published on OTAs. Differs from actual transaction prices. Per-room rate for double occupancy (tax included), averaged across all plans (room-only through plans with meals).
- Data Source: MetroEngines Research
1. The 2025 Annual Headline: Japanese -3.8%, Foreign +8.2%, Foreign Share at Record 27.2%
First, let us establish the overall picture. Total overnight stays in 2025 came to 653.48 million person-nights, a slight 0.8% YoY decline. While this looks like a flat number on the surface, the breakdown changes the entire narrative. Japanese overnight stays clearly contracted to 475.61 million person-nights (-3.8% YoY), while foreign overnight stays reached 177.87 million person-nights (+8.2% YoY), setting a new record high. In other words, 2025 can be defined as “the year in which foreign demand partially offset the decline in Japanese demand.”
The foreign share of total overnight stays reached 27.2%, well above the 19.4% recorded in 2019 and 19.1% in 2023. This means we have entered an era in which more than one in four guests checking into hotels and ryokans nationwide is a foreign visitor. This structural change is not simply a continuation of the inbound recovery—it is occurring simultaneously with a clear retreat in Japanese demand, and that diagonal movement deserves particular attention.
Source: HotelBank Editorial Team based on Japan Tourism Agency “Overnight Travel Statistics Survey,” 2025 Annual Preliminary Values
2. Prefecture-Level Drilldown: Tokyo Japanese -12.0%, Okinawa Foreign +25.2%
Behind the national average lies considerable temperature differences across prefectures. Tokyo stands out particularly: Japanese overnight stays fell 12.0% YoY, a double-digit decline. Foreign overnight stays in Tokyo rose only marginally at +4.9%, leaving the overall total at -3.3%. In short, Tokyo can fairly be characterized as “a city where domestic Japanese demand has rapidly evaporated.” The backdrop includes elevated room rates and price aversion among domestic travelers.
By contrast, Hokkaido recorded foreign growth of +24.3% (double-digit) against Japanese -4.9%, securing an overall +1.8% gain. Okinawa registered Japanese -3.0% and foreign +25.2%, totaling +3.2%. The contrast between “regions where foreign demand more than offset the Japanese decline” and “metropolitan areas where it could not” is stark. Kyoto saw Japanese demand fall -11.9%, the second-largest drop after Tokyo, but foreign demand at +10.7% kept the overall total at -0.7%.
Notably, the prefectures with the largest YoY foreign growth were unexpectedly regional ones: Tottori (+68.0%), Niigata (+55.3%), and Mie (+54.3%). The Japan Tourism Agency itself reports that the three major metropolitan areas grew only +4.9% while regional areas grew +15.5%, confirming that the geographic dispersion of inbound demand is accelerating.
| Prefecture | Total YoY | Japanese YoY | Foreign YoY | Foreign Share |
|---|---|---|---|---|
| Tokyo | -3.3% | -12.0% | +4.9% | 55.9% |
| Osaka | +0.3% | +4.2% | -4.7% | 42.0% |
| Kyoto | -0.7% | -11.9% | +10.7% | 55.2% |
| Hokkaido | +1.8% | -4.9% | +24.3% | 28.2% |
| Okinawa | +3.2% | -3.0% | +25.2% | 26.9% |
| Fukuoka | +0.9% | -1.8% | +7.1% | 32.7% |
| Nagano | -5.8% | -7.3% | +4.9% | 13.0% |
| Ishikawa | -16.0% | -19.8% | +0.1% | 22.8% |
| National | -0.8% | -3.8% | +8.2% | 27.2% |
Source: HotelBank Editorial Team based on Japan Tourism Agency “Overnight Travel Statistics Survey,” 2025 Annual Preliminary Values
Source: HotelBank Editorial Team based on Japan Tourism Agency “Overnight Travel Statistics Survey,” 2025 Annual Preliminary Values
3. Monthly Trends: Every Month Negative in H2 2025—Seasonal Peak Structure Has Shifted
Comparing 2024 and 2025 monthly data side by side, 2025 shows two distinct faces in its first and second halves. The first half (Jan-Jun) opened strongly with January at +7.4%, but from February onward, growth oscillated in a -1.6% to +2.3% band. The problem appears in the second half: from July onward, every month turned negative YoY, with the deterioration becoming stark in September -3.6%, November -3.7%, and December -4.2%.
The main driver of this downward trend is the deceleration in Japanese overnight stays. Japanese demand was negative or flat throughout the year, and during the six months from July to December it ranged from -1.5% to -5.0%. Foreign overnight stays, meanwhile, posted strong growth of +14.5% to +35.2% in H1, but in H2 sharply decelerated to +1.3% to +3.8%. This reflects the high-base effect from the prior year (2024). The absolute level of inbound demand remains high, but the growth rate has clearly entered a slowdown phase.
August 2025 came in at -0.4% overall, with Japanese -1.5% and foreign +3.8%, exposing the weakness of Japanese demand even during the summer holiday season. A negative Japanese figure in August—which includes the Obon holiday period—is a significant signal of erosion in the breadth of domestic travel demand.
Source: HotelBank Editorial Team based on Japan Tourism Agency “Overnight Travel Statistics Survey,” 2024-2025 monthly data
4. Occupancy by Facility Type: Business Hotels 75.3% vs Ryokans 38.4%—A Bipolar Market
Next, let us examine the operational reality through occupancy rates. The annual 2025 room occupancy rate was 61.8% nationally, an improvement of +2.2pt YoY, but the contrast across facility types remains substantial. Business hotels at 75.3% (+1.6pt YoY) and city hotels at 74.2% (+1.9pt) maintained high occupancy, while ryokans stalled at 38.4% (+2.3pt), still below 40%. Resort hotels stood at 56.9% (+2.8pt) and simple lodgings at 29.6% (+0.6pt).
Notably, Osaka maintained the top national position in overall occupancy at 78.8%. Osaka’s business hotel occupancy was 83.0% and city hotel occupancy 79.4%—essentially full capacity. Even with the rebound effect from the 2025 Osaka-Kansai Expo looming, supply-demand remains tight. By contrast, regional prefectures with tourist and hot spring destinations such as Nagano (39.9%), Yamanashi (44.7%), and Niigata (46.4%) continue to operate below the national average.
What this indicates is a widening occupancy gap between “urban business hotels and city hotels with channels capable of capturing inbound demand” and “regional ryokans and resorts dependent on domestic travel demand.” Ryokan occupancy was 39.6% in 2019 and stands at 38.4% in 2025—no improvement after six years. This is not simply a demand recovery story but must be understood as a structural problem.
Source: HotelBank Editorial Team based on Japan Tourism Agency “Overnight Travel Statistics Survey,” 2025 Annual Preliminary Values
Note on data source switching: This article uses both OTA-published price data (advertised price basis) and REIT monthly operating data (transaction price basis). Because the two have a structural level difference, please focus on YoY (year-over-year) rate of change rather than direct comparison of absolute values.
5. Operational Reality through Hotel REIT Data: 85%+ Occupancy and Diverging Pricing Strategies
From here, we use the monthly operating results of listed hotel REITs to examine the operational reality at higher resolution. We cover seven REITs: Ichigo Hotel REIT (3463), Invincible Investment (8963), Nippon Hotel & Residential Investment (3472), Japan Hotel REIT (8985), Hoshino Resorts REIT (3287), Mori Trust Hotel REIT (8961), and Kasumigaseki Hotel REIT (401A).
As of February 2026, occupancy rates were Nippon Hotel & Residential 86.8%, Ichigo Hotel REIT 86.7%, Invincible 86.6%, and Japan Hotel REIT 85.2%—all four REITs centered on business hotel/midscale segments maintained occupancy above 85%. Conversely, the resort/luxury-leaning Hoshino Resorts REIT and Kasumigaseki Hotel REIT both came in at 76.5%, while Mori Trust Hotel REIT, with a high share of large resort properties, was at 71.1%.
However, the ranking flips on ADR. Mori Trust Hotel REIT was at ¥31,102, Kasumigaseki Hotel REIT ¥26,304, Nippon Hotel & Residential ¥25,001, and Hoshino Resorts REIT ¥20,771—the rate advantage of resort/luxury operators is unmistakable. By contrast, the business hotel-focused Ichigo Hotel REIT was at ¥10,650 and Invincible at ¥13,473. On a RevPAR basis, Mori Trust Hotel REIT (¥22,339), Nippon Hotel & Residential (¥21,239), and Kasumigaseki Hotel REIT (¥20,100) form the top group, demonstrating that rate-led strategies translate directly into RevPAR leadership.
The key implication is that segments with high foreign-guest ratios still have room for ADR upside, while segments with high domestic-guest ratios must prioritize occupancy maintenance as the primary strategy. Japan Hotel REIT (8985) is forecasting RevPAR growth of +8.9% YoY for the full year ending December 2025 and projects distributions per unit at the highest level since listing.
Source: HotelBank Editorial Team based on monthly REIT operating data
6. Why Are Japanese Travelers Declining: The Triple Pressure of Prices, Wages, and Demographics
The decline in Japanese overnight stays is not a single-year accident but the result of intertwined structural factors. The first factor is rising lodging prices. According to the Japan Research Institute, current lodging costs are roughly 1.3 times pre-COVID levels, and price increases are believed to be suppressing domestic demand. With real wages stagnant, rising lodging costs effectively make travel “out of reach” for many Japanese travelers.
The second factor is price competition with inbound demand. In major tourist cities like Tokyo and Kyoto, foreign visitors’ willingness to pay exceeds that of Japanese travelers, and hotels are optimizing inventory allocation and pricing for high-rate inbound guests. As a result, Tokyo’s Japanese overnight stays fell 12.0% YoY and Kyoto’s fell 11.9%. In urban areas, Japanese travelers are not so much “being chosen” as “no longer choosing” hotels there.
The third factor is demographics. The 50s and 60s age brackets, which form the core of travel demand, have entered a population decline phase, and disposable income among younger generations is also stagnating. JTB Tourism Research’s 2025 outlook had projected travel volume at 102.7% YoY, but the annual overnight statistics came in at -3.8%, far below initial expectations. This suggests that price factors eroded travel demand more than anticipated.
Source: HotelBank Editorial Team based on Japan Tourism Agency “Overnight Travel Statistics Survey,” Cabinet Office “Consumer Price Index,” and other sources
7. The 2026 Issue: Impact of Survey Methodology Change and Statistical Discontinuity
Industry stakeholders should note that beginning with the January 2026 survey, the Japan Tourism Agency has changed the stratification basis from “number of employees” to “number of rooms.” Previously, survey forms were divided into three categories by employee count, but from 2026 onward, they will be divided by room count (Form 1: 1-19 rooms, Form 2: 20-199 rooms, Form 3: 200+ rooms). The Agency itself states explicitly that “year-over-year (same-month) ratios and differences may include the effects of this revision,” so 2026 figures must be interpreted with the assumption that structural noise has entered the data.
Particularly affected are facilities with few employees but many rooms (such as labor-saving business hotels) or, conversely, facilities with few rooms but many employees (such as luxury ryokans). These weight changes may create discontinuities in YoY comparisons by facility type and region. In practical terms, when comparing 2026 annual figures with those of 2025 or earlier, it will be necessary to check whether the Agency publishes adjusted or estimated values.
Another issue is the effective response rate for full-year 2025. The number of surveyed facilities gradually declined from 22,347 in January 2025 to 20,395 in December, with the effective response rate ranging between 47.9% and 51.8%. The response rate for facilities with fewer than 10 employees was relatively low at 34.6% to 39.4%, and capturing the reality of small-scale facilities remains a challenge. The 2026 survey methodology change can be seen as part of a response to this issue.
8. Implications for the Operational Frontline: Redesigning Segment-Specific Strategy
Based on the above analysis, we offer three concrete implications for industry stakeholders. First, urban business hotels and city hotels are running near their occupancy ceiling (above 75%), so ADR improvement becomes the main battleground. The key is to assess Japanese demand’s price sensitivity carefully while optimizing revenue on inventory with high inbound ratios.
Second, regional ryokans and resort hotels must accept the structural retreat of Japanese demand and redesign their channels for foreign guest acquisition. Long-haul markets that posted double-digit growth by nationality—the United States (+19.3%), China (+20.6%), India (+42.9%), and Russia (+105.3%)—have a strong affinity with regional dispersion, and strengthening OTA distribution and language support is likely to be effective.
Third, from a REIT and investor perspective, two distinct revenue models are likely to coexist going forward: midscale operators with occupancy near 90% and luxury/resort properties with ADR above ¥30,000. With operators like Japan Hotel REIT and Hoshino Resorts REIT continuing to revise distribution guidance upward, the pricing power of operating companies will become a key determinant of stock selection.
Conclusion: The “Two Lodging Markets” the Numbers Reveal
The Japan Tourism Agency’s 2025 annual statistics reveal a fact: “Japan’s lodging market is no longer a single demand pool but is bifurcating into two independent markets—inbound demand and domestic demand.” The headline figure of -0.8% obscures this bifurcation, but the diagonal movement of Japanese -3.8% and foreign +8.2% is large enough to compel a redesign of industry strategy.
Furthermore, the 2026 survey methodology change will temporarily blur the continuity of statistical data. Revenue managers, operating companies, and investors will need to combine multiple sources—not just official statistics, but also actual OTA prices, monthly REIT disclosures, and inbound data by nationality—to grasp the market with high resolution. 2025 can be summarized as “flat in the headline numbers, but a turning point in the underlying structure.”
Note on future-dated ADR: The ADR figures in this article reflect the average of advertised prices on OTAs at the time of survey, and they fluctuate as the check-in date approaches. Please note that prices currently set high may decline through last-minute markdowns.
Related Links
- HotelBank Top
- Japan Tourism Agency “Overnight Travel Statistics Survey” Official Page
- Overnight Travel Statistics Survey 2025 Annual (Preliminary) Press Release