

Look at Kanagawa’s hotel market at the prefectural level and you see almost nothing. The estimated settled ADR settles into a moderate ¥14,100 on a trailing 12-month average (+6.0% year on year) — but inside that average, neighbouring wards are separated by a 2.67x rate gap. The unit of analysis in this article is neither “Kanagawa Prefecture” nor “Yokohama City” but the administrative wards of its three designated cities: 18 wards in Yokohama, 7 in Kawasaki and 3 in Sagamihara, 28 in total. For development teams choosing a site in Greater Tokyo, for funds and regional banks looking at mid-sized suburban and inner-suburban deals, and for asset managers rebuilding a property’s competitive set, we place all 28 wards on the same footing — room stock, ADR tier, land price and daytime employment — and quantify where room for a new hotel is still left.
It is worth drawing the line against our earlier coverage first. Yokohama Minatomirai Luxury Hotel Pipeline Investment Analysis was confined to the Minatomirai 21 district and the luxury band. This article covers every price band across the 28 wards, and puts Minatomirai (Nishi Ward) and Kannai (Naka Ward) in perspective as two of those 28. Tokyo 23 Wards Supply Pressure 2026: Arakawa 16.0%, Minato Just 4.5% covered Tokyo, and this article is the sequel that applies the same method to the neighbouring prefecture. We include exactly one comparison table against the 23 wards, and from there stay with the internal structure of Kanagawa’s 28. Hotel Investment in Japan’s “Second-Tier” Cities includes Saitama and Chiba, but not Yokohama, Kawasaki or Sagamihara. This is the first time we have treated all three Greater Tokyo designated cities at ward level.
Metric Definitions Used in This Article
- ADR (average daily rate) = an estimated settled rate (tax-exclusive equivalent), calculated by applying a segment-specific correction factor to the lowest published plan level each property lists on the major booking sites (double occupancy, per-room rate, tax-included). Cross-checked against per-property results disclosed by listed hotel REITs (91 properties, trailing three months), the median error is about 7%. These are estimates and differ from each property’s actual transacted rates and accounting figures. An area-level ADR is the median of the properties covered (the level of a typical property in that area).
- OCC (occupancy) = sold rooms as a share of total rooms in the area (an estimate based on OTA sales inventory; consistency checks against REIT monthly disclosures put the accuracy within roughly a few percentage points).
- Where listed price is mentioned, it is the per-room rate at double occupancy (tax-included).
- Room stock = the total rooms of properties whose address falls in the ward in question, within the property master MetroEngines Research tracks. It is not a complete census.
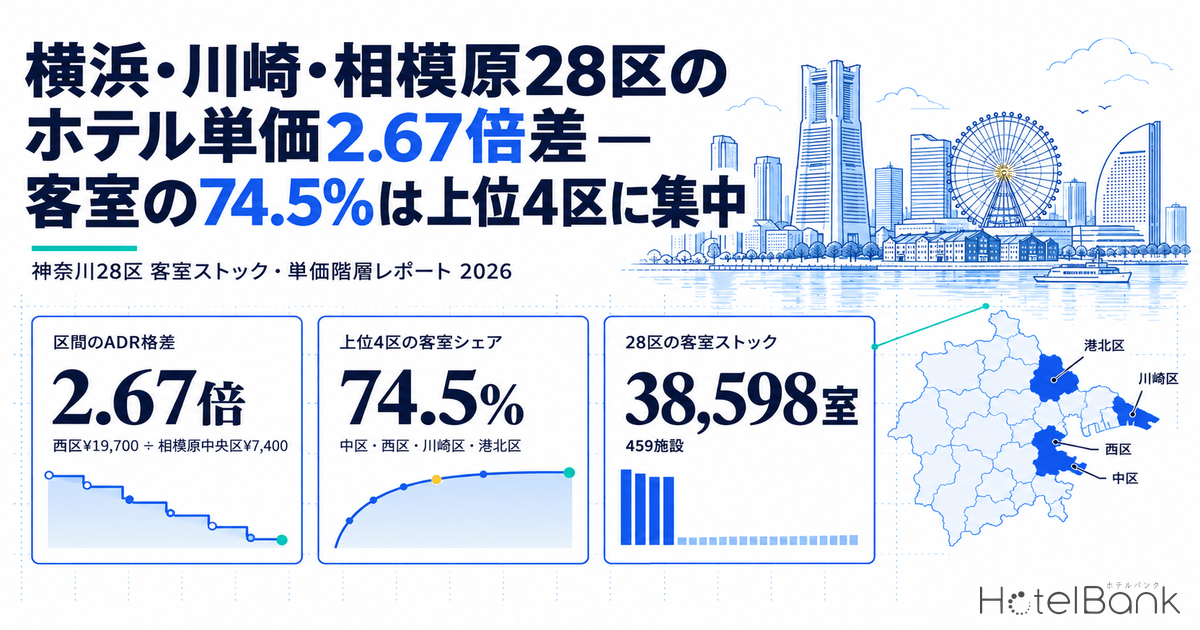
- — Of 38,598 rooms (459 properties), 74.5% sit in the top four wards. The remaining 24 wards hold 85.7% of the 28-ward population but only 25.5% of the rooms.
- — Ward-level estimated settled ADR runs from ¥19,700 in Nishi Ward to ¥7,400 in Sagamihara Chuo — a 2.67x spread. Naka Ward holds 40.0% of the rooms yet sits in the second tier at ¥11,600.
- — Once land price is included, per-room theoretical yield is highest at Higashi-Kanagawa 6.63% and Hashimoto 5.57%, lowest at Kawasaki Station 2.96% and Musashi-Kosugi 2.90%. Depth of existing clustering and the feasibility of new development do not line up.
- — Across 94 properties the distribution forms two clusters: 100–400 rooms at ¥6,000–13,000, and 300–500 rooms at ¥28,000–48,400. The 20–60 rooms × ¥20,000–30,000 band is all but empty.
- — Listed REIT ownership amounts to 3 investment corporations, 9 properties, 1,490 rooms, confined to Naka, Nishi and Kawasaki wards. No institutional capital has reached the other 25 wards.
40.0% of all rooms sit in Naka Ward alone: the 28 wards are not one market
Start with the shape of supply. Hotels, ryokan and simple lodging houses located in the 28 wards number 459 properties and 38,598 rooms. Yokohama’s Naka Ward alone accounts for 146 properties and 15,451 rooms — 40.0% of the 28-ward total. Nishi Ward follows with 5,112 rooms (13.2%), Kawasaki Ward 4,608 (11.9%) and Kohoku Ward 3,588 (9.3%); the top four together reach 28,759 rooms, or 74.5% of the whole.
The other 24 wards are left with 9,839 rooms. They hold 5.157 million residents — 85.7% of the 28-ward population — but only 25.5% of the rooms. On rooms per 10,000 residents, the top four wards run 334.0 against 19.1 for the remaining 24. These are administrative wards of the same designated cities, yet the density of lodging supply differs by more than 17 times.
The skew stands out further against Tokyo’s 23 wards. Their room stock is 3,242 properties and 240,658 rooms against a population of 9.819 million — 245.1 rooms per 10,000 residents. Kanagawa’s 64.1 is only 26.2% of that. Concentration differs too: in Tokyo even the leading ward, Minato, holds 16.0% of the total, while in Kanagawa, Naka holds 40.0%. The Herfindahl index (HHI), the sum of squared room shares, is 958 for the 23 wards against 2,068 for Kanagawa’s 28 — more than a twofold gap.
| Metric | Kanagawa 28 wards | Tokyo 23 wards | Ratio |
|---|---|---|---|
| Population | 6,017,714 | 9,818,564 | 0.61x |
| Properties | 459 | 3,242 | 0.14x |
| Rooms | 38,598 | 240,658 | 0.16x |
| Rooms per 10,000 residents | 64.1 | 245.1 | 0.26x |
| Room share of the leading ward | 40.0% (Naka) | 16.0% (Minato) | 2.50x |
| Room share of the top 4 wards | 74.5% | 53.3% | 1.40x |
| HHI (room share) | 2,068 | 958 | 2.16x |
Two things follow. First, Kanagawa’s 28 wards are not a scaled-down copy of Tokyo. Lodging demand is pressed into a narrow set of cores — the tourism and MICE axis of Naka and Nishi, and the business axis of Kawasaki and Kohoku — while the other wards carry little lodging function relative to their population. Second, that same skew is unmet room to grow. Sixteen wards sit below 20 rooms per 10,000 residents; together they house 3.238 million people with only 2,129 rooms.
Three ADR tiers: Nishi ¥19,700, Kannai and Shin-Yokohama ¥11,600, suburbs around ¥9,000
Now price. Estimated settled ADR can be computed at ward level for the 10 wards where the sample holds steady at five or more properties. Those 10 cover 90.8% of the 28-ward room stock (35,066 of 38,598 rooms). Trailing 12-month averages (September 2025 to August 2026) are below; between the highest, Yokohama Nishi at ¥19,700, and the lowest, Sagamihara Chuo at ¥7,400, lies a 2.67x gap.
Ranked, the wards fall into three tiers. Tier 1 is Nishi (¥19,700) and Kanagawa (¥15,200). Nishi contains Minatomirai and the west exit of Yokohama Station, where full-service city hotels and the luxury band cluster. Kanagawa’s sample is small at six properties, but relatively new mid-price stock lines the stretch from the east side of Yokohama Station to Shin-Koyasu. Tier 2 is Sagamihara Midori (¥12,300), Naka (¥11,600) and Kohoku (¥11,600). In Midori the hot-spring ryokan of Lake Sagami and Fujino lift the rate, so the substance of demand differs from the urban profile of Naka and Kohoku. Tier 3 runs from Tsurumi (¥10,100) down through Kawasaki ¥9,400, Takatsu ¥9,200, Nakahara ¥9,100 and Sagamihara Chuo ¥7,400.
What draws the eye is where Naka sits. It is the largest cluster, holding 40.0% of the room stock, yet its estimated settled ADR stays in the second tier at ¥11,600. Limited-service stock is piled thickly across the Kannai and Isezakicho area — 57 properties and 8,633 rooms — and that level sets the ward median. Nishi, by contrast, has only 32 properties, but eight city hotels with 2,950 rooms dominate and pull the ward level up to ¥19,700. Any property whose competitive set treats “Yokohama” as a single area is, at this point, likely to have drifted from reality. Limited-service hotels in Kannai and full-service hotels in Minatomirai are looking at markets in different price bands, even within the same city.
Overlaying the prefecture-wide series by year, 2026 ran consistently above the prior year through August, with a 12-month average of ¥14,100 (¥13,300 a year earlier, +6.0%). The shape — a seasonal trough in June and July, a peak in November and December — is common to all three years. Kanagawa is a market that commands more rate in the autumn-to-year-end demand period than at the August leisure peak, and that is worth holding as an assumption when drawing up a full-year business plan. Kanagawa Hotel Market 2026 divided the whole prefecture into four tiers — Hakone, Minatomirai, Shonan and the business band — and tracked the autumn rate gap; this article’s 28-ward analysis breaks that urban layer down to the administrative ward.
| Ward | Population | Properties | Rooms | Room share | Rooms per 10,000 residents | Est. settled ADR | Properties covered |
|---|---|---|---|---|---|---|---|
| Yokohama Naka | 156,117 | 146 | 15,451 | 40.0% | 989.7 | ¥11,600 | 51 |
| Yokohama Nishi | 107,740 | 32 | 5,112 | 13.2% | 474.5 | ¥19,700 | 17 |
| Kawasaki Kawasaki | 235,736 | 58 | 4,608 | 11.9% | 195.5 | ¥9,400 | 32 |
| Yokohama Kohoku | 361,356 | 24 | 3,588 | 9.3% | 99.3 | ¥11,600 | 16 |
| Sagamihara Chuo | 270,290 | 25 | 1,573 | 4.1% | 58.2 | ¥7,400 | 8 |
| Sagamihara Midori | 164,820 | 38 | 1,341 | 3.5% | 81.4 | ¥12,300 | 6 |
| Yokohama Kanagawa | 248,692 | 15 | 1,331 | 3.4% | 53.5 | ¥15,200 | 6 |
| Yokohama Tsurumi | 298,210 | 14 | 1,125 | 2.9% | 37.7 | ¥10,100 | 6 |
| Kawasaki Nakahara | 266,395 | 9 | 712 | 1.8% | 26.7 | ¥9,100 | 8 |
| Sagamihara Minami | 279,089 | 15 | 625 | 1.6% | 22.4 | ¥8,600 | 3 |
| Kawasaki Saiwai | 177,078 | 5 | 551 | 1.4% | 31.1 | ¥12,700 | 3 |
| Yokohama Tsuzuki | 213,854 | 9 | 452 | 1.2% | 21.1 | ¥8,700 | 2 |
| Yokohama Asahi | 241,128 | 7 | 364 | 0.9% | 15.1 | ¥8,000 | 1 |
| Yokohama Totsuka | 280,681 | 5 | 315 | 0.8% | 11.2 | ¥10,700 | 2 |
| Yokohama Kanazawa | 191,055 | 9 | 257 | 0.7% | 13.5 | ¥11,600 | 3 |
| Kawasaki Takatsu | 233,365 | 3 | 225 | 0.6% | 9.6 | ¥9,200 | 5 |
| Yokohama Minami | 201,564 | 11 | 215 | 0.6% | 10.7 | ¥7,100 | 4 |
| Kawasaki Miyamae | 234,660 | 7 | 166 | 0.4% | 7.1 | ¥5,400 | 1 |
| Kawasaki Asao | 177,816 | 5 | 137 | 0.4% | 7.7 | ¥17,000 | 2 |
| Yokohama Konan | 210,267 | 7 | 110 | 0.3% | 5.2 | ¥6,400 | 1 |
| Yokohama Hodogaya | 202,969 | 3 | 95 | 0.2% | 4.7 | — | — |
| Kawasaki Tama | 221,332 | 4 | 67 | 0.2% | 3.0 | ¥6,700 | 1 |
| Yokohama Isogo | 164,806 | 3 | 63 | 0.2% | 3.8 | — | — |
| Yokohama Midori | 180,837 | 3 | 60 | 0.2% | 3.3 | — | — |
| Yokohama Aoba | 306,087 | 1 | 37 | 0.1% | 1.2 | ¥10,900 | 1 |
| Yokohama Sakae | 119,732 | 1 | 18 | 0.0% | 1.5 | — | — |
| Yokohama Seya | 121,242 | 0 | 0 | 0.0% | 0.0 | ¥3,600 | 1 |
| Yokohama Izumi | 150,796 | 0 | 0 | 0.0% | 0.0 | — | — |
Demand without rooms: 712 rooms for the 50,000 people who work in Musashi-Kosugi
As a check on lodging demand, we take establishment and employee counts within a 1km radius of each ward’s core station from the Economic Census and set them beside the ward’s total room stock. The two have different aggregation footprints — the former a 1km ring around the station, the latter the whole ward — so they cannot be turned into a direct ratio. But the correspondence still reads: where the source of demand is thick, and where supply is thin.
The lower-right region is empty. Musashi-Kosugi (Nakahara Ward) holds 2,874 establishments and 49,585 employees within 1km of the station, 37.3% of them office-based — among the strongest business clusters in the 28 wards. Yet Nakahara Ward in total has 712 rooms, or 26.7 per 10,000 residents. Mizonokuchi (Takatsu Ward) has 31,467 employees against 225 rooms ward-wide, or 9.6. Shin-Yurigaoka (Asao Ward) has 20,747 employees against 137 rooms, or 7.7. In each case the ward population runs from the high 200,000s into the 300,000s.
Set apart in the upper left are Kannai (Naka Ward) and Yokohama Station (Nishi Ward): 2.5 to 3.3 times Musashi-Kosugi on employees, but 18 to 37 times on room density. Across the 28 wards, the scale of business clustering and the depth of room supply are not proportional. That divergence is itself the first-pass screening list for a development team.
| Core station (ward) | Establishments (1km ring) | Employees (1km ring) | Office-based share | Ward rooms | Rooms per 10,000 residents |
|---|---|---|---|---|---|
| Yokohama Stn (Nishi) | 6,888 | 163,865 | 25.7% | 5,112 | 474.5 |
| Kannai (Naka) | 10,210 | 132,686 | 26.0% | 15,451 | 989.7 |
| Kawasaki Stn (Kawasaki) | 4,685 | 92,239 | 24.0% | 4,608 | 195.5 |
| Shin-Yokohama (Kohoku) | 2,659 | 58,713 | 29.8% | 3,588 | 99.3 |
| Musashi-Kosugi (Nakahara) | 2,874 | 49,585 | 37.3% | 712 | 26.7 |
| Mizonokuchi (Takatsu) | 2,379 | 31,467 | 14.4% | 225 | 9.6 |
| Tsurumi (Tsurumi) | 2,405 | 27,321 | 13.1% | 1,125 | 37.7 |
| Kami-Ooka (Konan) | 1,851 | 21,029 | 11.3% | 110 | 5.2 |
| Shin-Yurigaoka (Asao) | 1,363 | 20,747 | 13.5% | 137 | 7.7 |
| Sagamihara (Chuo) | 1,735 | 18,497 | 12.7% | 1,573 | 58.2 |
| Shin-Sugita (Isogo) | 891 | 17,599 | 14.8% | 63 | 3.8 |
| Tama-Plaza (Aoba) | 1,431 | 14,908 | 14.2% | 37 | 1.2 |
| Center-Kita (Tsuzuki) | 1,164 | 14,847 | 7.0% | 452 | 21.1 |
| Totsuka (Totsuka) | 770 | 14,144 | 42.4% | 315 | 11.2 |
Location and land price: ¥3.59m/sqm of commercial land in front of Kawasaki Station, an ADR of ¥9,400
The moment land prices enter the argument about room to build, the ranking reshuffles. The map and tables below take the published land prices around each core station (commercial land, 2026) from the MLIT Real Estate Information Library and set them beside the ward’s estimated settled ADR.
| Yokohama Stn, Minatomirai, Kannai | Commercial zone 800% |
| Kawasaki Stn, Shin-Yokohama | Commercial zone 800% |
| Musashi-Kosugi, Mizonokuchi, Tsurumi, Totsuka, Kami-Ooka | Commercial zone 600% |
| Higashi-Kanagawa, Sagamiono | Commercial zone 500% |
| Hashimoto, Sagamihara | Commercial zone 400% |
| Tama-Plaza | Neighbourhood commercial 300% |
| Yokohama Nishi | 86.3–87.4% |
| Kawasaki Kawasaki | 80.2–84.6% |
| Yokohama Naka | 76.5–80.7% |
| Kanagawa, business hotels | 83.1–85.2% |
The land-price ranking does not match the ADR ranking. Commercial land around Kawasaki Station has a median of ¥3.59m/sqm (+11.1% year on year, n=5 published points), close to the ¥3.75m/sqm of Minatomirai and Sakuragicho. Yet Kawasaki Ward’s estimated settled ADR is ¥9,400, less than half Nishi Ward’s ¥19,700. Musashi-Kosugi shows the same pattern: commercial land at ¥2.61m/sqm (+11.1%) against Nakahara Ward’s ADR of ¥9,100. This land is priced for retail, office and residential use, not for hotels. Demand existing and a hotel being able to win the land are separate questions — an obvious fact in development practice, which appears in a particularly sharp form in Kanagawa.
The reverse holds at Higashi-Kanagawa (Kanagawa Ward), where commercial land at ¥695,000/sqm (+12.1%, n=1) sits against a ward ADR of ¥15,200, and at Hashimoto (Sagamihara Midori), where ¥416,000/sqm (+4.0%, n=1) sits against ¥12,300. The absolute level of land price is an order of magnitude lower while the rate belongs to the first or second tier.
Measured on land cost per room: Higashi-Kanagawa 6.63%, Kawasaki Station 2.96%
Land price and rate collapse into a single metric. Land cost per room can be approximated as “median commercial land price x gross floor area per room / floor area ratio”. We set gross floor area per room at 35.0 sqm. Construction cost is set in two stages.
Stage 1 (2025 basis): construction cost for an RC-frame hotel is set at ¥2.026m per tsubo (an assumption of this analysis). At 35.0 sqm = 10.59 tsubo, that is ¥21.45m per room. Stage 2 (construction-period inflation built in): assuming a 2028 opening with the midpoint of construction in 2027, compounding Turner & Townsend’s construction cost forecast (+5.3% in 2026, +5.0% in 2027) gives ¥23.72m per room. The table below shows both.
| Core station (ward) | Median commercial land price/sqm | YoY | FAR | Land cost /room | Est. settled ADR | Total investment /room (1) | Yield (1) | Total investment /room (2) | Yield (2) |
|---|---|---|---|---|---|---|---|---|---|
| Higashi-Kanagawa (Kanagawa) | ¥695,000 | 12.1% | 500% | ¥4.86m | ¥15,200 | ¥26.32m | 7.20% | ¥28.58m | 6.63% |
| Minatomirai/Sakuragicho (Nishi) | ¥3,750,000 | 10.0% | 800% | ¥16.41m | ¥19,700 | ¥37.86m | 6.49% | ¥40.12m | 6.12% |
| Yokohama Stn (Nishi) | ¥4,220,000 | 8.6% | 800% | ¥18.46m | ¥19,700 | ¥39.91m | 6.15% | ¥42.18m | 5.82% |
| Hashimoto (Sagamihara Midori) | ¥416,000 | 4.0% | 400% | ¥3.64m | ¥12,300 | ¥25.09m | 6.08% | ¥27.36m | 5.57% |
| Kannai/Bashamichi (Naka) | ¥2,100,000 | 18.1% | 800% | ¥9.19m | ¥11,600 | ¥30.64m | 4.71% | ¥32.90m | 4.39% |
| Shin-Yokohama (Kohoku) | ¥2,105,000 | 10.5% | 800% | ¥9.21m | ¥11,600 | ¥30.66m | 4.70% | ¥32.93m | 4.38% |
| Tsurumi (Tsurumi) | ¥1,190,000 | 8.7% | 600% | ¥6.94m | ¥10,100 | ¥28.39m | 4.43% | ¥30.66m | 4.10% |
| Mizonokuchi (Takatsu) | ¥1,000,000 | 11.6% | 600% | ¥5.83m | ¥9,200 | ¥27.28m | 4.21% | ¥29.55m | 3.89% |
| Kawasaki Stn (Kawasaki) | ¥3,590,000 | 11.1% | 800% | ¥15.71m | ¥9,400 | ¥37.16m | 3.14% | ¥39.42m | 2.96% |
| Musashi-Kosugi (Nakahara) | ¥2,610,000 | 11.1% | 600% | ¥15.22m | ¥9,100 | ¥36.68m | 3.08% | ¥38.94m | 2.90% |
The ranking runs as follows. At the top: Higashi-Kanagawa (Kanagawa Ward) 6.63%, Minatomirai and Sakuragicho (Nishi Ward) 6.12%, Yokohama Station (Nishi Ward) 5.82% and Hashimoto (Sagamihara Midori) 5.57%. In the middle: Kannai (Naka Ward) 4.39%, Shin-Yokohama (Kohoku Ward) 4.38%, Tsurumi (Tsurumi Ward) 4.10% and Mizonokuchi (Takatsu Ward) 3.89%. At the bottom: Kawasaki Station (Kawasaki Ward) 2.96% and Musashi-Kosugi (Nakahara Ward) 2.90%.
This is the argument of the article. In Kanagawa, the wards with deep room stock and the wards where acquiring land and building today actually works out are not the same wards. Naka and Kawasaki have a low ceiling on rate precisely because their existing clustering is large, and land there is expensive because other uses pull it up. Kanagawa Ward and Sagamihara Midori, by contrast, have thin supply (53.5 and 81.4 rooms per 10,000 residents), rates in the first or second tier, and land an order of magnitude cheaper. Minatomirai and Yokohama Station carry high land prices but absorb them, because their ADR of ¥19,700 is the highest of any ward.
WS1 Inner-suburban: low land price, mid rate
Higashi-Kanagawa (Kanagawa Ward) / Hashimoto (Sagamihara Midori)
Land at ¥416,000–695,000/sqm against an ADR of ¥12,300–15,200. Land cost per room stays within ¥3.64m–4.86m, and land is a small 13–17% of total investment. Room to make the numbers work remains even as construction costs rise.
WS2 Under-supplied relative to business clustering
Musashi-Kosugi (Nakahara) / Mizonokuchi (Takatsu) / Shin-Yurigaoka (Asao)
20,000–50,000 employees against 137–712 rooms ward-wide. The demand side checks out, but at Musashi-Kosugi the land price does not match the rate. Entry has to hold land acquisition cost down — the fringe of the 600% FAR zone, or conversion of an existing building.
Dense New build is disadvantaged in the existing cluster
Kannai (Naka) / Kawasaki Station (Kawasaki)
52.0% of the 28 wards’ rooms sit in these two. Rates are second- to third-tier at ¥9,400–11,600, land is ¥2.10m–3.59m/sqm. Theoretical yield on a new build stays at 2.96–4.39%, making acquisition and repositioning of existing assets easier to consider than new entry.
Sensitivity is worth checking too. Against the mid case (the assumptions used in the text), the table below sets theoretical yield in five cases: an upside where ADR runs 10% higher, and downsides where ADR is 10% lower, where occupancy is 5pt lower, and where both occur.
| Core station (ward) | Upside ADR +10% | Mid base | Downside 1 ADR −10% | Downside 2 OCC −5pt | Downside 3 both |
|---|---|---|---|---|---|
| Higashi-Kanagawa (Kanagawa) | 7.29% | 6.63% | 5.97% | 6.24% | 5.62% |
| Minatomirai/Sakuragicho (Nishi) | 6.73% | 6.12% | 5.51% | 5.76% | 5.19% |
| Yokohama Stn (Nishi) | 6.40% | 5.82% | 5.24% | 5.48% | 4.93% |
| Hashimoto (Sagamihara Midori) | 6.13% | 5.57% | 5.01% | 5.24% | 4.72% |
| Kannai/Bashamichi (Naka) | 4.83% | 4.39% | 3.95% | 4.13% | 3.72% |
| Shin-Yokohama (Kohoku) | 4.82% | 4.38% | 3.94% | 4.12% | 3.71% |
| Tsurumi (Tsurumi) | 4.51% | 4.10% | 3.69% | 3.86% | 3.47% |
| Mizonokuchi (Takatsu) | 4.28% | 3.89% | 3.50% | 3.66% | 3.29% |
| Kawasaki Stn (Kawasaki) | 3.26% | 2.96% | 2.66% | 2.78% | 2.51% |
| Musashi-Kosugi (Nakahara) | 3.19% | 2.90% | 2.61% | 2.73% | 2.46% |
One step further: taking Higashi-Kanagawa (Kanagawa Ward) as the representative location, theoretical yield is laid out on two axes, ADR and occupancy. Centred on the mid case (ADR ¥15,200, assumed occupancy 85.2% — the level Kanagawa business hotels recorded in July–August 2026) at 6.63%, the table shows how far the assumptions have to break before the level changes.
| Est. settled ADR \ Occupancy | 75% | 80% | 85.2% | 88% | 91% |
|---|---|---|---|---|---|
| ¥12,200 | 4.67% | 4.98% | 5.31% | 5.48% | 5.67% |
| ¥13,700 | 5.26% | 5.61% | 5.97% | 6.17% | 6.38% |
| ¥15,200 | 5.84% | 6.23% | 6.63% | 6.85% | 7.08% |
| ¥16,800 | 6.42% | 6.85% | 7.30% | 7.54% | 7.79% |
| ¥18,300 | 7.01% | 7.47% | 7.96% | 8.22% | 8.50% |
The top four locations hold 4.7–5.6% even with both stresses applied, while Kawasaki Station and Musashi-Kosugi fall to around 2.5%. If you assume construction costs keep rising at roughly 5% a year, a simple but easily overlooked pattern emerges: the lower the absolute level of land price, the greater the resilience to stress. Rising construction cost also suppresses new supply itself, which for properties already operating is a form of competitive relief.
Positioning: on room count x ADR, the gap is 20–60 rooms at ¥20,000–30,000
Raise the resolution from ward level to property level. The 94 properties in the 28 wards with 60 or more rooms for which an estimated settled ADR could be computed for six months or more are plotted by room count (x axis) and estimated settled ADR (y axis).
The distribution splits cleanly into two clusters. One is the 100–400 room, ¥6,000–13,000 band, which holds the majority of the 94 properties: the main battleground formed by limited-service hotels in Kannai, Kawasaki, Shin-Yokohama and Sagamihara. The other is the 300–500 room, ¥28,000–48,400 band, made up of the large full-service properties of Minatomirai and Yamashitacho. According to Hyatt Hotels & Resorts Japan, “Press Materials, April 2026”, Hyatt Regency Yokohama opened in May 2020 with 315 rooms; according to Hilton’s “Company Overview” (updated 25 August 2026), Hilton Yokohama opened in 2023 with 339 rooms. Both sit in this upper band.
The middle is thin. The band of 20–60 rooms at an ADR of ¥20,000–30,000 — small-scale, high-rate boutique and lifestyle properties — barely exists in the 28 wards. The 94 properties here were selected at 60 rooms and above, so small properties are not in the population; but the same reading comes out of the relationship between rooms and property counts by ward. Nishi’s 32 properties and 5,112 rooms average 160 rooms each; Naka’s 146 properties and 15,451 rooms average 106. Both lean either “large and mid-rate” or “small and low-rate”.
Why the band is empty is consistent with the land costs of the previous section. Building a new 20–60 room high-rate property in Minatomirai or Kannai means ¥9.19m–16.41m of land cost per room, with no economies of scale to offset it. At lower-land-price locations such as Higashi-Kanagawa or Hashimoto, the quality of demand needed to command ¥20,000–30,000 has not yet been tested. The reading is that entering this band is more realistic through conversion or rebranding of an existing building than through new construction.
Institutional ownership is concentrated in three wards; 25 wards hold not one property
Looking at listed hotel REIT holdings, properties inside the 28 wards come to 3 investment corporations, 9 properties and 1,490 rooms. They are confined to three wards — Yokohama’s Naka and Nishi and Kawasaki’s Kawasaki Ward — and the remaining 25 hold not a single property.
| Investment corporation | Property | Rooms | Acquired | Acquisition price |
|---|---|---|---|---|
| Invincible Investment Corporation | APA Hotel Yokohama Kannai | 451 | Feb 2015 | ¥8,350m |
| Invincible Investment Corporation | HOTEL MYSTAYS Yokohama | 194 | Jul 2014 | ¥2,119m |
| Invincible Investment Corporation | HOTEL MYSTAYS Yokohama Kannai | 165 | Feb 2018 | ¥5,326m |
| Invincible Investment Corporation | Flexstay Inn Sakuragicho | 70 | Jul 2019 | ¥1,425m |
| Invincible Investment Corporation | Flexstay Inn Kawasaki Kaizuka | 64 | Jul 2015 | ¥980m |
| Invincible Investment Corporation | Flexstay Inn Kawasaki Ogawacho | 62 | Jul 2015 | ¥906m |
| Ichigo Hotel REIT Investment Corporation | HOTEL THE KNOT YOKOHAMA | 145 | Aug 2023 | ¥4,800m |
| Ichigo Hotel REIT Investment Corporation | Capsule Plus Yokohama | 169 | Mar 2017 | ¥1,490m |
| Japan Hotel REIT Investment Corporation | Hotel JAL City Kannai Yokohama | 170 | Nov 2006 | ¥4,000m |
Six of the nine were acquired in 2019 or earlier, and the price band is mostly limited-service. Within the 28 wards, listed REIT capital circulates inside the existing clusters of Kannai, Sakuragicho and the area around Kawasaki Station; the inner-suburban low-land-price band we flagged as WS1 has not yet seen institutional capital. Read the other way, that means assets in that band currently sit in a low-liquidity market — room to negotiate on price for a buyer, and a point to work through for anyone thinking about the exit.
The new supply side is worth a look too. Openings in the 28 wards peaked in 2019 at 13 properties and 3,459 rooms, then settled to around 1,000 rooms a year: 5 properties / 728 rooms in 2021, 6 / 1,060 in 2022, 10 / 1,358 in 2023, 6 / 732 in 2024 and 9 / 752 in 2025. For 2026 the figure is 3 properties / 679 rooms, of which 228 are in Nishi Ward. Hilton’s “Company Overview” (updated 25 August 2026) lists Hilton Garden Inn Yokohama Minatomirai (228 rooms) as a 2026 opening. The same document lists Conrad Yokohama (272 rooms) as scheduled to open in 2027, so the upper band in Minatomirai looks set to thicken by another step.
One caveat: opening counts for the most recent period onward are based on confirmed listings, so they may rise as further listings appear. The figures given here for 2026 and beyond should therefore be read as the lower bound of the currently confirmed pipeline.
Conclusion: split the 28 wards into four groups and rebuild the competitive set
From this analysis, Kanagawa’s 28 wards can be organised into the following four groups.
| Group | Wards | Est. settled ADR | Character and investment implications |
|---|---|---|---|
| A. High rate, high density | Yokohama Nishi | ¥19,700 | Highest rate of the 28 wards. Land is expensive too, but the rate absorbs it, giving a theoretical yield of 5.8–6.1%. New upper-band supply continues through 2026–2027, so build the competitive set from full-service hotels within the ward. |
| B. Low rate, high density | Yokohama Naka, Kawasaki Kawasaki | ¥9,400–11,600 | 52.0% of the 28 wards’ rooms. The ceiling on rate is low and land is expensive because other uses pull it up. Theoretical yield on a new build is 3.0–4.4%, making acquisition and repositioning easier to consider. |
| C. Mid rate, low density (room to build) | Yokohama Kanagawa, Sagamihara Midori, Yokohama Kohoku | ¥11,600–15,200 | 53.5–99.3 rooms per 10,000 residents. Some locations have land prices an order of magnitude lower, keeping land cost per room at 13–17% of total investment. Our first-choice group. |
| D. Demand present, supply thin | Kawasaki Nakahara, Takatsu and Asao; Yokohama Totsuka, Konan and Aoba, among others | ¥6,400–10,700 | 14,000–50,000 employees within 1km of the station against 37–712 rooms ward-wide. Entry depends on holding land acquisition cost down: conversion, fringe sites or leasehold. |
Brought back to asset management of an existing property, the implication is simpler. Any property that builds its competitive set at the level of “within Yokohama City” or “within Kawasaki City” is currently comparing across a 2.67x rate gap. For a limited-service hotel in Kannai, the competition is not the city hotels of Minatomirai but the same price band in Kawasaki and Tsurumi wards. Conversely, a Minatomirai property should be referencing the upper band inside its own ward and the upper-midscale band of central Tokyo. Simply re-ordering ADR by ward changes both the rate-shop set and how pricing is pitched.
For the development side, the starting point is that the 28 wards are not “a substitute for Tokyo” but a separate market with a different structure of density and rate. Rooms per 10,000 residents at 26.2% of Tokyo’s 23 wards is simply a fact about supply being small; it does not mean demand is 26.2% of Tokyo’s. How far that gap closes depends on how three constraints — business clustering, land price and floor area ratio — combine at each location. The 10-location screen in this article is meant as a tool for narrowing those combinations down first.
⚠ A note on ADR for future dates: for periods from October 2026 onward, the ADR figures in this article are estimates based on the selling prices published at the time of the survey, and will move as the check-in date approaches. Rates set high at present may fall through last-minute discounting. All estimated settled ADR used in the ward-level analysis is aggregated over the settled period from September 2025 to August 2026.
Related reading
- Yokohama Minatomirai Luxury Hotel Pipeline Investment Analysis: Price Tiers & Mixed-Use Upside
- Tokyo 23 Wards Supply Pressure 2026: Arakawa 16.0%, Minato Just 4.5%
- Hotel Investment in Japan’s “Second-Tier” Cities: ADR, Supply & Yield Across 5 Markets
- Kanagawa Hotel Market 2026: Four Tiers and a ¥15,400 Autumn ADR Gap
References and Sources
■ Data sources
Room stock and property counts come from the lodging property master we track (Kanagawa 28 wards, N=459 properties / 38,598 rooms). Estimated settled ADR is a monthly aggregation applying segment-specific corrections to prices published on the major booking sites; the ward-level figures cover 10 wards and 155 property-months, and the property-level distribution covers the 94 properties with 60 or more rooms for which six or more months could be computed. Occupancy is estimated from OTA sales inventory (June to August 2026). Land prices and floor area ratios come from the MLIT Real Estate Information Library; business clustering from the 1km station radius in the Economic Census of the Ministry of Internal Affairs and Communications and the Ministry of Economy, Trade and Industry; population from the Japan Geographic Data Center (April 2026 survey).
■ Calculation assumptions
Land cost per room = median published commercial land price × gross floor area per room of 35.0 sqm ÷ floor area ratio. Construction cost is set in two stages: ¥2.026m per tsubo for an RC frame (2025 basis) = ¥21.45m per room, and ¥23.72m per room after compounding Turner & Townsend’s construction cost forecast (+5.3% in 2026, +5.0% in 2027) for an assumed 2028 opening with construction midpoint in 2027. Theoretical yield = ADR × occupancy × 365 days × 40% GOP ratio ÷ total investment (land cost plus construction cost), with a uniform 85.2% occupancy at every location (the level for Kanagawa business hotels in July–August 2026). Sensitivity is presented in five cases — upside (ADR +10%), mid and downside (ADR −10% / occupancy −5pt / both) — plus a two-axis ADR × occupancy grid for the representative location.
■ Limitations and caveats
The property master is not a complete census and is based on confirmed listings, so recent openings may increase (figures here for 2026 onward are the lower bound of the confirmed pipeline). Estimated settled ADR is an estimate; cross-checked against REIT disclosures, the median error is about 7%, and wards covered by fewer than five properties are reference values. Because business clustering within 1km of a station and room stock across a whole ward have different aggregation footprints, they are treated as a contrast of levels rather than a ratio. The yield calculation is a simplified one covering only land, construction cost and GOP ratio; it excludes acquisition costs, working capital, FF&E renewal, financing terms and pre-opening expenses. ADR for periods from October 2026 onward is estimated from listed prices at the time of the survey.
■ Market data
- MetroEngines Research & Consulting — property master (28 wards, N=459 properties / 38,598 rooms), estimated settled ADR (10 wards, 155 property-months / 94 major properties), occupancy (estimated from OTA sales inventory)
■ Government statistics and public data
- MLIT Real Estate Information Library — published land prices (2026, commercial land), zoning and floor area ratios
- MLIT “Statistical Survey on Building Construction Starts” — hotel construction cost per tsubo by structure type (reference)
- Ministry of Internal Affairs and Communications / Ministry of Economy, Trade and Industry, “Economic Census” — establishments and employees within a 1km station radius
- Japan Geographic Data Center, “April 2026 Survey: Population and Households by Municipality (Kanagawa)”
- Japan Geographic Data Center, “April 2026 Survey: Population and Households by Municipality (Tokyo)”
■ REIT and corporate disclosures
- Invincible Investment Corporation — portfolio disclosure
- Ichigo Hotel REIT Investment Corporation — portfolio disclosure
- Japan Hotel REIT Investment Corporation — portfolio disclosure
- Turner & Townsend — construction cost inflation forecast (+5.3% in 2026, +5.0% in 2027)
Source: Hyatt Hotels & Resorts Japan, “Press Materials, April 2026”
Source: Hilton, “Company Overview” (updated 25 August 2026)