

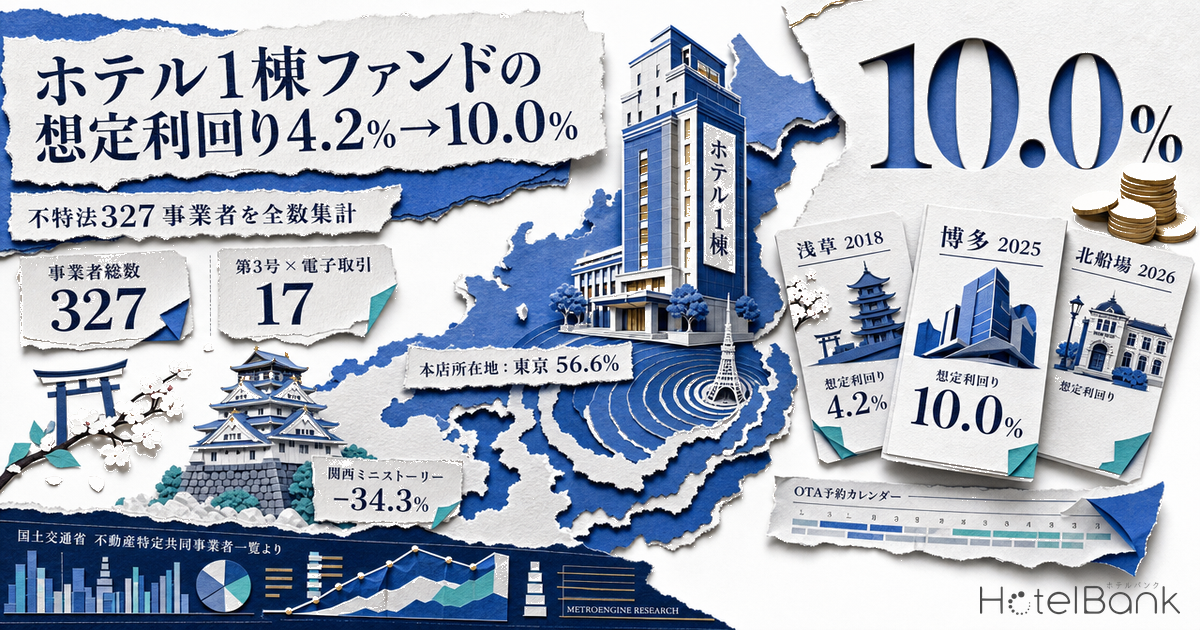
Counting the Ministry of Land, Infrastructure, Transport and Tourism (MLIT) register of operators licensed under Japan’s Real Estate Specified Joint Enterprise Act line by line gives 327 firms as of 31 July 2026 — 277 licensed operators plus 50 registered small-scale operators. Of these, 121 are authorised for electronic transaction business (contracting online). Narrower still, only 17 firms nationwide hold both Type 3 business and electronic transaction authorisation, the combination required to structure a bankruptcy-remote, SPC-based scheme online. This article takes that register as a primary source, counts it in full, and quantifies the scale, yields and geographic distribution of the retail capital actually flowing into lodging assets.
Metric Definitions Used in This Article
- ADR (average daily rate): an estimated settled rate (tax-exclusive equivalent), derived by applying a segment-specific adjustment factor to each property’s lowest publicly listed plan on OTAs (double occupancy, per-room, tax-inclusive). Cross-checked against property-level results disclosed by listed hotel REITs (91 properties, trailing three months), the median error is about 7%. These are estimates and differ from each property’s actual transacted rates and accounting figures. Area-level ADR is the median of the properties covered (the level of a typical property in that area).
- OCC (occupancy): sold rooms as a share of total rooms in the area, estimated from OTA-listed inventory. Because it is based on how listed OTA inventory sells down, it differs from a property’s true overall occupancy.
- Target yield: the annualised figure each fund operator disclosed at the time of the offering. It is not a guarantee of realised returns.
- Data sources: MetroEngines Research & Consulting; MLIT, “Register of Operators and Qualified Special Investors under the Real Estate Specified Joint Enterprise Act”
- — 327 firms——the full count of operators under the Act in MLIT’s register as of 31 July 2026: 277 licensed plus 50 registered small-scale.
- — 17 firms——operators holding both Type 3 business, which uses a special-purpose operator (SPC), and electronic transaction authorisation. Of 277 licensed operators, only this many have the vehicle needed to structure a whole hotel online on a bankruptcy-remote basis.
- — 56.6% in Tokyo——185 of the 327 firms are headquartered in Tokyo, while 20 prefectures have none at all. The vehicles sit in the cities; the lodging assets sit in the regions — the two distributions run in opposite directions.
- — Target yields 4.2% → 10.0%——against 4.2% on the December 2018 Asakusa deal, 6.0% has been the floor since 2025, and a whole-building deal in Hakata, Fukuoka was offered at 10.0%. The quoted range has more than doubled in eight years.
- — Chuo-ku, Osaka −34.3%——estimated settled ADR was ¥9,800 in July 2026, down 34.3% year on year (N=194 properties). Single-area, single-property deals get no diversification, so this rate volatility passes straight through to the yield that has to be offered.
How This Differs From Our Earlier Work — Not a Listed REIT, a Private REIT or a Security Token, but a Fourth Vehicle Supervised by MLIT
On the routes capital takes into lodging assets, this publication has previously covered listed J-REIT acquisition activity, private REIT portfolio composition, regional-bank-led funds, and digital securities issued under the Financial Instruments and Exchange Act (real-estate security tokens). This article is about none of those. The Real Estate Specified Joint Enterprise Act (不動産特定共同事業法, hereafter “the Act”) was enacted in 1994 and is administered by MLIT. It regulates, through a licensing regime, the business of pooling capital from multiple investors to operate physical real estate and distribute the income. It descends from the Building Lots and Buildings Transaction Business Act rather than the Financial Instruments and Exchange Act, so its supervising authority, its licensing requirements and its investor-protection design all sit in a separate system from the other three routes.
The practical difference shows up in how a scheme is put together. Real-estate security tokens are issued as electronically recorded transferable rights within the FIEA framework, and require a Type II financial instruments business licence or a trust-beneficiary-interest vehicle. The Act, by contrast, lets an operator choose between Type 1 business — holding the physical asset itself as seller and manager — and Type 3 or Type 4 business, in which a special-purpose operator (SPC) is established and the licensed firm is engaged to run it. Under the former the property sits on the operator’s balance sheet; under the latter, bankruptcy remoteness applies. It is this framework under the Act that functions as the route through which retail capital reaches directly into the single-building hotels of a few hundred million to a few billion yen that J-REIT acquisitions and regional-bank-led funds do not reach.
Counting the 327 — By Licence Category, Very Few Vehicles Can Handle a Whole Hotel
The table below is the result of tallying MLIT’s published operator register (as of 31 July 2026) row by row. Of the 277 licensed operators, 96 are licensed jointly by the Commissioner of the Financial Services Agency and the Minister of Land, Infrastructure, Transport and Tourism, 1 by the Minister alone, and 180 by prefectural governors. By business type, Type 1 — transacting in real estate on one’s own account and taking in capital — is the largest at 219 firms, while Type 3 (engaged to operate on behalf of a special-purpose operator) numbers 76 and Type 4 (acting as agent or broker for a special-purpose operator’s contracts) just 72.
| Category | Firms | Description |
|---|---|---|
| Licensed operators (total) | 277 | Licensed to conduct the businesses listed in Article 2(4) |
| └ FSA Commissioner & MLIT Minister licence | 96 | Offices in two or more prefectures |
| └ MLIT Minister licence | 1 | — |
| └ Prefectural governor licence | 180 | Spread across 21 prefectures |
| Type 1 business | 219 | Transacts real estate itself and takes in capital |
| Type 2 business | 212 | Agency or brokerage of contract execution |
| Type 3 business | 76 | Engaged to operate on behalf of a special-purpose operator |
| Type 4 business | 72 | Agent or broker for a special-purpose operator’s contracts |
| Electronic transaction authorised | 121 | Can execute contracts online |
| Type 3 and electronic transaction | 17 | Can structure bankruptcy-remote deals online |
| Small-scale operators (registered) | 50 | Capped at ¥100m per project and ¥1m per investor |
| └ of which electronic transaction authorised | 21 | — |
| Operators limited to qualified special investors (notified) | 36 | Professional investors only; retail cannot participate |
| Qualified special investors (notified) | 13 | — |
The overlap between Type 3 business and electronic transaction authorisation is what matters here. Deals for a whole hotel run from several hundred million to several billion yen in acquisition price, and building them entirely through Type 1 business — which puts the property on the operator’s own account — places a heavy load on equity capital. Establishing a special-purpose operator (SPC) to achieve bankruptcy remoteness while raising small tickets from retail investors online is a combination only 17 of the 277 firms can use to its full extent. For an operator weighing whether to structure a lodging-asset fund, that cuts both ways: competition is thin, but it also shows the real cost of entry — without stacking up that many licences, you do not have a vehicle for large deals.
On a cumulative view, new licences peaked in a single year in 2019 at 31 firms — two years after the 2017 amendment created the small-scale category and electronic transaction business. Licences have kept accumulating at 20–30 a year since, taking the total from 58 at the end of 2015 to 277 at the end of July 2026, a 4.8-fold increase. Over the same period, firms authorised for electronic transaction business went from 10 to 121, a 12.1-fold rise — evidence that online fundraising is the main axis of the growth.
Geographic Skew — 56.6% of Operators Are in Tokyo; 20 Prefectures Have None
Tallied by head-office location, 185 of the 327 firms (56.6%) are concentrated in Tokyo. Osaka follows with 40, Kanagawa 27, Aichi 14 and Fukuoka 13; the top five prefectures account for 279 firms (85.3%). At the other end, 20 prefectures have neither a licensed operator nor a registered small-scale one: Aomori, Akita, Yamagata, Gunma, Toyama, Fukui, Yamanashi, Nagano, Gifu, Mie, Nara, Tottori, Shimane, Okayama, Ehime, Kochi, Saga, Kumamoto, Miyazaki and Kagoshima.
This skew runs almost exactly counter to where lodging assets sit. Onsen ryokan, resorts and regional single-building hotels are, if anything, concentrated in the prefectures with zero operators. The picture is one of fund vehicles in Tokyo and target assets in the regions. In practice, deals involving regional lodging properties are usually structured by firms headquartered in Tokyo, Osaka or Fukuoka. From the arranger’s side, sourcing a regional deal means working outside one’s own catchment, which makes partnerships with local operators, regional banks and licensed real-estate agents a direct determinant of deal supply.
The Actual Lodging Deals — Target Yields Widened From 4.2% to 10.0% in Eight Years
Next, the lodging-asset deals actually structured, taken from each operator’s own disclosures. The table below lists the major deals with a published offering-start date in chronological order. Amounts, yields and terms are quoted exactly as each operator disclosed them at the time of the offering.
| Offering start | Operator | Fund / asset | Target yield | Offering amount | Target term |
|---|---|---|---|---|---|
| 2018/12 | CREAL | Hotel Amanek Asakusa Azumabashi Sky (ホテル アマネク 浅草吾妻橋スカイ), Asakusa, Tokyo | 4.2% | ¥880m | 24 months |
| 2019/07 | CREAL | Chikura Tsunagu Hotel (ちくらつなぐホテル), Minamiboso, Chiba | 5.0% | ¥240m | 24 months |
| 2023/03 | LAETOLI | ANA Crowne Plaza Kyoto value-up project, Phase 1 | — | ¥7.20bn | — |
| 2025/04 | CREAL | TSUKI Tokyo (TSUKI 東京), boutique hotel near Ginza | 6.0% | ¥3.62bn | 24 months |
| 2025/07 | Kyushu Asia Partners | KAF Fund No. 2 — whole hotel, Hakata Sumiyoshi, Fukuoka | 10.0% | ¥360m | 12 months |
| 2025/10 | CREAL | Akasaka hotel, Tokyo (31 rooms) | 6.0% | ¥1.82bn | 36 months |
| 2026/02 | CREAL | Kamakura hotel, Kanagawa (36 rooms) | 6.0% | ¥1.47bn | 36 months |
| 2026/06 | CREAL | Osaka Kitasemba hotel (168 rooms) | 7.4% | ¥3.42bn | 36 months |
Against 4.2% on the 2018 Asakusa deal and 5.0% on the 2019 Minamiboso deal, 6.0% has become the effective floor since 2025, with the whole-building deal in Hakata, Fukuoka offered at 10.0% and the 168-room Kitasemba deal in Osaka at 7.4%. The quoted range of target yields has more than doubled in eight years. Behind it lie the shift in the interest-rate environment, rising construction and acquisition costs, and the widening swings in the lodging market itself that the next section examines. It is also worth noting that on a net-yield basis that factors in acquisition costs, the gap versus the quoted target yield widens further.
The minimum ticket per investor is also designed differently by operator. CREAL starts at ¥10,000; COZUCHI’s short-term funds start at ¥10,000 and its medium-to-long-term funds at ¥10,000 per unit with a 10-unit minimum (¥100,000); Kyushu Asia Funding’s KAF Fund No. 2 starts at ¥100,000 per unit; and Hello! RENOVATION, a registered small-scale operator, offers units of ¥50,000 up to a maximum of 20 units (¥1m). Small-scale operators are subject to statutory caps of ¥100m raised per project and ¥1m per investor, so they cannot fund the acquisition of a whole hotel on their own. That cap design is why revitalisation deals for small regional inns sit with small-scale registrants while multi-billion-yen whole-building deals cluster around ministerial licences combined with Type 3 business.
¥3.6bn Filled in Three Hours and 37 Minutes — Investor Demand Outruns the Supply of Vehicles
What matters to an arranger is how much capital depth this route has. The ¥7.2bn Kyoto fund LAETOLI opened on 15 March 2023 was twice the size of the firm’s previous largest, the ¥3.6bn “Yoyogi Park development site” fund. That Yoyogi Park fund reached its full amount three hours and 37 minutes after opening on 5 May 2022, and the Kyoto fund was launched with an opening campaign built around the same three-hour-37-minute mark. CREAL’s Osaka Kitasemba hotel fund (¥3.42bn) likewise reached its full offering amount against a ¥2.50bn minimum for the deal to proceed, and closed on 15 July 2026.
For scale beyond lodging alone: seven listed hotel REITs hold 302 properties in total (ownership master, as of 24 August 2026), and for the 287 properties across six of those REITs where acquisition prices can be identified, the combined acquisition price is roughly ¥1.79tn. The money reaching lodging assets through the Act adds up to only a few tens of billions of yen even when every deal is stacked together — two orders of magnitude below the REITs. Yet for the ¥1bn–¥4bn single-building hotels that REITs find hard to acquire, and for small deals of around 30 rooms, the Act is in practice close to the only equity route available. The 31-room Akasaka and 36-room Kamakura deals in Table 2 fall in a range that tends to sit outside listed REITs’ portfolio-inclusion criteria. On the size of the underlying market these funds draw on, our breakdown of Japan’s ¥2.83tn room-revenue pool by prefecture sets out the base for judging which areas capital can flow into.
Yield Differences Are Market Differences — Osaka’s Estimated Settled ADR Is Down 34.3% Year on Year
The spread in quoted yields becomes readable when laid over what the lodging market is doing in each target area. The table below tracks the estimated settled ADR for each fund’s target area monthly, using MetroEngines Research data.
| Area | Corresponding deal | Jul 2026 | Jul 2025 | YoY | N (properties) |
|---|---|---|---|---|---|
| Chuo-ku, Osaka | Osaka Kitasemba hotel (7.4%) | ¥9,800 | ¥14,900 | −34.3% | 194 |
| Kamakura, Kanagawa | Kamakura hotel (6.0%) | ¥18,800 | ¥20,900 | −10.2% | 18 |
| Chuo-ku, Tokyo | TSUKI Tokyo (6.0%) | ¥15,700 | ¥16,900 | −6.8% | 152 |
| Minato-ku, Tokyo | Akasaka hotel (6.0%) | ¥15,100 | ¥16,000 | −5.3% | 132 |
| Minamiboso, Chiba | Chikura Tsunagu Hotel (5.0%) | ¥17,200 | ¥17,200 | +0.2% | 24 |
Estimated settled ADR in Chuo-ku, Osaka peaked at ¥16,500 in October 2025, then fell to ¥9,300 in June 2026 and ¥9,800 in July. Year on year, that is −35.8% in June and −34.3% in July. Demand volume itself, however, has not shrunk. Estimated occupancy for Osaka Prefecture, which contains the area, was 86.5% in July 2026 on an OTA-listed-inventory basis (698 properties, 110,295 rooms) — still high. What is moving is the room rate. In its offering materials for the Osaka Kitasemba hotel, CREAL states explicitly that the financial plan factors in the post-event fall in lodging and tourism demand following the close of Expo 2025 Osaka, Kansai, along with a temporary contraction in inbound demand. The 7.4% on offer can be read as the price of taking on that rate volatility.
For comparison, the listed-REIT figures: Invincible Investment Corporation reported July 2026 results across 101 domestic hotels of 86.3% occupancy (July 2026, 101 domestic hotels; 84.5% a year earlier), ADR of ¥15,100 (¥15,257 a year earlier, −1.0%) and RevPAR of ¥13,039 (+1.2%). A portfolio spread nationwide across many properties lands roughly flat year on year; narrow the lens to a single Osaka district and the rate moves by 30%. A fund under the Act, which fractionalises one specified area and one specified property, structurally passes that absence of diversification straight through into the yield it must offer.
Expected Total Distribution per ¥100,000 Unit — Three Scenarios and a Two-Axis Grid Built Only From Disclosed Figures
The target yields (4.2–10.0% a year) and target terms (12–36 months) gathered above are all figures disclosed by the operators listed in Table 2. Varying only those two, the following sets out how the expected total distribution on a ¥100,000 investment changes (pre-tax, simple interest). No assumptions of our own have been added; the formula is simple interest alone — ¥100,000 × target yield × term in months ÷ 12. Loss of principal, term extensions, early redemption, taxes and fees are not factored in.
| Scenario | Target yield | Expected total distribution | Basis for the level (disclosed figures in Table 2) |
|---|---|---|---|
| Pessimistic | 4.2% a year | ¥8,400 | December 2018 Asakusa deal; the bottom of the quoted range across the 8 deals |
| Middle | 6.0% a year | ¥12,000 | The floor since 2025 and the modal value (3 of the 7 deals with a stated yield) |
| Optimistic | 10.0% a year | ¥20,000 | July 2025 Hakata Sumiyoshi, Fukuoka deal; the top of the quoted range |
Source: compiled by MetroEngines Research & Consulting from the operator disclosures in Table 2 (the 7 deals with a stated target yield form the population). The term is fixed at 24 months, the modal value across the 8 deals.
| Target yield \ term | 12 months | 24 months | 36 months |
|---|---|---|---|
| 4.2% a year | ¥4,200 | ¥8,400 Asakusa, Dec 2018 | ¥12,600 |
| 5.0% a year | ¥5,000 | ¥10,000 Minamiboso, Jul 2019 | ¥15,000 |
| 6.0% a year | ¥6,000 | ¥12,000 TSUKI Tokyo, Apr 2025 | ¥18,000 Akasaka, Oct 2025 · Kamakura, Feb 2026 |
| 7.4% a year | ¥7,400 | ¥14,800 | ¥22,200 Osaka Kitasemba, Jun 2026 |
| 10.0% a year | ¥10,000 Hakata Sumiyoshi, Jul 2025 | ¥20,000 | ¥30,000 |
Source: compiled by MetroEngines Research & Consulting from the operator disclosures in Table 2. Shaded cells mark yield × term combinations that correspond to deals actually offered (6 cells — the 6 of the 8 deals in Table 2 that disclose both a yield and a term).
The reading is straightforward. On the same ¥100,000 unit, Hakata Sumiyoshi at 10.0% over 12 months (¥10,000) and Minamiboso at 5.0% over 24 months (¥10,000) produce the same expected total distribution. A higher yield can simply be the trade for a shorter term, and lining up annualised figures alone reveals nothing about how long the money is locked up. Conversely, Akasaka and Kamakura at 6.0% over 36 months (¥18,000) and Osaka Kitasemba at 7.4% over 36 months (¥22,200) differ by ¥4,200 for the same 36-month lock-up. What sits inside that difference is the rate volatility of the target area described in the previous section — estimated settled ADR in Chuo-ku, Osaka down 34.3% year on year. For an arranger, where a deal lands on these two axes is the way to explain whether the yield premium on offer is commensurate with the area’s volatility.
Implications for Arrangers — Scarce Vehicles, Geographic Blank Spots, Rate Volatility
Scarce vehicles also mean room to enter
Just 17 of 277 firms hold both Type 3 business and electronic transaction authorisation. Few operators can structure a whole-hotel deal online on a bankruptcy-remote basis, which makes the stack of licences itself a point of differentiation. Of the 68 firms holding both Type 3 and Type 4, only 12 also have electronic transaction authorisation.
The geography of assets and vehicles is misaligned
56.6% of operators are headquartered in Tokyo and 20 prefectures have none at all. If regional lodging assets are the target, partnerships with local operators, licensed real-estate agents and financial institutions translate directly into deal supply. The ¥100m-per-project cap on small-scale operators is a good fit for revitalising small regional inns.
Assume rate volatility from the outset
A single-area, single-property deal gets no portfolio diversification. As long as areas exist where estimated settled ADR moves 30% year on year, as in Chuo-ku, Osaka, the sensitivity of the financial plan — and how much of it is disclosed at the offering — is what separates well-designed structures from the rest.
Methodology and Sources
The operator counts come from tallying every row of MLIT’s published registers — “Licensed Operators under the Real Estate Specified Joint Enterprise Act”, “Registered Small-Scale Operators”, “Notified Operators Limited to Qualified Special Investors” and “Notified Qualified Special Investors” (all as of 31 July 2026) — one entry at a time. Business type (Types 1 to 4) and the presence of electronic transaction authorisation follow the corresponding columns in those registers, and firms holding several types are counted under each. Head-office prefecture is determined from the “location of head office or principal office” field in the same registers.
The licence-year series aggregates, by year, the dates on which licences valid as of 31 July 2026 were obtained; firms that have since surrendered a licence or wound up are excluded. It therefore does not reconstruct how many operators existed in any past year, and should be read as the distribution of when currently valid licences were granted. Fund amounts, yields and terms are quoted exactly as each operator disclosed them at the time of the offering and are not calculated by us. The lodging-market figures use, as their population, the roughly 27,000 properties and 1.26 million rooms with confirmed activity on OTAs, out of approximately 168,000 domestic properties tracked by MetroEngines Research.
⚠ A note on ADR for future dates: ADR figures in this article for months from August 2026 onward are estimates based on rates listed on OTAs at the time of the survey, and will move as the check-in date approaches. All year-on-year comparisons use only months on a finalised basis.
※ This is an editorial article analysing market structure. It is not a solicitation to invest in any particular financial product or fund. The target yields cited are quotations of figures each operator disclosed at the time of its offering and are not a guarantee of returns.
Frequently Asked Questions
What is the Real Estate Specified Joint Enterprise Act?
It is the law governing the business of pooling capital from multiple investors to buy, sell or lease physical real estate and distribute the resulting income. Enacted in 1994 and administered by MLIT, it requires a licence to operate (registration for small-scale businesses). It sits in a separate system from real-estate security tokens and REITs under the Financial Instruments and Exchange Act. As of 31 July 2026 there were 277 licensed operators and 50 registered small-scale operators.
What is the difference between Type 1 business and Type 3 or Type 4 business?
In Type 1 business the operator is itself a party to the real-estate transaction and takes in the capital, so the property sits on its own balance sheet. In Type 3 and Type 4 business a special-purpose operator (SPC) holds the property while the licensed firm is engaged to run it or acts as agent or broker for its contracts, which achieves bankruptcy remoteness. As of 31 July 2026 there were 219 Type 1 firms, 76 Type 3 and 72 Type 4.
Are there caps on small-scale business under the Act?
Yes. The caps are ¥100m in total capital per project and ¥1m per investor. The category was created by the 2017 amendment, and 50 firms were registered as of 31 July 2026. It is not sized to fund the acquisition of a whole hotel on its own, and is used instead for projects such as revitalising small regional lodging properties.
What target yields do hotel deals offer?
Lining up the offering information each operator disclosed in chronological order: the 2018 Asakusa deal in Tokyo offered 4.2% a year and the 2019 Minamiboso deal in Chiba 5.0%, whereas since 2025 the floor has been 6.0%, with 10.0% offered on the whole-building deal in Hakata, Fukuoka and 7.4% on the 168-room Kitasemba deal in Osaka. All are target figures as of the offering date and are not a guarantee of realised returns.
Related Reading
- Own a Hotel from ¥100,000 — Security Tokens Open a Third Funding Route
- Hotel Capital Allocation 2026: One Deal Took 27% of J-REIT Q1 Buying
- Regional Bank-Led Small-Scale Continuous Hotel Funds — Capital Supply vs. Large REIT Acquisitions
- Hotel Acquisition Costs 7.1%: A 6.5% Gross Yield Becomes 4.65% Net
- What Is Hotel ADR? Settled Rates 34-57% of Listed Prices, 2026
- Japan’s ¥2.83tn Hotel Room Revenue Pool: Top 5 Prefectures 48.0%
- Policy Rate 1.00%: Break-Even ADR Across Japan’s 8 Hotel Markets
References and Sources
■ Data sources
Every row of the four MLIT files comprising the “Register of Operators and Qualified Special Investors under the Real Estate Specified Joint Enterprise Act” (all as of 31 July 2026); fund information each operator disclosed at the time of its offering; MetroEngines Research & Consulting estimated settled ADR and estimated OCC (OTA-listed-inventory basis); and the listed hotel REIT ownership master (as of 24 August 2026).
■ Calculation assumptions
Expected total distribution per ¥100,000 unit is calculated on simple interest as ¥100,000 × target yield × target term in months ÷ 12. The target yields of 4.2–10.0% and terms of 12–36 months used are the actual disclosed ranges from Table 2; no assumptions of our own have been added. Taxes, fees, loss of principal, term extensions and early redemption are not factored in.
■ Limitations and caveats
Operator counts aggregate licences and registrations valid as of 31 July 2026 and exclude firms that wound up or surrendered a licence in earlier years, so they do not reconstruct how many operators existed at any past date. Firms holding several business types are counted under each. Estimated settled ADR and estimated OCC are estimates based on publicly listed OTA inventory and differ from each property’s actual transacted rates and true occupancy. Fund target yields are the figures disclosed at the time of the offering and are not a guarantee of realised returns.
■ Regulatory and operator data (primary sources)
- MLIT, “Register of Operators and Qualified Special Investors under the Real Estate Specified Joint Enterprise Act” (as of 31 July 2026)
- MLIT, “What is a licence under the Real Estate Specified Joint Enterprise Act?”
- MLIT, “Licence requirements under the Real Estate Specified Joint Enterprise Act”
■ Fund deal disclosures
- CREAL Inc., “CREAL” fund listing
- Kyushu Asia Partners Inc., press release on the launch of KAF Fund No. 2 (Hakata Sumiyoshi, Fukuoka), 30 June 2025
- LAETOLI Inc., “COZUCHI” notice, 12 March 2023
- Enjoyworks Inc., “Hello! RENOVATION” — Hayama stayable-kura fund
■ REIT and market data
- Invincible Investment Corporation, “Monthly Operating Status (July 2026)”
- MetroEngines Research & Consulting — estimated settled ADR, estimated OCC (OTA-listed-inventory basis), listed hotel REIT ownership master (as of 24 August 2026)