

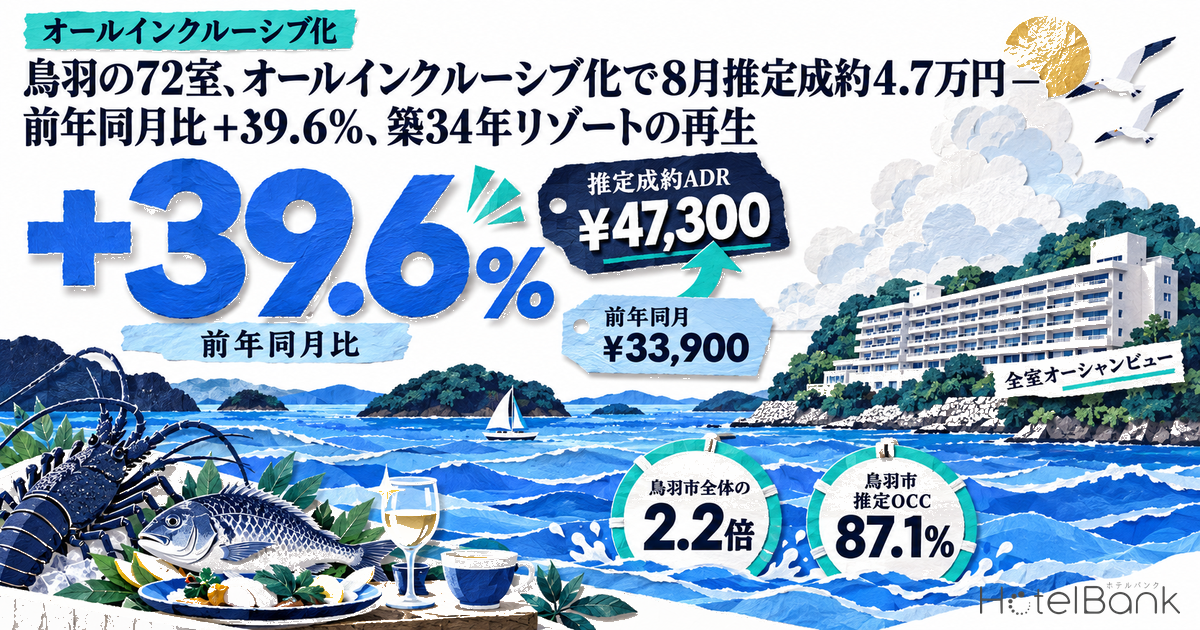
A 72-room resort hotel in Toba, Mie Prefecture, where every room faces the ocean, reopened on August 1, 2026 as Toba Ocean Resort (鳥羽オーシャンリゾート), an all-inclusive property. MetroEngines Research estimates that its settled ADR for August 2026, the first full month after the reopening, was ¥47,300. That is +39.6% above August 2025 (¥33,900) and 2.2 times the estimated settled ADR for Toba City as a whole (¥21,300).
That growth rate should not be read as a straight rise in room prices, though. Under the all-inclusive model, dinner, breakfast, drinks and lounge access are now part of the room rate, while last year’s cheapest plan was room-only. This article works through four questions in turn: how prices compare once meal conditions are matched, where the hotel sits in the city’s price distribution, what the room-only equivalent rate is after subtracting food and beverage costs, and how sensitive the payback period on the renovation is to different assumptions. Together, these put numbers on the turnaround of a large resort that opened in 1992 and is now 34 years old.
Metric Definitions Used in This Article
- ADR (Average Daily Rate): An estimated settled rate (tax-excluded equivalent), calculated by applying a property-type correction factor to the cheapest plan each property publishes on OTAs (per room, double occupancy, tax included). Checked against property-level results disclosed by listed hotel REITs (91 properties, latest 3 months), the median error is about 7%. These are estimates and differ from each property’s actual settled rates and accounting figures. Area-level ADR is the median of the properties covered (the level of a typical property in the area).
- Estimated settled ADR and meal conditions: The starting point is the cheapest plan of the day, regardless of party size or meal conditions. If the meals included in that plan change, the estimated settled ADR can move even when the room price itself does not. This property kept the same property-type classification (correction factor) before and after the reopening, so the figures include no change caused by a different factor.
- Listed price: The per-room rate for double occupancy (tax included). The meal-matched comparison (Section 3) uses the monthly average of the cheapest listed price at the last observation for each stay date.
- OCC (Occupancy Rate): Rooms sold as a share of total rooms in the area, estimated from OTA sales inventory. Because it is based on how OTA-listed inventory sells, it differs from a property’s actual occupancy.
- LT (Lead Time): Days before check-in. LT1 = the day before.
- Data source: MetroEngines Research & Consulting
Source: MetroEngines Research & Consulting
- — +39.6% Estimated settled ADR rose from ¥33,900 in August 2025 to ¥47,300 in August 2026. The comparison only uses full months before and after the reopening (August in both years).
- — Most of the rise comes from bundling food and beverage In August 2025 the cheapest plan was room-only on all 31 days. Comparing half board with all-inclusive, the increase is only +5.0% to +26.9%.
- — Highest-priced hotel with 30+ rooms in the city It ranks 5th of the 76 Toba properties with an estimate, and 1st of the 26 with 30 or more rooms. In August 2025 it was 4th among properties with 30+ rooms.
- — Still +12–27% after F&B costs Assuming food and beverage make up 30–50% of the rate and cost 30–40% of their price, the room-only equivalent rate is ¥37,900–¥43,100.
- — 9.3 years at ¥10M per room The renovation cost has not been disclosed, so this is an assumed figure. In the base case, the room-only equivalent rate rises by ¥7,000 and annual OCC is 70% (assumed), giving a simple payback of 9.3 years.
The Facts — A 1992 Resort With 72 Rooms, Closed for About 3 Months and Reopened All-Inclusive
According to an April 2026 announcement by the operator, Iconia Hospitality (アイコニア・ホスピタリティ), the property is a Mediterranean-style resort hotel that opened in 1992 in Anrakujima-cho, Toba. It has 72 rooms, all with ocean views. It closed for renovation on May 7, 2026 and reopened under the new brand Toba Ocean Resort on August 1. The new format is all-inclusive, covering food and drink, lounge service and on-site activities.
Dinner is described as a course menu using Ise-Shima ingredients such as spiny lobster, Japanese Black (Kuroge Wagyu) beef and wild red sea bream. Booking-site listings since the reopening show three dinner courses, Kisetsu (Seasonal), Tokubetsu (Special) and Kiwami (Ultimate), and the course chosen sets the price tier. By folding food and beverage into a single nightly rate, the hotel is selling a stay where guests do not expect to pay extra on site. The renovation cost has not been disclosed, so the investment calculations in this article use stated, assumed inputs.
| Item | Details |
|---|---|
| Location | Anrakujima-cho, Toba, Mie Prefecture (about 10 minutes by car from Kintetsu/JR Toba Station) |
| Opened / building age | Opened 1992 (34 years old as of 2026) |
| Rooms | 72 rooms, all with ocean views |
| Closure (renovation) | May 7 – July 31, 2026 |
| Rebrand | August 1, 2026, as Toba Ocean Resort |
| Operator | Iconia Hospitality Co., Ltd. (株式会社アイコニア・ホスピタリティ) |
| All-inclusive scope | Food and drink, lounge service, on-site activities |
| Renovation cost | Not disclosed |
Source: Compiled by MetroEngines Research & Consulting from the Iconia Hospitality press release (April 2026) and Travel Watch
Estimated Settled ADR Before and After the Reopening — August Rose From ¥33,900 to ¥47,300
Figure 1 shows the monthly estimated settled ADR, limited to months observed on most of their days. Before the renovation, the 2025 average for January–September was ¥26,000. The pattern was typical of a seaside resort, with peaks in the August summer holidays (¥33,900) and the January New Year period (¥31,000), and troughs in the June–July rainy season and in September.
After the reopening, August 2026 came in at ¥47,300, +39.6% above the ¥33,900 of a year earlier. Both are full months with all 31 days observed. Even before the closure, February–April ran +17.7% to +34.9% YoY, so the price level was already moving up around the time the rebrand was announced. An estimate that combines the cheapest plans on two booking sites gives a similar result, ¥33,900 in August 2025 and ¥47,200 in August 2026 (+39.2%), so the direction and size of the rise hold.
Source: MetroEngines Research & Consulting (estimated settled ADR, tax-excluded equivalent. Only months observed on 26 or more days are shown. No observations for October–December 2025 or June–July 2026; January 2026 had 1 observed day and May 6 days around the closure, so both are excluded)
From September 2026 onward, the figures are forward estimates based on rates listed at the time of the survey: ¥41,300 for September, ¥38,700 for October, ¥40,600 for November and ¥45,500 for December. Rates of around ¥40,000 are still listed after the summer peak. Because these can change with future price adjustments, they are not compared directly with the full month (August). They are shown separately in Table 2 for reference.
| Month | Type | Est. settled ADR | Days observed |
|---|---|---|---|
| Aug 2025 | Full month (pre-renovation) | ¥33,915 | 31 |
| Aug 2026 | Full month (post-reopening) | ¥47,338 | 31 |
| Sep 2026 | Current month (estimate from listings at survey time) | ¥41,328 | 30 |
| Oct 2026 | Estimate from listings at survey time | ¥38,656 | 31 |
| Nov 2026 | Estimate from listings at survey time | ¥40,621 | 30 |
| Dec 2026 | Estimate from listings at survey time | ¥45,506 | 31 |
Source: MetroEngines Research & Consulting (retrieved September 28, 2026. September onward are estimates based on rates listed at the time of the survey and will change)
What Is Inside the +39.6% — Half Board vs. All-Inclusive Shows a Rise of +5–27%
The estimated settled ADR starts from the cheapest plan of the day, whatever the party size or meals. Checking the meal conditions of the cheapest plan in August 2025, on one of the major booking sites the room-only plan was cheapest on all 31 days. In August 2026, by contrast, every listed plan is all-inclusive, so even the cheapest includes dinner and breakfast. The +39.6% therefore includes a switch in the starting point from room-only to half board plus drinks, and needs to be read separately from any rise in the price of the room itself.
To match meal conditions, we compared the cheapest half-board plan in August 2025 with the cheapest all-inclusive plan in August 2026, using the listed price at the last observation for each stay date (per room, double occupancy, tax included; Figure 2). On the first site, half board went from ¥42,700 to ¥44,800, +5.0%. On the second, it went from ¥34,900 to ¥44,300, +26.9%. The range is wide because last year’s cheapest half-board price differed by site, but both are smaller than +39.6%. In effect, the hotel now offers drinks, the lounge and activities on top of meals for a price only +5–27% above last year’s half-board plans.
Source: MetroEngines Research & Consulting (listed prices, per room, double occupancy, tax included. Monthly average of the cheapest listed price at the last observation for each stay date, 31 days in each month. Sites A and B are two major booking sites)
A useful reference is the price gap when the same property sells both room-only and half-board plans (a paired comparison). In Mie Prefecture in August 2026, half board cost on average +43.8% more than room-only (+¥12,000, N=48 properties), and +38.2% more (+¥19,300, N=9 properties) among resort hotels. The +39.6% rise in this property’s estimated settled ADR is close to the premium for adding two meals to a room-only stay. The natural reading is that most of the increase comes from bundling food and beverage into the package. In a separate analysis of September 2026 stays (excluding ryokan), we also split the Mie meal premium into breakfast-only and half-board steps by property type, and found the half-board step adds a further +36–39% on top of breakfast.
| Comparison | Aug 2025 | Aug 2026 | Change |
|---|---|---|---|
| Site A: cheapest room-only → cheapest all-inclusive | ¥29,057 | ¥44,788 | +54.1% |
| Site A: cheapest half board → cheapest all-inclusive | ¥42,670 | ¥44,788 | +5.0% |
| Site B: cheapest half board → cheapest all-inclusive | ¥34,901 | ¥44,280 | +26.9% |
| (Reference) Mie Prefecture: half-board premium over room-only | — | +¥12,024 | +43.8% (N=48) |
Source: MetroEngines Research & Consulting (listed prices, per room, double occupancy, tax included. The Mie premium is a paired comparison of properties selling both plan types, August 2026)
How Demand Responded — Sold Out (0 of 72 Rooms Left) by the Day Before on 22 of 31 Days in August
It is also worth checking how demand held up in the first month after the price increase. OTA availability data show that on 22 of the 31 days in August 2026, availability reached 0 of 72 rooms by the day before arrival (LT1). Over Obon, Thursday August 13 to Sunday August 16, all four days hit 0 of 72 rooms at LT3–5; on the 13th, for example, only 11 of 72 rooms were left 30 days out (LT30). The opening day, Saturday August 1, also showed 0 of 72 rooms the day before. On average in August, 30 of 72 rooms were left at LT30 and 18 at LT14, so bookings built up in the last two weeks.
Area demand also helped. Toba City’s estimated OCC for August 2026 was 87.1% (64 properties / 1,874 rooms, based on major booking-site listings), and 85.0% for ryokan only (50 properties / 1,293 rooms). By day, it stayed around 95% from Saturday August 8 to Friday August 14, then eased to the low 80s toward month-end (Figure 3). For a comparison of how August bookings in Mie built up for business hotels, ryokan and resorts (as of August 8, 2026), see our Mie August booking curves by property type.
Source: MetroEngines Research & Consulting (Toba City estimated OCC, 64 properties / 1,874 rooms, based on major booking-site listings. Estimated from how OTA-listed inventory sells; differs from actual property occupancy)
Position in Toba’s Price Distribution — 2.2x the City Level, Highest Among Hotels With 30+ Rooms
Toba City’s estimated settled ADR averaged ¥20,800 over the 12 months from September 2025 to August 2026 (N=74–81 properties), and ¥21,300 in August 2026 (N=80 properties). That is −12.6% from ¥24,300 a year earlier, so the city-wide rate did not rise. Against that backdrop, this property’s August rate stood at 2.2 times the city level, up from 1.4 times in August 2025.
Ranking the city’s properties on the two-site estimate (Figure 4), only 7 of the 76 properties with an estimated settled ADR for August 2026 were at ¥40,000 or more. This property (¥47,200) ranked 5th of 76, and the four above it are all small inns with 10 rooms or fewer. Among the 26 properties with 30 or more rooms, it ranked 1st. In August 2025 it was 4th among properties with 30+ rooms (15th of 73), so within a year it moved into the highest price band in the city for a large hotel. Entering the ¥40,000+ band, previously dominated by small high-priced inns, with 72 rooms is what sets this turnaround apart.
Source: MetroEngines Research & Consulting (Toba City properties with an estimated settled ADR: N=73 in August 2025 and N=76 in August 2026. Properties observed on 20 or more days. Two-site combined estimate)
Source: MetroEngines Research & Consulting (76 Toba City properties, estimated settled ADR for August 2026. Circle size reflects room count)
Location and Land — Undesignated City Planning Area, Land-Price Declines Narrowing
The hotel stands on the higher ground of Anrakujima-cho, facing Toba Bay. According to the MLIT Real Estate Information Library, the area is an undesignated city planning area (not divided into urbanization and urbanization-control zones), and no zoning designation could be confirmed at the hotel’s location. The nearest official land price point (Anrakujima-cho Aza Uranishi, residential) was ¥10,500/㎡ as of January 1, 2026, down 0.9% YoY. The annual decline has kept narrowing since −3.4% in 2021. The prefectural land price survey point in Takaoka-cho (Category 1 low-rise exclusive residential zone) was ¥28,200/㎡ as of July 1, 2026, down 0.7%.
Because land appreciation is unlikely to drive value here, operations and product design have to create it. This turnaround fits that pattern: the building and rooms stayed the same, and the selling price was rebuilt by bundling food, drink and experiences. On disaster risk, the hotel’s location is outside Mie Prefecture’s tsunami inundation zones (zones of 1–2 m are mapped along the coast within the same map area).
| Point | 2021 | 2023 | 2025 | 2026 | 2026 YoY |
|---|---|---|---|---|---|
| Anrakujima-cho Aza Uranishi (official land price, residential) | 11,300 | 10,800 | 10,600 | 10,500 | −0.9% |
| Takaoka-cho (prefectural land price survey, residential) | 29,600 | 28,800 | 28,400 | 28,200 | −0.7% |
Source: Compiled by MetroEngines Research & Consulting from the MLIT Real Estate Information Library (official land prices, prefectural land price survey, zoning, tsunami inundation projections)
Room-Only Equivalent Rate After F&B Costs — ¥37,900–¥43,100 Depending on Assumptions
An all-inclusive rate mixes payment for the room with payment for food, drink and the lounge. For an investment decision, the figure to compare is what remains for the room after subtracting the cost of food and beverage. Starting from the August 2026 estimated settled ADR (¥47,338), we assumed a food-and-beverage share of the rate and an F&B cost ratio (food and drink), and estimated room-only equivalent rate = ADR × (1 − F&B share × cost ratio) (Table 5).
With an F&B share of 30–50% and a cost ratio of 30–40%, the room-only equivalent rate is ¥37,900–¥43,100, which is +11.7% to +27.0% above the August 2025 estimated settled ADR (¥33,900, based on the room-only plan). Even after subtracting F&B costs, the rate still comes out above last year’s level.
| F&B share of rate \ Cost ratio | 30% | 35% | 40% |
|---|---|---|---|
| 30% | 43,078 (+27.0%) | 42,368 (+24.9%) | 41,657 (+22.8%) |
| 40% | 41,657 (+22.8%) | 40,711 (+20.0%) | 39,764 (+17.2%) |
| 50% | 40,237 (+18.6%) | 39,054 (+15.2%) | 37,870 (+11.7%) |
Source: MetroEngines Research & Consulting (estimate based on the estimated settled ADR. F&B share and cost ratio are assumed values)
Three caveats apply. First, F&B labor, lounge operating costs and activity costs are not included. The cost ratio covers only the variable cost of food and drink, so the contribution to GOP is smaller still. Second, before the renovation the hotel was already earning F&B gross profit from half-board bookings. Because the comparison base (¥33,900) is an estimate built on the room-only plan, the real increase may be smaller than the growth rates in Table 5. Third, August is the peak month of the year, and the same increase may not last all year. The payback calculation in the next section reflects these points by splitting the increase into low, mid and high cases.
Payback on the Renovation Capex — 9.3 Years in the Base Case at ¥10M per Room
Because the renovation cost has not been disclosed, we assumed three levels: ¥5M, ¥10M and ¥15M per room (¥360M, ¥720M and ¥1.08B for 72 rooms). Incremental annual GOP = rooms sold per year × increase in room-only equivalent rate × incremental GOP flow-through. Using the August range (+¥4,000 to +¥9,200 YoY after F&B costs) as a guide, we set the increase at three levels, ¥4,000, ¥7,000 and ¥10,000, and assumed that 60% of the increase remains as GOP after labor and operating costs. Annual OCC is assumed at 70%, with 60% and 80% shown as sensitivities.
| Increase in room-only equivalent rate \ Investment (per room) | ¥5M (¥360M) | ¥10M (¥720M) | ¥15M (¥1.08B) | Incremental annual GOP |
|---|---|---|---|---|
| ¥4,000 (low) | 8.2 | 16.3 | 24.5 | ¥44.2M |
| ¥7,000 (mid) | 4.7 | 9.3 | 14.0 | ¥77.3M |
| ¥10,000 (high) | 3.3 | 6.5 | 9.8 | ¥110.4M |
Source: MetroEngines Research & Consulting (estimate. 72 rooms × 365 days × 70% annual OCC = 18,396 rooms sold per year; incremental GOP flow-through 60%. Investment, OCC and flow-through are all assumed values)
| Annual OCC (assumed) | Rooms sold per year | ¥5M/room | ¥10M/room | ¥15M/room |
|---|---|---|---|---|
| 60% | 15,768 | 5.4 | 10.9 | 16.3 |
| 70% | 18,396 | 4.7 | 9.3 | 14.0 |
| 80% | 21,024 | 4.1 | 8.2 | 12.2 |
Source: MetroEngines Research & Consulting (estimate. OCC is an assumed annual value)
The base case (¥10M per room, a ¥7,000 increase, 70% annual OCC) gives a simple payback of 9.3 years. Working backward, the increase in room-only equivalent rate needed to pay back in 10 years is about ¥3,300 at ¥5M per room, about ¥6,500 at ¥10M and about ¥9,800 at ¥15M. Compared with the August range (+¥4,000 to +¥9,200), a renovation of ¥5M–¥10M per room could pay back within 10 years if the peak-season increase is broadly kept up through the year. At ¥15M per room, payback depends on how far off-season rates can be raised.
Construction costs also need watching. According to MLIT’s Building Construction Statistics, hotel construction costs averaged ¥1.95M per tsubo (about 3.3 ㎡) across all structure types in 2024, up 41% in two years from ¥1.38M in 2022. When new builds struggle to pencil out, turnaround investments that reuse existing buildings gain a relative advantage, but renovation costs themselves also tend to rise. In practice, it helps to include the timing of the estimate and the construction schedule in the sensitivity analysis.
Implications for Large Resorts Over 30 Years Old — A Turnaround That Rebuilds What the Rate Contains
For owners of large resorts over 30 years old, turnaround funds, management-contract operators and regional banks considering loans, this case raises three points.
1. Evaluate rate increases together with their conditions
Most of the +39.6% comes from bundling food and beverage. With meal conditions matched the rise is +5–27%, and on a room-only equivalent basis after F&B costs it is +12–27%. In investment and credit reviews, building the business plan on meal-matched rates rather than the headline growth rate reduces swings in the valuation.
2. A large hotel entering the small luxury-inn price band
Of the 7 Toba properties at ¥40,000 or more, this is the only one with 30+ rooms. By bundling food, drink and experiences around an existing strength such as ocean views from every room, it moved into a price band led by small inns while keeping all 72 rooms. With that much room supply, a higher rate has a large effect on total revenue.
3. Off-season rates decide the payback
Demand is easy to attract in the August peak. In the payback sensitivity, a ¥10M-per-room renovation pays back in 16.3 years with a ¥4,000 increase but 6.5 years with ¥10,000. The upside lies in turning the all-inclusive stay, where everything happens on site, into a draw for weekdays and the off-season.
One more point: going all-inclusive also means the hotel takes on all food and beverage costs and staffing itself. The range of drinks offered, the lounge’s opening hours and the activities on offer are design variables that directly drive the cost ratio and GOP flow-through. For how different all-inclusive formats, such as free-flow drinks or free lounges, lift rates, based on examples from across Japan, see All-Inclusive Japan 2026: Free Drinks, Lounges & the +40.7% Meal Lift. Replacing the assumptions in Tables 5 and 6 with your own property’s conditions gives a quick sense of whether the same approach could work there. The hotel has been open for only two months since the reopening, and we plan to revisit these figures once more full months from autumn onward are available.
⚠ Note on ADR for future dates: In this article, estimated settled ADRs for September 2026 onward are based on rates listed on OTAs at the time of the survey (September 28, 2026) and will change as check-in dates approach. YoY changes are calculated only between full months (August).
Methodology
- The estimated settled ADR is the monthly average of the cheapest daily plan price (regardless of party size or meal conditions) multiplied by a property-type correction factor (tax-excluded equivalent). This property’s type classification was the same before and after the reopening. The headline figure and YoY change use an estimate from one major booking site; the city distribution (Figure 4 and the map) uses a combined two-site estimate.
- The meal-matched comparison (Table 3, Figure 2) uses the monthly average of the cheapest listed price at the last observation for each stay date (per room, double occupancy, tax included), which is calculated on a different basis from the estimated settled ADR.
- Toba City’s estimated OCC covers 64 properties / 1,874 rooms (based on major booking-site listings). Availability trends use only observations within LT45.
- The investment amount, F&B share, cost ratio, GOP flow-through and annual OCC used in the investment calculations are all assumed values. An actual investment decision requires a detailed feasibility study.
Related Articles
- Japan Liquor Tax Oct 2026: Draft Beer −¥9.1, Chu-hai +¥7.0 for Hotels
- Japan FY2025 Travel Spend ¥8.39tn: Growth Went Outside the Room Bill
- All-Inclusive Japan 2026: Free Drinks, Lounges & the +40.7% Meal Lift
- Mie August Booking Curves: Business Hotels Swing 25.5pt, Ryokan 9.7pt
References and Sources
■ Data sources
Estimated settled ADR from MetroEngines Research & Consulting (for this property, August 2025 and August 2026 are both full months with 31 days observed; Toba City N=80 properties in August 2026), listed prices on two major booking sites (per room, double occupancy, tax included), Toba City estimated OCC (August 2026, 64 properties / 1,874 rooms) and availability trends within LT45. Location and land prices are from the MLIT Real Estate Information Library, construction costs from MLIT’s Building Construction Statistics, and the turnaround overview from the operator’s press release (April 2026).
■ Calculation assumptions
Room-only equivalent rate = estimated settled ADR × (1 − F&B share × cost ratio). F&B share 30–50%, cost ratio 30–40% (variable food and drink costs only). Because the renovation cost has not been disclosed, ¥5M, ¥10M and ¥15M per room are assumed. Incremental annual GOP = 72 rooms × 365 days × annual OCC × increase in room-only equivalent rate (¥4,000, ¥7,000, ¥10,000) × 60% GOP flow-through. Annual OCC is 70% in the base case, with 60% and 80% sensitivities. Payback is a simple payback period that ignores discounting, interest, taxes and depreciation.
■ Limitations
The estimated settled ADR applies a correction factor to the cheapest plan and differs from actual settled rates and accounting figures. The only full month after the reopening is August 2026, which is the peak month of the year. Because last year’s base is a room-only plan, the actual increase including F&B gross profit may be smaller than estimated. F&B labor and lounge operating costs are not included in the cost ratio. Figures from September onward are estimates based on listings at the time of the survey (September 28, 2026) and will change. An actual investment decision requires a property-specific feasibility study.
■ Market data
- MetroEngines Research & Consulting — estimated settled ADR (this property and 76 Toba City properties), listed prices, estimated OCC (Toba City, 64 properties / 1,874 rooms), availability trends, paired comparison of meal premiums (Mie Prefecture, N=48 properties)
■ Government statistics and public data
- MLIT Real Estate Information Library — official land prices, prefectural land price survey, zoning, tsunami inundation projections
- MLIT “Building Construction Statistics” (建築着工統計調査)
■ News and press releases