

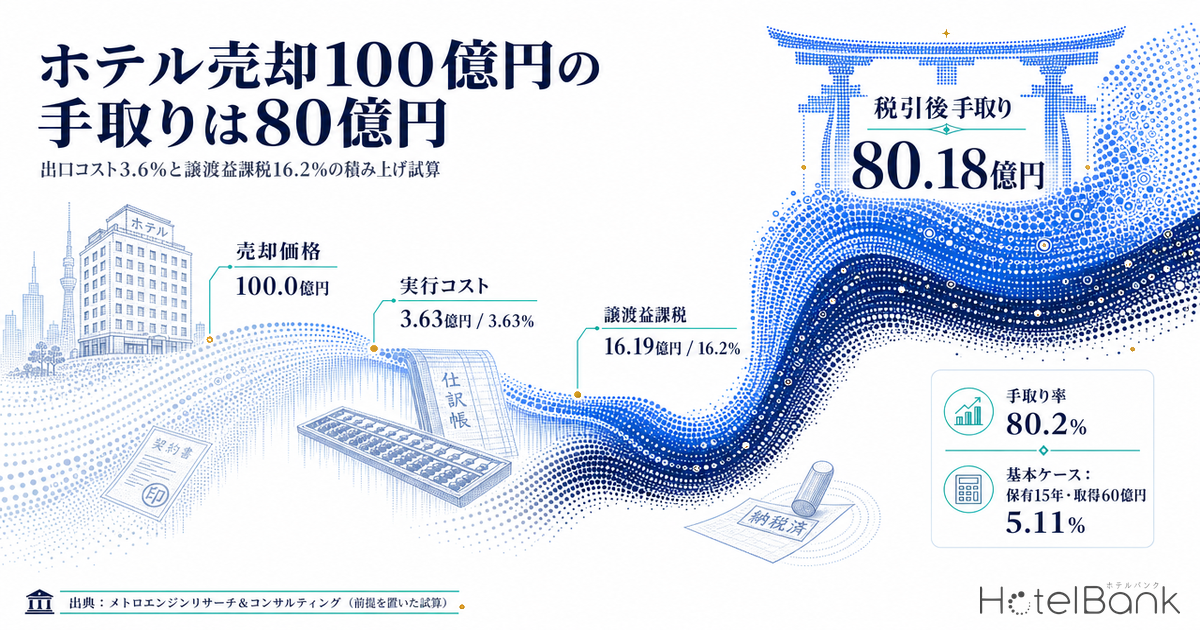
For the seller of a hotel, what drives the decision is often not the headline sale price itself but “what gets deducted from that price, and how much is ultimately left in hand.” Add up brokerage fees, due diligence support, and corporate taxes on the capital gain, and a ¥10 billion sale leaves the seller with roughly ¥8 billion. This article breaks that gap down item by item and estimates how net proceeds shift by price band, holding period, and the legal form of the seller.
Metric Definitions Used in This Article
- ADR (Average Daily Rate): An estimated settled rate (tax-exclusive equivalent), calculated by applying segment-specific adjustment factors to the lowest-plan rate each property publishes on OTAs (per room, two guests, tax-inclusive). Cross-checked against property-level results disclosed by listed hotel REITs (91 properties, most recent 3 months), the median error is about 7%. These are estimates and differ from each property’s actual contracted rates and accounting figures. Area-level ADR is the median of the covered properties (the level of a typical property in the area).
- Transaction costs: In this article, the total costs borne by the seller from the sale decision through closing (brokerage/advisory fees, stamp duty, registration costs, due diligence support, trust-related costs, and legal/settlement work). Their ratio to the sale price is called the “transaction cost ratio.”
- Net proceeds: The amount remaining after deducting transaction costs and tax on the capital gain from the sale price. Its ratio to the sale price is called the “net proceeds ratio.”
- Data sources: MetroEngines Research & Consulting; public materials from the National Tax Agency, the Ministry of Land, Infrastructure, Transport and Tourism (MLIT), and others
- — On a ¥10 billion sale, after-tax net proceeds come to ¥8.018 billion. With transaction costs of 3.62% and capital gains tax of 16.19%, roughly 20% of the sale price never reaches the seller.
- — 91% of transaction costs is brokerage/advisory fees. Transfer-tax-like items such as stamp duty and registration costs together amount to less than 0.02% of the sale price.
- — The net proceeds ratio converges to 79.7–80.3% across every price band from ¥3 billion to ¥30 billion. A tenfold change in price moves it by only 0.6 points.
- — Four variables can be moved: the replacement-asset special provision with 80% deferral (+12.9pt), the selling entity (individual long-term transfer, +8.1pt), the holding period (11.4pt between 3 and 39 years), and negotiating the brokerage fee rate (+1.3pt).
- — IRR models that plug the sale price straight into the exit cash flow overstate the exit by about 20%. The effective cap rate is 5.11%, not 4.10%.
Scope of This Article — Where It Differs from Four Earlier Pieces
HotelBank has published four earlier articles on the costs and taxation of hotel capital transactions. This article covers ground none of them overlaps: the seller’s transaction costs and what is left after tax. To avoid confusion, we draw the boundaries first.
| Earlier article | Topic covered | Relation to this article |
|---|---|---|
| (a) “Hotel Acquisition Costs 7.1%“ | The buyer’s acquisition costs, and how a 6.5% gross yield falls to a 4.65% net yield | Buyer’s perspective. Cited here as a premise only; not recalculated |
| (b) “Three Hotel Acquisition Vehicles“ | How transfer taxes at acquisition (real estate acquisition tax, registration and license tax) change with the choice of vehicle | Taxes at acquisition. This article covers costs and income taxes at disposal |
| (c) “Ryokan Succession Tax Deadline Dec 2027“ | Succession of (own-company) shares and the deadline of the tax deferral scheme | Share succession. This article focuses on asset transfers (asset deals) |
| (d) “Foreign PE value-add strategies and the conditions for IRR to work” and other sale-pipeline articles | The supply-demand structure of who is selling | Seller attributes. This article covers costs and taxes incurred regardless of how the sale is structured |
Bottom Line — Sell for ¥10 Billion, Keep ¥8 Billion
The base case assumes a property acquired for ¥6.0 billion (35% land, 65% building), held for 15 years, and sold for ¥10.0 billion. The building is assumed to be a steel-reinforced concrete hotel, depreciated on a straight-line basis over its 39-year statutory useful life. On these assumptions, accumulated depreciation is ¥1.50 billion and the book value immediately before sale is ¥4.50 billion.
Working backward, the capital gain is ¥5.138 billion (sale price ¥10.0 billion − book value ¥4.50 billion − transaction costs ¥362 million). Applying the 31.52% statutory effective tax rate gives ¥1.619 billion paid out in corporate taxes. Combined with transaction costs, that is ¥1.982 billion — in other words, about 20% of the sale price never reaches the seller.
This structure is the mirror image of the buyer-side story in earlier article (a), where “a 6.5% gross yield becomes 4.65% net.” The same thing happens on the sell side. According to the Japan Real Estate Institute’s 54th Real Estate Investor Survey (as of April 2026), the expected yield (cap rate) for limited-service hotels in Tokyo is 4.1%, down 0.1 points from the previous survey. If a ¥10 billion price were set at that level, the corresponding NOI would be ¥410 million. But since only ¥8.018 billion is left in hand, the effective exit cap rate from the seller’s perspective rises to the equivalent of 5.11%. In this base case, there is a 1.01-point gap between the headline cap rate and the cap rate on net proceeds.
Building Up Transaction Costs Item by Item — Brokerage Fees Dominate
So what makes up the ¥362 million in transaction costs? The table below lists each item with its basis of calculation and amount.
| Item | Basis of calculation | ¥10bn case | % of price | Nature |
|---|---|---|---|---|
| Brokerage fee | Fee cap under the Real Estate Brokerage Act (3% on the portion above ¥4 million; shortcut formula: price × 3% + ¥60,000), plus 10% consumption tax | ¥330.07M | 3.30% | Rate-based |
| Due diligence support | Responding to engineering reports, real estate appraisal, legal and environmental reviews; building a data room, etc. (assumed value) | ¥20M | 0.20% | Largely fixed |
| Legal & settlement work | Legal fees for negotiating the sale agreement and representations & warranties, and for settlement with tenants/operators (assumed value) | ¥8M | 0.08% | Largely fixed |
| Trust-related costs | Beneficiary change procedures and interim settlement of trust fees where the asset is already held as a trust beneficiary interest (assumed value) | ¥3M | 0.03% | Largely fixed |
| Registration costs | Registration and license tax for cancelling mortgages (¥1,000 per property, capped at ¥20,000) + judicial scrivener fees | ¥500K | 0.01% | Fixed |
| Stamp duty | Reduced rate on real estate transfer agreements (¥480,000 for amounts above ¥5 billion). The reduction applies to documents executed through March 31, 2027 | ¥480K | 0.005% | Tiered |
| Total | — | ¥362.05M | 3.62% | — |
The table makes one thing obvious: 91% of transaction costs is explained by the brokerage fee alone. Stamp duty of ¥480,000 is 0.005% of the sale price, and registration costs just 0.01%. On the acquisition side, transfer taxes — real estate acquisition tax and registration and license tax — weigh in at several percent (see earlier article (b)), whereas on the disposal side transfer taxes barely matter. This is because Japanese business practice has the buyer bear the registration and license tax for the ownership transfer, leaving the seller responsible only for registration costs to cancel mortgages.
In other words, sale transaction costs effectively come down to a single question: how brokerage and advisory fees are structured. The Real Estate Brokerage Act only sets a ceiling, and large transactions rarely pay the full statutory amount. If a negotiated rate of 1.2% (excluding tax) were agreed, transaction costs in the ¥10 billion case would fall to ¥164 million, or 1.64% of the price — ¥198 million less than under the cap.
Varying the price across ¥3 billion, ¥10 billion, and ¥30 billion, the transaction cost ratio declines gently from 4.36% to 3.62% to 3.41%. The decline comes from roughly ¥31.5 million in largely fixed items — due diligence and legal costs — being diluted against a larger sale price. But the drop is less than one point. As long as rate-based brokerage fees dominate, economies of scale work only to a limited degree; that is the fact this table shows.
Asset Deals vs. Share Transfers — Different Fee Structures
One more point needs care when structuring costs: cases where brokerage fees and financial advisory (FA) fees are stacked on top of each other. In an asset deal, where the property itself is transferred, the fee regulations of the Real Estate Brokerage Act apply. In a scheme that transfers the shares of the operating company, the Act does not apply, and the Lehman formula common in M&A practice is used instead.
| Structure | Fee basis | ¥3bn | ¥10bn | ¥30bn | Notes |
|---|---|---|---|---|---|
| Asset deal | Fee cap under the Real Estate Brokerage Act (3% + ¥60,000 + consumption tax) | ¥99.07M 3.30% | ¥330.07M 3.30% | ¥990.07M 3.30% | A ceiling; room to negotiate |
| Share transfer (M&A) | Lehman formula (5% up to ¥500M / 4% for ¥500M–¥1bn / 3% for ¥1–5bn / 2% for ¥5–10bn / 1% above ¥10bn) | ¥105M 3.50% | ¥265M 2.65% | ¥465M 1.55% | Minimum success fees are often set |
Because the Lehman formula’s rate tapers as the transaction grows, a ¥30 billion deal comes in at 1.55% — less than half the Real Estate Brokerage Act cap (3.30%). Conversely, at ¥3 billion it is 3.50%, above the cap. Around ¥5 billion is the crossover point, and the larger the deal, the more the share-transfer fee structure works in the seller’s favor. However, this compares fees in isolation. Share transfers raise separate issues: the risk of inheriting off-balance-sheet liabilities, the tax basis for capital gains (the acquisition cost of the shares), and the interaction with the business succession tax scheme (earlier article (c)). The choice of structure is not simply about lower fees.
After-Tax Net Proceeds — Depreciation Inflates the Capital Gain
While transaction costs top out at 3–4%, it is tax that moves the net proceeds ratio significantly. And what determines that tax is not the sale price but the book value — that is, how many years the asset was held and how far it has been depreciated.
When a corporation sells an asset, the capital gain is combined with its other income and subject to corporate taxes. There is no separate taxation or long-term/short-term distinction as there is for individuals. The applicable statutory effective tax rate for a Tokyo-based corporation subject to size-based enterprise tax has been raised from 30.62% to 31.52%, reflecting the newly created Defense Special Corporation Tax (a 4% surtax on corporate tax) for fiscal years beginning on or after April 1, 2026.
This is where accumulated depreciation comes into play. Hotels have a high building ratio, and book value falls by the depreciation expensed each period during the holding period. That decline surfaces all at once as capital gain at the time of sale. In the base case (acquisition ¥6.0 billion, building ¥3.9 billion, 39-year statutory useful life, straight-line), about ¥100 million is depreciated annually — ¥1.50 billion over 15 years. That amount pushes up the capital gain one-for-one, resulting in an additional tax burden of ¥473 million at 31.52%.
| Holding period | Accumulated depreciation | Book value at sale | Capital gain | Corporate taxes (31.52%) | After-tax net proceeds | Net proceeds ratio |
|---|---|---|---|---|---|---|
| 3 years | ¥0.30bn | ¥5.70bn | ¥3.94bn | ¥1.241bn | ¥8.397bn | 84.0% |
| 5 years | ¥0.50bn | ¥5.50bn | ¥4.14bn | ¥1.304bn | ¥8.334bn | 83.3% |
| 10 years | ¥1.00bn | ¥5.00bn | ¥4.64bn | ¥1.462bn | ¥8.176bn | 81.8% |
| 15 years (base case) | ¥1.50bn | ¥4.50bn | ¥5.14bn | ¥1.619bn | ¥8.018bn | 80.2% |
| 20 years | ¥2.00bn | ¥4.00bn | ¥5.64bn | ¥1.777bn | ¥7.860bn | 78.6% |
| 25 years | ¥2.50bn | ¥3.50bn | ¥6.14bn | ¥1.934bn | ¥7.703bn | 77.0% |
| 39 years (fully depreciated) | ¥3.90bn | ¥2.10bn | ¥7.54bn | ¥2.376bn | ¥7.262bn | 72.6% |
At the same ¥10 billion price, a 3-year hold leaves ¥8.397 billion in net proceeds, while a sale after 39 years, when depreciation is complete, leaves ¥7.262 billion. The difference is ¥1.135 billion, or 11.4 percentage points. Varying the sale price tenfold, from ¥3 billion to ¥30 billion, barely moved the net proceeds ratio (79.7% to 80.3%), whereas changing the holding period moves it by more than 10 points. What determines exit proceeds is not the price band but how far depreciation has progressed.
This asymmetry has practical implications when setting IRR exit assumptions. Extending the hold period increases interim cash flow and capital gains, but it also reliably increases the tax burden at exit in proportion to depreciation taken. Running hold-period sensitivity analysis on sale price alone misses this effect.
Special Provision for Replacement of Specified Assets — Lifting Net Proceeds from 80.2% to 93.1%
The scheme most widely used in practice to reduce capital gains tax is the special taxation provision for replacement of specified assets (compressed book entry) under Article 65-7 of the Act on Special Measures Concerning Taxation. When a company sells land and buildings in Japan held for more than 10 years and, in the same fiscal year, acquires qualifying replacement assets and puts them into business use, tax on a set portion of the gain can be deferred through compressed book entry.
Under the FY2026 tax reform, the application deadline for this provision was extended by three years to sales made by March 31, 2029. At the same time, the deferral ratio for replacements through urban redevelopment projects (Item 2) was cut from 80% to 60%, and for replacements of long-held land (Item 3), qualifying replacement buildings and fixtures were limited to those “used for specified facilities.” These revisions apply to sales on or after April 1, 2026.
| Category | Deferral ratio | Notes |
|---|---|---|
| General rule (replacement of long-held land and buildings) | 80% | Compression limit = base acquisition cost × gain ratio × 80/100 |
| From outside concentrated areas into Tokyo’s 23 wards (with head office relocation) | 60% | Intended to curb concentration in central Tokyo |
| From outside concentrated areas into Tokyo’s 23 wards (without head office relocation) | 70% | — |
| From outside concentrated areas into designated concentrated areas under the Act on Regional Revitalization | 75% | — |
| From Tokyo’s 23 wards to outside concentrated areas (with head office relocation) | 90% | Preferential category encouraging relocation to regions |
| Replacement through urban redevelopment projects (Item 2) | 60% | Cut from 80% in the FY2026 reform |
If the general 80% compression could be applied to the base case (capital gain ¥5.138 billion), the taxable gain for the period would shrink to ¥1.028 billion, and corporate taxes would fall from ¥1.619 billion to ¥324 million. ¥1.296 billion is deferred, net proceeds rise to ¥9.314 billion, and the net proceeds ratio improves 12.9 points, from 80.2% to 93.1%. The exit cap rate on net proceeds also falls 0.71 points, from 5.11% to 4.40%.
For Ryokan Owners — Individual vs. Corporation Moves Net Proceeds by 13.9 Points
For ryokan owners who choose to sell at the point of succession, the taxation framework itself changes depending on whether the seller is an individual or a family-owned corporation. When an individual sells business-use land and buildings, the gain is separately taxed as capital gains income: a long-term transfer (held more than 5 years) is taxed at 20.315% (15% income tax + 0.315% Special Reconstruction Income Tax + 5% resident tax), and a short-term transfer (5 years or less) at 39.63% (30% income tax + 0.63% Special Reconstruction Income Tax + 9% resident tax). The Special Reconstruction Income Tax surcharge applies through 2037.
For comparison, consider a ryokan with a ¥3.0 billion sale price, acquired for ¥1.2 billion (building ¥780 million, land ¥420 million), held for 25 years, with a depreciated book value of ¥700 million.
| Selling entity / category | Applicable rate | Capital gain | Tax | After-tax net proceeds | Net proceeds ratio |
|---|---|---|---|---|---|
| Individual, long-term transfer (over 5 years) | 20.315% | ¥2.169bn | ¥441M | ¥2.428bn | 80.9% |
| Family-owned corporation (subject to size-based enterprise tax) | 31.52% | ¥2.169bn | ¥684M | ¥2.185bn | 72.8% |
| Individual, short-term transfer (5 years or less) | 39.63% | ¥2.169bn | ¥859M | ¥2.009bn | 67.0% |
Between an individual’s long-term and short-term transfers, the same ¥2.169 billion capital gain generates tax of ¥441 million versus ¥859 million — a 13.9-point gap in the net proceeds ratio. Whether a transfer is long-term or short-term is determined by whether the holding period exceeds 5 years as of January 1 of the year of sale, so the tax rate can nearly double depending solely on which side of a year-end the sale falls. Assets acquired by inheritance carry over the decedent’s holding period, so even a sale immediately after succession often qualifies as a long-term transfer.
If a family-owned corporation holds the asset instead, the 31.52% rate applies and the net proceeds ratio is 8.1 points lower than for an individual long-term transfer. However, this applies when the corporation sells the asset (the real estate). If the owner adopts a scheme that sells the corporation’s shares outright, the gain is taxed at 20.315% as the individual shareholder’s capital gain on shares. The tax rate on the same economic substance can differ by more than 10 points depending on whether you sell the property or the company. Decisions at the point of succession start with this choice. Own-company share valuation and the business succession tax scheme deadline are covered in earlier article (c); rising inheritance-tax land valuations (rosenka) are a further factor pushing ryokan owners toward capital restructuring.
Where to Set the Exit Price — What Buyers Are Actually Paying
The net proceeds calculation takes the sale price as given. So where should that sale price be set? The standard approach is NOI ÷ cap rate, but here we check the price levels buyers are actually transacting at, using acquisition records of listed hotel REITs.
Our REIT ownership master (snapshot as of August 31, 2026) registers 302 properties held by 7 listed REITs. Of these, we aggregated acquisitions from 2013 onward by year for the 6 REITs and 287 properties for which acquisition date, acquisition price, and room count are consistently available.
| Year | Acquisitions | Total acquisition value | Acquisition price per room |
|---|---|---|---|
| 2019 | 24 | ¥127.2bn | ¥31.6M |
| 2020 | 8 | ¥37.7bn | ¥23.3M |
| 2021 | 5 | ¥26.2bn | ¥36.4M |
| 2022 | 3 | ¥4.9bn | ¥12.3M |
| 2023 | 13 | ¥83.1bn | ¥39.9M |
| 2024 | 14 | ¥110.2bn | ¥43.8M |
| 2025 | 21 | ¥68.3bn | ¥28.2M |
From a trough of 3 deals worth ¥4.9 billion in 2022, acquisitions have clearly recovered: 13 deals and ¥83.1 billion in 2023, 14 deals and ¥110.2 billion in 2024, and 21 deals and ¥68.3 billion in 2025. Whose capital is funding this resumption, and how it is allocated, is broken down by year in our article Hotel Capital Allocation 2026. The acquisition price per room rose from ¥12.3 million in 2022 to ¥43.8 million in 2024, a 3.6-fold increase. The decline to ¥28.2 million in 2025 is not a price drop but a composition effect: that year’s acquisitions were weighted toward regional onsen ryokan and resort properties with lower per-room prices.
Lining up recent individual acquisitions shows how wide the per-room price range is. A lodging property in Nippori, Tokyo, acquired in July 2024 had 128 rooms and cost ¥16.335 billion — ¥127.6 million per room. Two-hundred-room-class city hotels in Kyushu acquired the same month ranged from ¥16.3 million to ¥29.2 million per room. Even within the same acquisition cycle, per-room prices differ eightfold depending on location and grade. Applying an area’s typical per-room price directly to your own property can badly miss the mark on pricing.
| Acquired | Property | Rooms | Acquisition price | Per room |
|---|---|---|---|---|
| Jul 2024 | Art Hotel Nippori Lungwood (アートホテル日暮里 ラングウッド), Tokyo | 128 | ¥16.335bn | ¥127.6M |
| Jul 2024 | Art Hotel Osaka Bay Tower & Sorani Onsen (アートホテル大阪ベイタワー&空庭温泉), Osaka | 454 | ¥31.185bn | ¥68.7M |
| Jul 2024 | Hakodate Kokusai Hotel (函館国際ホテル), Hokkaido | 435 | ¥16.830bn | ¥38.7M |
| Feb 2025 | Nest Hotel Hakata Station (ネストホテル博多駅前), Fukuoka | 160 | ¥6.500bn | ¥40.6M |
| Aug 2025 | Kamenoi Hotel Toba (亀の井ホテル 鳥羽), Mie | 62 | ¥4.732bn | ¥76.3M |
| Aug 2025 | Irago Ocean Resort (伊良湖オーシャンリゾート), Aichi | 148 | ¥6.900bn | ¥46.6M |
| Dec 2025 | APA Hotel Namba Kita Shinsaibashi-Ekimae (アパホテル〈なんば北心斎橋駅前〉), Osaka | 162 | ¥4.850bn | ¥29.9M |
The funding environment on the buy side is also a tailwind. According to CBRE, domestic commercial real estate investment (deals of ¥1 billion or more) in January–March 2026 rose 2% year on year to ¥2.043 trillion, a record for a single quarter. In the Japan Real Estate Institute’s 54th Real Estate Investor Survey (as of April 2026), the expected yield for limited-service hotels in Tokyo fell 0.1 points from the previous survey to 4.1%, meaning investors’ required yields are still trending down. From the seller’s perspective, a lower cap rate means a higher price for the same NOI.
The Numerator of Exit Price — Reading Current NOI
If the cap rate is the denominator, NOI is the numerator. We check where operating metrics stand today using our estimated settled ADR and the monthly disclosures of listed REITs.
According to MetroEngines Research’s estimated settled ADR, Tokyo’s average over the latest 12 months (August 2025–July 2026) was ¥14,631, up +7.2% from ¥13,651 in the prior-year period. On a monthly basis, it peaked at ¥17,830 in April 2026 (1,144 properties covered) and was ¥12,642 in July 2026 (1,136 properties).
Listed REITs’ monthly disclosures point in the same direction. Invincible Investment Corporation (インヴィンシブル投資法人) reported July 2026 results for its 101 domestic hotels: RevPAR of ¥13,039, up 1.2% year on year, and occupancy of 86.3% (July 2026, 101 domestic properties), up 1.9 points. Japan Hotel REIT Investment Corporation (ジャパン・ホテル・リート投資法人) reported RevPAR of ¥18,119 (+5.1%) and occupancy of 83.1% (July 2026, hotels with variable rent, etc.), up 4.0 points, for its hotels with variable rent. Ichigo Hotel REIT Investment Corporation (いちごホテルリート投資法人) posted RevPAR of ¥8,175, a slight decline of 1.6%, and Hoshino Resorts REIT (星野リゾート・リート投資法人) reported RevPAR of ¥13,716 for June 2026, down 6.4%.
Direction varies with portfolio composition, but urban lodging-focused properties are keeping RevPAR above prior-year levels. When setting exit NOI assumptions, the key fork is whether to extend current levels or to build in a phase where ADR growth slows. The double optimism of assuming strong future occupancy and rates while also assuming a low cap rate is a common cause of badly mispriced exits.
End-to-End Estimates — ¥3 Billion, ¥10 Billion, and ¥30 Billion
We now run the cost items and tax rates discussed so far end to end for three price bands. The common assumptions are: acquisition price = 60% of sale price, 65% building ratio, 39-year statutory useful life with straight-line depreciation, 15-year hold, the seller is a Tokyo-based corporation subject to size-based enterprise tax, and the brokerage fee is at the Real Estate Brokerage Act cap.
| Item | Case A | Case B (base) | Case C |
|---|---|---|---|
| Sale price | ¥3.000bn | ¥10.000bn | ¥30.000bn |
| Brokerage fee (cap) | −¥99.1M | −¥330.1M | −¥990.1M |
| Due diligence support | −¥20.0M | −¥20.0M | −¥20.0M |
| Legal & settlement work | −¥8.0M | −¥8.0M | −¥8.0M |
| Trust-related costs | −¥3.0M | −¥3.0M | −¥3.0M |
| Registration costs | −¥0.5M | −¥0.5M | −¥0.5M |
| Stamp duty (reduced rate) | −¥0.32M | −¥0.48M | −¥0.48M |
| Total transaction costs | −¥130.9M 4.36% | −¥362.0M 3.62% | −¥1,022.0M 3.41% |
| Book value at sale (15-year hold) | ¥1.350bn | ¥4.500bn | ¥13.500bn |
| Capital gain | ¥1.519bn | ¥5.138bn | ¥15.478bn |
| Corporate taxes (31.52%) | −¥479M 16.0% | −¥1,619M 16.2% | −¥4,879M 16.3% |
| After-tax net proceeds | ¥2.390bn | ¥8.018bn | ¥24.099bn |
| Net proceeds ratio | 79.7% | 80.2% | 80.3% |
| (Reference) Net proceeds ratio with brokerage negotiated to 1.2% | 81.0% | 81.5% | 81.7% |
| (Reference) Net proceeds ratio with 80% replacement-asset deferral | 92.4% | 93.1% | 93.3% |
Setting the three cases side by side shows that the net proceeds ratio converges almost entirely within a 79.7%–80.3% range. A tenfold change in price moves it by only 0.6 points. The transaction cost ratio falls 0.95 points, from 4.36% to 3.41%, while a rising gain ratio lifts the tax burden 0.3 points, from 16.0% to 16.3%, and the two offset each other.
So for a seller looking to improve exit proceeds, price band is not the lever. In order of impact, the four levers are: (1) whether the replacement-asset special provision applies (+12.9 points), (2) the choice of selling entity (an individual long-term transfer is +8.1 points vs. a corporation), (3) holding period, i.e. depreciation progress (11.4 points between 3 and 39 years), and (4) negotiating the brokerage fee rate (+1.3 points). The brokerage fee is the largest cost item in yen terms, but its contribution to the net proceeds ratio is small compared with the tax options.
Two-Way Sensitivity — How Far Net Proceeds Move with Sale Multiple × Holding Period
The end-to-end estimates fixed the acquisition price at 60% of the sale price, which is why varying the price band barely moved the net proceeds ratio. What actually matters is the combination of “how much above acquisition cost you sold for” and “how far depreciation has progressed.” The grid below fixes the acquisition price at ¥6.0 billion and plots the net proceeds ratio along two axes: sale price multiple and holding period.
| Holding period | ¥7.2bn ×1.20 cost | ¥9.0bn ×1.50 cost | Base ¥10.0bn ×1.67 cost | ¥12.0bn ×2.00 cost | ¥15.0bn ×2.50 cost |
|---|---|---|---|---|---|
| 3 years | 90.9% | 85.9% | 84.0% | 81.0% | 78.1% |
| 10 years | 87.8% | 83.5% | 81.8% | 79.2% | 76.6% |
| 15 years (base) | 85.6% | 81.7% | 80.2% | 77.9% | 75.5% |
| 25 years | 81.2% | 78.2% | 77.0% | 75.2% | 73.4% |
| 39 years | 75.1% | 73.3% | 72.6% | 71.6% | 70.5% |
Centered on the base case of 80.2% (¥10.0 billion, 15-year hold), the grid spans a range of 20.4 points, from 90.9% (¥7.2 billion, 3-year hold) to 70.5% (¥15.0 billion, fully depreciated). That is an order of magnitude larger than the 0.6 points seen when only the price band varied. Two asymmetries stand out. First, for the same holding period, the higher the sale multiple, the lower the net proceeds ratio. The higher the price, the larger the gain and the heavier the tax relative to price — pricing success is not rewarded in the net proceeds ratio (though the net amount naturally increases). Second, holding the multiple fixed and extending the holding period converts depreciation progress directly into capital gain and pushes the ratio down. In the ×1.20 column, 3 versus 39 years produces a 15.8-point gap, while in the ×2.50 column the gap is only 7.6 points. The thinner the unrealized gain, the greater the impact of the holding-period decision on net proceeds.
When an investment committee debates extending the hold period, it needs to state explicitly what a vertical move down this grid does to the exit. The increase in interim cash flow and the increase in exit tax burden from further depreciation must be estimated separately, or the trade-off between them will be misjudged.
What to Assume for IRR Exit
When investment committees discuss IRR, it is not uncommon for the sale price to be entered directly as the exit cash flow. What the estimates so far show is that this overstates exit cash flow by about 20%.
| Exit assumption | Exit CF (¥10bn case) | Effective cap rate on ¥410M NOI | Assessment |
|---|---|---|---|
| Sale price entered as-is | ¥10.000bn | 4.10% | Ignores transaction costs and tax |
| Transaction costs deducted only | ¥9.638bn | 4.25% | Ignores tax |
| Transaction costs + capital gains tax deducted | ¥8.018bn | 5.11% | Net proceeds basis |
| Same, 39-year hold (fully depreciated) | ¥7.262bn | 5.65% | Long-hold case |
| Same, with 80% replacement-asset deferral | ¥9.314bn | 4.40% | Where the next acquisition is planned |
As a practical approach, exit cash flow is most straightforwardly calculated as sale price − (transaction costs) − (sale price − book value at sale − transaction costs) × effective tax rate. Because this formula requires book value as an input, running scenarios with different hold periods automatically reflects depreciation progress in exit tax. Models that treat a longer hold as “just more interim cash flow” miss this effect.
Two further points are easily overlooked in practice. The first is consumption tax. Consumption tax is levied on the consideration for the building portion (land is exempt), and the seller files and pays the tax collected. It is neutral to net proceeds, but it sits temporarily in the seller’s cash during the lag between closing and payment. Consumption tax included in brokerage fees is eligible for input tax credit, so the effective burden falls to the tax-exclusive amount.
The second is pro-rata settlement of fixed asset tax and city planning tax. By convention, the buyer reimburses the seller for the period from the handover date onward, so this is a positive item for the seller. HotelBank’s earlier analysis put hotel property tax at roughly ¥160,000–¥240,000 per room per year, so a mid-year closing would return about half the annual amount. In size, it may move the net proceeds ratio by 0.1 points or not at all, but omissions in the settlement statement easily become a point of contention just before closing.
Summary — Four Variables Sellers Can Move at Exit
Net proceeds from selling a single hotel building converge at roughly 80% of the sale price across every band from ¥3 billion to ¥30 billion. The breakdown: transaction costs of 3.4–4.4%, and corporate taxes on the capital gain of 16.0–16.3%. Around 90% of transaction costs is brokerage/advisory fees, while transfer-tax-like items such as stamp duty and registration costs total less than 0.02%. This contrasts with the acquisition side, where transfer taxes weigh in at several percent (earlier article (b)).
The variables that move the net proceeds ratio come down not to price band but to these four. First, the special provision for replacement of specified assets: if the general 80% compressed book entry can be used, the ratio improves 12.9 points, from 80.2% to 93.1%. The FY2026 tax reform extended its deadline to sales made by March 31, 2029, but it is a deferral, not an exemption, and requires acquiring the replacement asset in the same fiscal year. Second, the selling entity: an individual long-term transfer (20.315%) and a corporation (31.52%) differ by 8.1 points. Third, the holding period: a fully depreciated property yields a ratio 11.4 points lower than one held for 3 years. Fourth, the brokerage fee rate: negotiating the 3.30% cap down to 1.2% improves the ratio by 1.3 points.
Conditions on the buy side are falling into place. Listed hotel REIT acquisitions have recovered from a trough of 3 deals and ¥4.9 billion in 2022 to 14 deals and ¥110.2 billion in 2024 and 21 deals and ¥68.3 billion in 2025, and the acquisition price per room rose from ¥12.3 million in 2022 to ¥43.8 million in 2024. The expected yield for limited-service hotels in Tokyo is trending down, at 4.1% as of April 2026. Operating metrics are also solid: Tokyo’s estimated settled ADR is up 7.2% year on year over the latest 12 months, and RevPAR at urban lodging-focused REITs remains above prior-year levels.
The timing environment for a sale and the structure of net proceeds are separate issues. Even with a good price, a corporation cashing out a heavily depreciated property keeps only a little over 70%. Conversely, building in the replacement-asset provision on the premise of a next acquisition secures over 90%. Establishing “how much will be left” with the same precision as “how much can it sell for” is the starting point of exit design.
About the estimates: The net proceeds estimates in this article are approximations based on current law and a set of assumptions (acquisition price, building ratio, useful life, depreciation method, holding period, location, and fee rates). Actual tax amounts vary significantly depending on loss carryforwards, offsetting against other income, application of excess local tax rates, and whether the requirements for compressed book entry and other special provisions are met. Because no published standard fees exist for due diligence support, legal costs, and trust-related costs, levels assumed in practice are used as assumed values. For decisions on individual transactions, please consult tax accountants, lawyers, real estate appraisers, or other professionals.
Related Reading
- Hotel Acquisition Costs 7.1%: A 6.5% Gross Yield Becomes 4.65% Net
- Three Hotel Acquisition Vehicles: 3.0% Transfer Tax vs. Near Zero
- Ryokan Succession Tax Deadline Dec 2027: ADR +32% and Share Values
- Hotel REIT Appraisals Hit 1.25x Cost: Cap Rates Across 298 Assets
- Hotel Capital Allocation 2026: One Deal Took 27% of J-REIT Q1 Buying
- Hotel Capex: ¥134k–¥624k per Room a Year — 5 REITs’ IR Disclosures
- Japan Hotel Acquisition Rules 2026: 165 Watch Zones, 9.6% of Rooms
References and Sources
■ Data Sources
Estimated settled ADR (Tokyo, January 2024–August 2026, 1,067–1,151 properties covered per month); REIT ownership master (of 302 properties held by 7 listed REITs, the 287 properties across 6 REITs with consistent acquisition date, acquisition price, and room count; snapshot as of August 31, 2026); monthly operating disclosures of 4 listed hotel REITs (June–July 2026). Laws, fee caps, and tax rates are based on publications of the National Tax Agency, MLIT, and the Ministry of Finance.
■ Estimate Assumptions
The base case is a single hotel building in Japan sold to a third party by a Tokyo-based corporation subject to size-based enterprise tax. Acquisition price = 60% of sale price, 65% building ratio, 39-year statutory useful life with straight-line depreciation, 15-year hold, 31.52% statutory effective tax rate (after the Defense Special Corporation Tax), and brokerage fee at the Real Estate Brokerage Act cap (price × 3% + ¥60,000, plus 10% consumption tax). Only the two-way sensitivity grid fixes the acquisition price at ¥6.0 billion and varies the sale price. Because no published standard fees exist, levels assumed in practice are used for due diligence support (¥20M), legal/settlement work (¥8M), trust-related costs (¥3M), and registration costs (¥500K).
■ Limitations
Net proceeds estimates are approximations; actual tax amounts vary significantly depending on loss carryforwards, offsetting against other income, application of excess local tax rates, and whether the requirements for compressed book entry and other special provisions are met. Estimated settled ADR is an estimate that applies segment-specific adjustment factors to OTA published rates; cross-checked against listed REIT disclosures, the median error is about 7% (91 properties, most recent 3 months). REIT acquisition records are based on disclosures by 6 listed REITs and exclude private funds and bilateral transactions between operating companies. Overseas properties and properties without disclosed room counts are excluded from the annual aggregation. Please consult tax accountants, lawyers, real estate appraisers, or other professionals for decisions on individual transactions.
■ Market Data
- MetroEngines Research & Consulting — Estimated settled ADR (Tokyo, 1,067–1,151 properties covered per month); REIT ownership master (302 properties held by 7 listed REITs, snapshot as of August 31, 2026)
■ Laws and Taxation (Primary Sources, in Japanese)
- National Tax Agency, Tax Answer No. 5651 “Compressed book entry for replacement of specified assets”
- National Tax Agency, Tax Answer No. 5652 “Assets eligible for compressed book entry on replacement of specified assets”
- National Tax Agency, Tax Answer No. 7108 “Reduced stamp duty on contracts for real estate transfers and construction work”
- National Tax Agency, Q&A case “Determining whether a document is taxable”
- Ministry of Finance, “Overview of the special provision for replacement of specified assets”
- Fees receivable by real estate brokers for sales of land or buildings (MLIT Notice, amended June 21, 2024)
- National Tax Agency e-Tax, “Guidance and notes on the creation of the Defense Special Corporation Tax”
- Deloitte Tohmatsu, “Latest on the statutory effective tax rate” (for March 2026 fiscal year-ends)
- Yamada & Partners, “Extension and partial revision of the replacement of specified assets provision (FY2026 tax reform)”
■ Market Research and Real Estate Investment
- Japan Real Estate Institute, “The 54th Japanese Real Estate Investor Survey (as of April 2026)”
- CBRE Japan, “Japan Cap Rate Survey — Expected Yields, March 2026”
- Nikkei, “Domestic real estate investment hits record ¥2 trillion in January–March, led by hotels and other large deals”
- JLL, “Review of and Outlook for the Japan Real Estate Investment Market 2026”
■ REIT Disclosures