

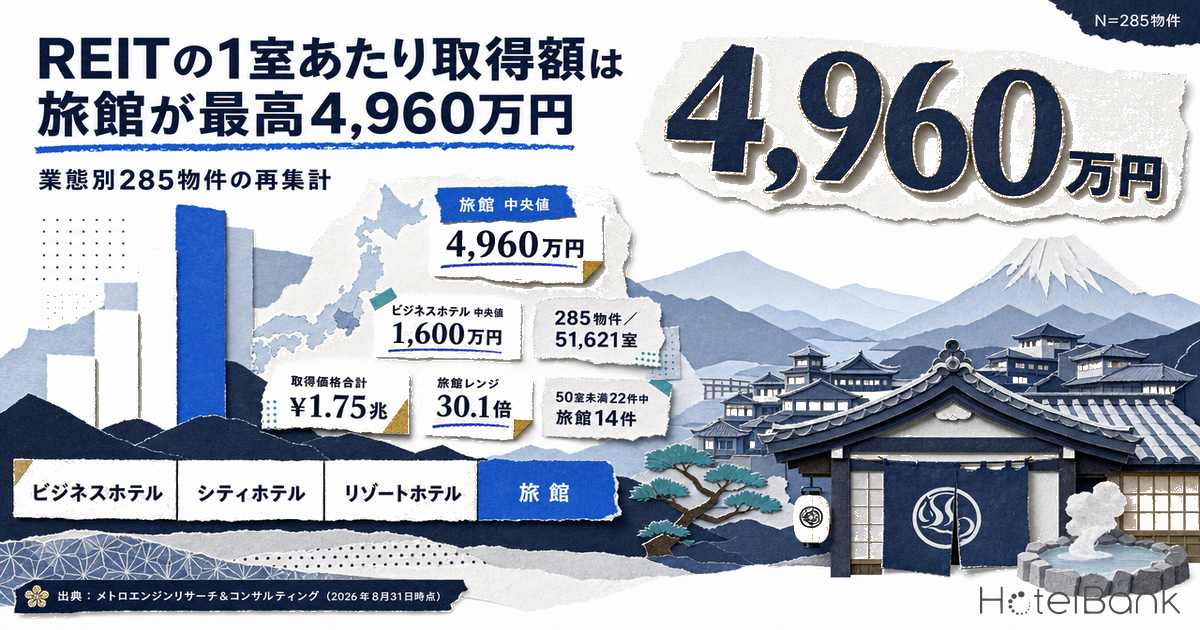
Pool the properties held by Japan’s seven listed hotel REITs by asset type rather than by REIT, and the picture of what gets paid for them changes. How far apart are per-room acquisition prices across business hotels, city hotels, resort hotels and ryokan? From the 302 properties recorded in our REIT ownership master (as of 31 August 2026), we extracted the 285 that stand up to aggregation and recut the numbers.
Metric Definitions Used in This Article
- Per-room acquisition price: each REIT’s disclosed property-level acquisition price divided by the room count disclosed alongside it (unit = ¥ million per room). This is the price at the time of acquisition, not the current appraisal value or market value. Acquisition dates range from the 1980s to 2025 depending on the property, and no time-value adjustment has been applied.
- Asset type: assigned by matching each property against the facility classification in our hotel facility master (business hotel / city hotel / resort hotel / ryokan / deluxe hotel, etc.). This is a different classification axis from the brand segmentation the REITs themselves use (full-service / limited-service, etc.).
- Median and mean: the median represents “a typical single property of that type”; the mean carries the skew of aggregate value. Both are shown, and where the two diverge widely, read that as the breadth of the distribution.
- Data source: MetroEngines Research & Consulting (REIT ownership master, as of 31 August 2026), based on each company’s IR disclosures.
- — The median per-room acquisition price is highest for ryokan at ¥49.57mn, roughly 3.1 times the ¥16.00mn for business hotels.
- — Business hotels account for 60.0% of properties and 50.8% of rooms, but only 35.1% of acquisition value. The ranking by unit price runs opposite to the ranking by volume.
- — The widest within-type range belongs to ryokan: ¥6.38mn to ¥192.03mn, a spread of 30.1x. The more standardised the asset, the tighter its price band; the more idiosyncratic, the wider the scatter.
- — Of the 22 properties with fewer than 50 rooms, 14 are ryokan and 4 are resort hotels. The median per-room price of those 22 is ¥55.90mn, 2.5 times the overall median of ¥22.63mn.
- — Of the 47 acquisitions in the most recent three years (2023–2025), 10 — 21.3% — were ryokan, up from 5.4% in 2014–2019, roughly a fourfold rise in share (four REITs that disclose acquisition dates, N=219 properties).
How this differs from our earlier work — no ranking of individual REITs here
Our previous articles on hotel REITs have all taken either “the individual REIT” or “the attributes of a property” as their subject. One examined the polarisation of acquisition unit prices by lining up all seven REITs and contrasting concentrated versus diversified portfolios; another mapped geography and identified nine prefectures where none of the seven owns a single property; another tracked holding periods and the fact that more than 140 properties have been held for over ten years; another looked at the gap between purchase price and current appraised value.
This article overlaps with none of those axes. It asks nothing about which REIT outperforms, nor about geography, holding period or unrealised gains. It repools the 285 properties by asset type and asks a single question: what do REITs pay for each kind of asset — business, city, resort, ryokan? There is therefore no REIT-by-REIT ranking table here. The REITs are treated as a window through which the asset-type population can be observed.
The whole picture — 285 properties, 51,621 rooms, ¥1,754,951mn in acquisition value
The sample is the 285 properties, out of the seven REITs’ 302 holdings, for which asset type could be matched and the acquisition price and room count were internally consistent. Together they hold 51,621 rooms and were acquired for a combined ¥1,754,951mn (about ¥1.75 trillion). Across the whole sample, per-room acquisition price has a median of ¥22.63mn, a first quartile of ¥11.92mn and a third quartile of ¥39.60mn — a 3.3x gap between the quartiles.
That “3.3x” has often been explained as a difference in investment policy between REITs. Repool by asset type, however, and a substantial part of the gap turns out to be explained not by each company’s character but by the price band inherent in the kind of asset itself.
Properties and rooms by asset type — 60% of properties, 50% of rooms are business hotels
Start with where the population’s centre of gravity sits. Of the 285 properties, 171 (60.0%) are business hotels, accounting for 26,244 rooms (50.8%). Their combined acquisition value is ¥616,063mn, or 35.1% of the total. They hold a majority of both properties and rooms, yet a smaller share of the capital deployed — because their per-room price is relatively low.
Deluxe hotels are the mirror image: just 7 properties and 3,644 rooms (7.1% of rooms), but ¥314,800mn, or 17.9% of acquisition value. Ryokan account for 26 properties and 1,969 rooms (3.8% of rooms) and 5.1% of acquisition value — small on a property-count basis, but above their room share in value terms.
Source: MetroEngines Research & Consulting (REIT ownership master, as of 31 August 2026, N=285 properties / 17 properties excluded from aggregation)
| Asset type | Properties | Rooms | Total acquisition value | Median per room (¥mn) | Mean per room (¥mn) | Total ÷ rooms (¥mn) |
|---|---|---|---|---|---|---|
| Business hotel | 171 | 26,244 | ¥616,063mn | 16.00 | 21.21 | 23.47 |
| City hotel | 43 | 12,776 | ¥444,273mn | 26.54 | 33.23 | 34.77 |
| Resort hotel | 28 | 6,135 | ¥262,099mn | 42.49 | 50.05 | 42.72 |
| Ryokan | 26 | 1,969 | ¥89,752mn | 49.57 | 54.14 | 45.58 |
| Deluxe hotel | 7 | 3,644 | ¥314,800mn | 38.94 | 99.66 | 86.39 |
| Other | 10 | 853 | ¥27,964mn | 29.78 | 41.24 | 32.78 |
Source: MetroEngines Research & Consulting (REIT ownership master, as of 31 August 2026, N=285 properties / 17 properties excluded from aggregation)
Per-room acquisition price — the highest median belongs to ryokan at ¥49.6mn
This is the core of the article. Median per-room acquisition price runs ¥16.0mn for business hotels, ¥26.5mn for city hotels, ¥38.9mn for deluxe hotels, ¥42.5mn for resort hotels — and ¥49.6mn for ryokan, the highest of all. The gap to business hotels is roughly 3.1x.
The high unit price of ryokan is not simply a matter of them being “luxury”. Ryokan have large floor areas per room, and many are built around configurations such as guest rooms with private open-air baths and wide window alcoves. On top of that, investment in shared facilities — the large communal bath, banquet halls, kitchens — is divided across a smaller room count, which pushes the per-room figure up for the same total building value. Read accurately, then, a high per-room acquisition price does not mean a high room rate; it means the way the asset is built shows up directly in the number. Our separate analysis of construction cost per room for hotels under development — around ¥20.67mn per room across 31 planned projects, at an average of 35.0 sqm of guest-room area per key — provides a useful reference line for what level of build each asset type’s acquisition price corresponds to.
The order changes when you look at means. The mean for deluxe hotels is ¥99.66mn, 2.6 times its ¥38.94mn median, because a handful of large central-Tokyo properties among the seven pull the average up. The ryokan mean of ¥54.14mn sits close to its ¥49.57mn median, so the mass of that distribution is near its centre. The fewer properties a type contains, the more its mean is swung by individual deals — which is why comparisons across asset types are better made on medians.
Source: MetroEngines Research & Consulting (REIT ownership master, as of 31 August 2026, N=285 properties / 17 properties excluded from aggregation). Bars span the first to third quartile; the dark vertical mark is the median
| Asset type | Minimum | 1st quartile | Median | 3rd quartile | Maximum | Max ÷ min |
|---|---|---|---|---|---|---|
| Business hotel | 2.38 | 9.00 | 16.00 | 28.75 | 85.99 | 36.1x |
| City hotel | 4.07 | 15.40 | 26.54 | 40.26 | 127.62 | 31.4x |
| Resort hotel | 14.43 | 26.23 | 42.49 | 62.88 | 122.10 | 8.5x |
| Ryokan | 6.38 | 28.04 | 49.57 | 65.42 | 192.03 | 30.1x |
| Deluxe hotel | 31.46 | 33.24 | 38.94 | 157.36 | 246.00 | 7.8x |
| Other | 7.99 | 11.62 | 29.78 | 41.15 | 126.91 | 15.9x |
Unit = ¥ million per room. Prices are as at acquisition; no time-value adjustment has been applied.
Source: MetroEngines Research & Consulting (REIT ownership master, as of 31 August 2026, N=285 properties / 17 properties excluded from aggregation)
The breadth of the range — ryokan are not a single asset class
More telling than the medians is the width of the ranges. Per-room acquisition prices for ryokan run from ¥6.38mn at the low end to ¥192.03mn at the high end, a spread of 30.1x. That is second only to business hotels (36.1x), and given that there are only 26 ryokan in the sample, the scatter per property is the largest of any asset type.
This carries a practical implication. Seen through REIT acquisition prices, the label “ryokan” does not sit within a single price band. Under that same label, properties bought at a little over ¥6mn per room and properties bought at ¥192mn per room coexist in the same population. For anyone selling a ryokan, that means there is no reliable “going rate for a ryokan” — and, read the other way, that how the property has been built and run still leaves enormous room for valuation to move.
Resort hotels are similarly wide (¥14.43mn to ¥122.10mn, 8.5x). City hotels, by contrast, have quartiles of ¥15.40mn and ¥40.26mn around a ¥26.54mn median — a comparatively tidy internal price band. The straightforward pattern holds: the more standardised the asset, the narrower the range; the more idiosyncratic, the wider. As for how much additional capital is put into these assets after acquisition, our separate work on hotel capital expenditure — which ranges from roughly ¥130,000 to ¥620,000 per room per year across the IR disclosures of five REITs — organises that question on the same per-room yardstick.
Source: MetroEngines Research & Consulting (REIT ownership master, as of 31 August 2026, N=285 properties / 17 properties excluded from aggregation). Both axes are on a logarithmic scale
How many rooms does it take to be considered — 14 of the 22 sub-50-room properties are ryokan
For anyone thinking about an exit, the floor on scale matters more than the unit price. Median room counts across the 285 properties differ sharply by type: 135 rooms for business hotels, 238 for city hotels and 161 for resort hotels, against 48 rooms for ryokan. The minimums are 24 rooms for ryokan, 26 for resort hotels, 47 for business hotels and 89 for city hotels.
There are 22 properties with fewer than 50 rooms in total, of which 14 are ryokan and 4 are resort hotels. Only 2 business hotels fall below 50 rooms, and no city hotels do. In practice, the asset types that get into REIT portfolios at small scale are ryokan and a slice of resorts. The median per-room acquisition price of those 22 properties is ¥55.90mn, 2.5 times the overall median of ¥22.63mn.
As a rule of thumb, then: a lodging-focused hotel generally needs at least 50 rooms — realistically around 100 — to come into a listed REIT’s field of view, while ryokan and small resorts have precedents at 24 to 50 rooms, provided the build can justify a per-room price above ¥30mn. This is a rough guide reverse-engineered from past acquisitions, not a standard or a requirement. Whether a property is actually acquired depends on whether operations can be taken on, the creditworthiness of the tenant or operator, the appraisal, and the REIT’s own investment policy and pipeline circumstances.
Source: MetroEngines Research & Consulting (REIT ownership master, as of 31 August 2026, N=285 properties / 17 properties excluded from aggregation)
| Asset type | Minimum rooms | Median rooms | Maximum rooms | Properties under 50 rooms |
|---|---|---|---|---|
| Business hotel | 47 rooms | 135 rooms | 624 rooms | 2 |
| City hotel | 89 rooms | 238 rooms | 1,052 rooms | 0 |
| Resort hotel | 26 rooms | 161 rooms | 1,016 rooms | 4 |
| Ryokan | 24 rooms | 48 rooms | 241 rooms | 14 |
| Deluxe hotel | 200 rooms | 480 rooms | 828 rooms | 0 |
| Other | 40 rooms | 74 rooms | 169 rooms | 2 |
Source: MetroEngines Research & Consulting (REIT ownership master, as of 31 August 2026, N=285 properties / 17 properties excluded from aggregation)
Asset type and location — 14 ryokan in Kanto and Chubu, 10 resorts in Okinawa
Break the asset types down by regional block and business hotels are spread nationwide, led by 67 in Kanto. The 26 ryokan split into 8 in Chubu, 6 in Kanto, 5 in Kinki, 3 in Chugoku-Shikoku, 3 in Kyushu and 1 in Tohoku — broadly tracking the distribution of hot-spring districts. Among the 28 resort hotels, Okinawa leads with 10, followed by Chubu with 8. Deluxe hotels cluster in the major metropolitan areas: 5 in Kanto, 1 in Chubu, 1 in Kinki.
What this shows is that a difference in asset type is simultaneously a difference in geography. Business hotel acquisitions cling to urban transport nodes, while ryokan and resort acquisitions cling to hot-spring and resort destinations. For a regional ryokan owner, that reads as evidence that the route by which REIT capital arrives is not closed off to anywhere but the cities.
Source: MetroEngines Research & Consulting (REIT ownership master, as of 31 August 2026, N=285 properties / 17 properties excluded from aggregation)
Source: MetroEngines Research & Consulting (REIT ownership master, as of 31 August 2026, N=285 properties)
Acquisitions by year — 10 ryokan bought in the last three years
Acquisition dates are visible for only four of the seven REITs (see the data-quality section below). Arraying the 219 properties those four acquired by year and asset type, there was a wave of lodging-focused buying in 2014–2015 (72 properties over two years, 66 of them business hotels), after which annual counts settle down. What stands out is the recent period: of the 47 acquisitions across 2023–2025, 10 were ryokan, a 21.3% share. Over the six years from 2014 to 2019 the figure was 8 out of 147, or 5.4% — so the share has risen roughly fourfold.
The absolute counts are small and single-year swings are large, so it is too early to call this a turn in the trend. What can be confirmed in the numbers, at minimum, is that the listed market has been accumulating a track record of acquiring ryokan in recent years.
Source: MetroEngines Research & Consulting (REIT ownership master, as of 31 August 2026). Limited to the four REITs that disclose acquisition dates — Invincible Investment Corporation, Hoshino Resorts REIT, Ichigo Hotel REIT and Japan Hotel & Residential REIT — N=219 properties
The structure of the ryokan segment, and the room that sits inside it
Split the 26 ryokan by REIT and, although they are spread across several investment corporations, acquisitions tied to particular sponsor groups account for a large share in practice. The dominant pattern is one in which the operating brand and the operator are supplied as a package; cases where an independent ryokan enters a REIT portfolio on its own are limited.
This does not mean ryokan are valued cheaply as an asset. Quite the opposite: the fact that they carry the highest median per-room acquisition price of any type shows that with operations in place, a ryokan can be the most highly valued asset in the listed market. The constraint lies not in the value of the asset but in the route by which it reaches the listed market. REITs require continuity of operations, a reporting framework and explicable cash flow, which makes a pairing with an operator that provides those a precondition.
Turn that around and it means there is still substantial room to build the vehicles through which independent ryokan can access the listed market. Operating-management platforms, ryokan-focused bridge funds, intermediate vehicles that assemble multiple properties into scale — the business opportunity for whoever supplies that route remains open here. Reading the ¥49.6mn median against a cash-flow-based view of what a ryokan can be bought for sharpens the picture: it can be read as a reference point for the level a ryokan can reach as an asset once that route is functioning.
Data quality and the 17 properties left out of the aggregation
The figures here are not a straight sum of the raw master data. The following exclusions and limitations were applied.
| Item | Count | Handling |
|---|---|---|
| Properties held by Kasumigaseki Hotel REIT | 15 properties | Column alignment is off in the master import: the room-count field appears to contain a construction year and the acquisition-price field a year. The 15 properties sum to an obviously anomalous 49,210 rooms, so all were excluded from the aggregation. |
| Overseas properties | 2 properties | No match exists in the domestic facility master, so no asset type could be assigned. Exclusion is also consistent with the article’s purpose of discussing domestic-market levels by asset type. |
| Aggregation by acquisition year | Limited to 219 properties | For Japan Hotel REIT and Mori Trust REIT, the relevant field refers to the construction date rather than the acquisition date. These two were removed from the by-year aggregation, which uses only the 219 properties held by the other four. Both are included in the price and room-count aggregations. |
| Discussion of building age | — | The opening-year field in the facility master is not reliable enough, so this article contains no analysis of building age. |
Note that every statement in this article about what REITs do or do not own is confined to the seven listed hotel-focused REITs. The master covers only those seven, so properties held by diversified REITs, private REITs and private funds do not appear here. A property’s absence from this population is not proof that it is not fund-owned.
Scale and unit price combined — which cell do the 285 properties fall into?
Everything so far has used asset type as the axis. Finally, strip the asset-type label away and replot the 285 properties on just two axes: room count and per-room acquisition price. What a seller first wants to know is whether their property sits inside a combination that actually gets acquired, and answering that does not require an asset-type label.
Reading it is simple: if a cell has a count in it, REITs have acquired at that combination of scale and unit price. All 25 cells contain at least one property, so there is no blank zone of “impossible at this scale and this price”. The concentration, however, is heavily uneven.
| Rooms \ per-room price (¥mn) | Up to 14.99 | 15.00–29.99 | 30.00–49.99 | 50.00–99.99 | 100.00+ | Total |
|---|---|---|---|---|---|---|
| Up to 49 rooms | 2 (2) | 6 (5) | 3 (1) | 7 (7) | 4 (3) | 22 |
| 50–99 rooms | 35 (0) | 17 (1) | 6 (3) | 9 (5) | 3 (2) | 70 |
| 100–199 rooms | 47 (1) | 30 (6) | 23 (3) | 5 (2) | 3 (1) | 108 |
| 200–399 rooms | 14 (0) | 23 (3) | 14 (4) | 10 (2) | 2 (1) | 63 |
| 400+ rooms | 3 (1) | 4 (0) | 9 (1) | 4 (0) | 2 (0) | 22 |
| Total | 101 | 80 | 55 | 35 | 14 | 285 |
Cell shading indicates the number of properties. Source: MetroEngines Research & Consulting (REIT ownership master, as of 31 August 2026, N=285 properties / 17 properties excluded from aggregation)
The densest cell is 100–199 rooms × up to ¥14.99mn per room, with 47 properties, followed by 50–99 rooms in the same price band, with 35. Those two cells alone hold 82 properties, 28.8% of the total. Standard lodging-focused acquisitions concentrate here.
By contrast, the 22 properties of 49 rooms or fewer skew upward on price. Eleven of them — half the row — are at ¥50mn or more per room. Across the whole sample only 49 properties, or 17.2%, clear ¥50mn per room, so the small-scale band alone is conspicuously expensive. And 18 of those 22 are ryokan or resort hotels. Read that as: properties acquired by REITs at small scale are in practice limited to those where the unit price can be explained.
On these two axes it becomes clear that the floor on scale is set in combination with unit price. Among properties under 50 rooms, 14 of the acquisitions cluster at ¥30mn or more per room, while only 2 sit at or below ¥14.99mn. Conversely, at 400 rooms and above there are 3 precedents even at ¥14.99mn or less per room. The smaller the property, the more the unit price has to do the explaining; the larger it is, the looser the unit-price requirement — and the distribution of actual acquisitions shows exactly that.
This is the distribution of past acquisitions, though, not a screening standard. The absence of blank cells cuts both ways: wherever a property sits, the probability of acquisition is not zero, but sitting in a populated cell guarantees nothing either. Whether a property is actually acquired is decided by whether operations can be taken on, the operator’s creditworthiness, the appraisal, and the REIT’s investment policy and pipeline circumstances.
Conclusion — asset type is a price band, and simultaneously a floor on scale
Repooling 285 properties across seven REITs by asset type yields three findings.
First, the median per-room acquisition price is highest for ryokan at ¥49.6mn, followed by resort hotels at ¥42.5mn, deluxe hotels at ¥38.9mn, city hotels at ¥26.5mn and business hotels at ¥16.0mn. Business hotels hold 60% of properties and 50% of rooms, yet only 35.1% of acquisition value. The ranking by unit price runs opposite to the ranking by volume.
Second, within-type ranges are conspicuously wide for ryokan and resorts. Ryokan span ¥6.38mn to ¥192.03mn, a thirtyfold gap. The more standardised the asset, the tighter its price band; the more idiosyncratic, the wider the scatter. For a ryokan seller, that means the “going rate” has little force — but it also leaves room for how the property is built and run to be reflected in the valuation.
Third, the floor on scale differs sharply by asset type. Of the 22 properties under 50 rooms, 14 were ryokan. A lodging-focused hotel generally needs something like 100 rooms to come into a listed REIT’s field of view, whereas ryokan have precedents from 24 rooms up. That is not a standard, but a guide reverse-engineered from past acquisitions.
Ryokan are acquired at the highest per-room price in the listed market while the routes to get there remain few — and that structure is itself the opportunity for whoever builds those routes. The next question is not “what do ryokan sell for?” but “how can an independent ryokan reach that price band?”
Related reading
References and sources
■ Data source
The population is the REIT ownership master (as of 31 August 2026, 302 properties recorded), which consolidates the property-level disclosures of Japan’s seven listed hotel REITs — Japan Hotel REIT, Invincible Investment Corporation, Hoshino Resorts REIT, Ichigo Hotel REIT, Japan Hotel & Residential REIT, Mori Trust REIT and Kasumigaseki Hotel REIT. From it we took each property’s acquisition price, room count, location and acquisition date. Asset-type classification was assigned by matching the facility classification in our hotel facility master at the hotel level, and was successfully assigned for all 285 properties.
■ Calculation assumptions
Per-room acquisition price = property-level acquisition price ÷ the room count in the same disclosure (¥ million per room). Prices are used as at acquisition, with no time-value or inflation adjustment for differences in acquisition year. Comparisons across asset types use the median as the primary metric because it is robust to skew, with the mean and total ÷ total rooms shown alongside so divergences can be checked. Quartiles are calculated on the inclusive method. Regional blocks aggregate the prefecture of location into eight groups (Hokkaido / Tohoku / Kanto / Chubu / Kinki / Chugoku-Shikoku / Kyushu / Okinawa).
■ Limitations and caveats
(1) The population is limited to the seven listed hotel-focused REITs and excludes properties held by diversified REITs, private REITs and private funds. A property’s absence here is not proof that it is not fund-owned. (2) Of the 302 properties, 17 were excluded from the aggregation (15 from one REIT where column misalignment was confirmed, plus 2 overseas properties), leaving a denominator of 285. (3) The aggregation by acquisition year is limited to the four REITs — 219 properties — where the relevant field refers to the acquisition date. (4) Acquisition prices are as at the date of disclosure and are not current appraisal values or market values. (5) Asset-type classification follows the facility master and uses a different classification axis from the brand segmentation the REITs use in their IR materials (full-service / limited-service, etc.). (6) For types with few properties, such as the 26 ryokan and 7 deluxe hotels, a single addition or removal moves the mean substantially, so the median and the spread of the distribution should be read together.
■ Market data
- MetroEngines Research & Consulting — REIT ownership master (as of 31 August 2026, 302 properties recorded, 285 in this article’s sample) and hotel facility master (asset-type classification)
■ REIT official IR (property-level disclosure)
- Japan Hotel REIT Investment Corporation, “Portfolio List”
- Invincible Investment Corporation, “Portfolio”
- Hoshino Resorts REIT, Inc., “Portfolio List”
- Ichigo Hotel REIT Investment Corporation, “Portfolio”
- Japan Hotel & Residential REIT Investment Corporation, “Portfolio List”
- Mori Trust REIT, Inc., “Portfolio List”
- Kasumigaseki Hotel REIT Investment Corporation, “Portfolio List” (excluded from this article’s aggregation)