

The decision to turn an office building into a hotel has long been framed around one question: is there vacant space going spare? Yet as of July 2026, office vacancy in Japan’s major cities stood at 1.95% in Tokyo’s five central wards, 3.24% in Osaka, 3.59% in Nagoya, 5.17% in Yokohama and 5.57% in Sendai (Miki Shoji). That is hardly a surplus. Which means feasibility can be judged on one thing only — how much the same floor area earns per tsubo per month. This article calculates the “break-even ADR” a hotel must reach to match office rental income across seven major office districts in Yokohama, Nagoya, Sendai and Osaka, and quantifies the conditions under which conversion works.
Metric Definitions Used in This Article
- ADR (average daily rate): An estimated settled rate (tax-exclusive equivalent) derived by applying segment-specific adjustment coefficients to the lowest published plan level each property lists on OTAs (double occupancy, per-room rate, tax included). Cross-checked against the property-level actuals disclosed by listed hotel REITs (91 properties, most recent three months), the median error is approximately 7%. These are estimates and differ from each property’s actual transacted rates and accounting figures. Area-level ADR is the median across the covered properties — the level of a typical property in that area.
- OCC (occupancy rate): Rooms sold as a share of total room supply in the area (an estimate based on OTA sales inventory). The calculations here use 80% as the base case for sensitivity analysis, informed by the 75.3% national figure for business hotels in the Japan Tourism Agency’s Overnight Travel Statistics Survey (2025 final figures) and by the urban-property actuals disclosed by listed hotel REITs.
- Break-even ADR: The ADR at which the GOP (gross operating profit) generated per tsubo by the converted hotel equals the NOI (net operating income) the same floor area would produce as office space. Calculated independently for this article.
- Data sources: MetroEngines Research & Consulting (hotel side) / Miki Shoji “Office Market” (office side) / MLIT Real Estate Information Library (land prices, zoning)
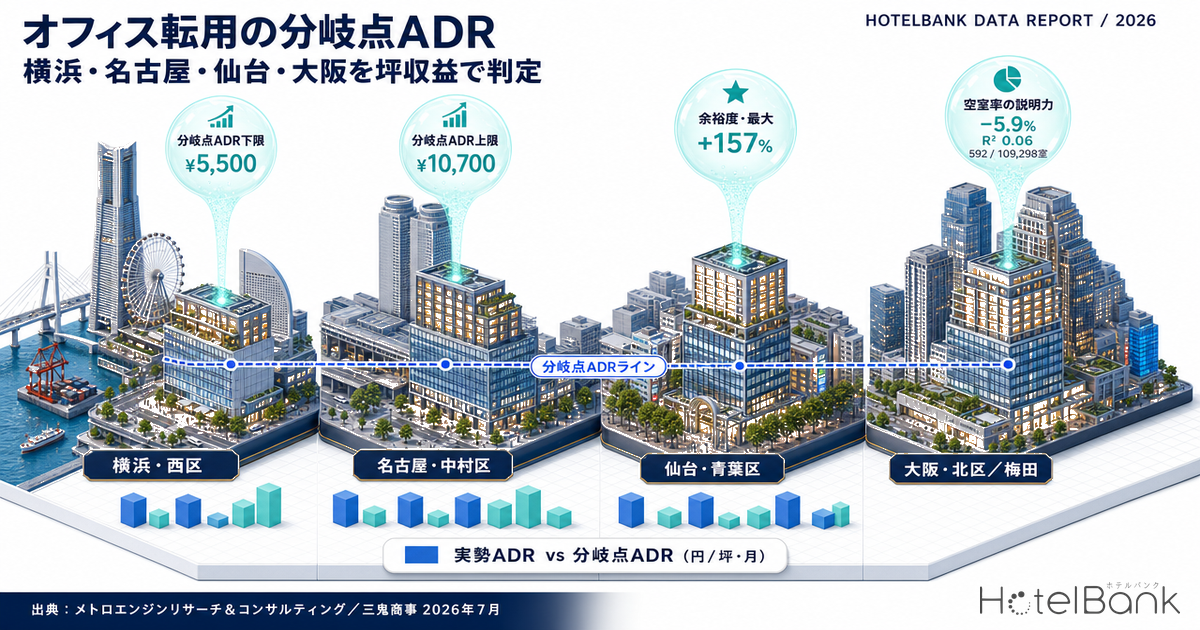
- — Break-even ADR runs from ¥5,500 in Sendai to ¥10,700 in Umeda — close to a 2x spread. Even under the same “office conversion hotel” label, the hurdle differs completely by area.
- — Vacancy has an R² of just 0.06. It explains only 6% of the variation in conversion feasibility. What to look at first is the market ADR of the trade area (R² 0.75).
- — Headroom spans +157.3% in Nishi-ku, Yokohama to −5.9% in Kita-ku, Osaka (Umeda). The higher the office rent a floor can command, the harder it is for a hotel to match it.
- — Room-size allocation moves the verdict more than anything else. The room area at which the gap closes to zero ranges from 16.9 m² in Umeda to 46.3 m² in Nishi-ku, Yokohama.
- — Payback runs 3.9 to 24.4 years at ¥800,000 per tsubo. Under the pessimistic scenario (72% occupancy, 33% GOP margin) the verdict flips in Nagoya’s two districts.
How This Differs from Our Earlier Work — This Is the Pricing Math for Moving In
HotelBank has covered conversion themes several times before. To avoid confusion, we set out where this article sits before going further.
First, Department Store Sites: 6 of 14 Go Hotel dealt with conversions from retail; the subject here is office buildings. Floor plate geometry, floor-to-floor heights, core position and existing building services all start from different premises in a department store than in an office. Second, our earlier work on where office-to-hotel conversion succeeds screened acquisition candidates by employment density and residential depth — a question of location; this article takes up the pricing math that follows once the location is settled. Third, unlike a count of supply volume such as Hotel Supply Pressure Ranking 2026-2027, the question here is not how many rooms will be created but at what rate band a conversion stands up.
It also runs in the opposite direction from conversions out of hotels into housing or dormitories. This article covers the economics of moving into lodging — turning office floor area into guestrooms.
Starting Point — There Is Little Spare Floor Area in the 2026 Office Market
We begin with the office market itself. Average vacancy rates published by Miki Shoji as of July 2026 stand at 1.95% for Tokyo’s five central wards, 3.24% for Osaka, 3.59% for Nagoya, 5.17% for Yokohama and 5.57% for Sendai. Osaka and Nagoya sit clearly below the roughly 5% level often cited as a benchmark. Yokohama has fallen for seven consecutive months, and Sendai is broadly flat.
Rents are on an upward track as well. Average asking rent in Tokyo’s five central wards is ¥23,287 per tsubo, up 11.38% year on year, with Yokohama at ¥13,377, Osaka at ¥13,411, Nagoya at ¥13,343 and Sendai at ¥9,690. Note that Miki Shoji’s average rent is the asking rent for a standard floor and excludes common area charges and consumption tax. The calculations in this article follow the same definition.
The conclusion that follows is simple. As of 2026, the motive of “converting because the vacancy will not fill” does not hold, at least in the office clusters of major cities. Anyone weighing conversion is choosing to reassign floor area that is currently occupied. That is precisely why the test can only be the income differential, not vacancy.
| City | Average vacancy | Average asking rent (¥/tsubo/month, excl. common area charges) | Vacancy in key districts |
|---|---|---|---|
| Tokyo, 5 central wards (reference) | 1.95% | 23,287 | Shibuya 1.11% / Shinjuku 2.08% |
| Osaka | 3.24% | 13,411 | Umeda 2.63% / Yodoyabashi-Hommachi 3.95% / Semba 3.77% |
| Nagoya | 3.59% | 13,343 | Meieki 2.60% / Sakae 3.61% / Fushimi 4.47% / Marunouchi 4.81% |
| Yokohama | 5.17% | 13,377 | Yokohama Station 2.83% / Minato Mirai 21 5.36% / Kannai 7.77% |
| Sendai | 5.57% | 9,690 | Ichibancho area 4.75% / Prefectural & City Hall area 5.29% / Station front 5.56% |
Location Analysis — All Four Cities’ Office Cores Are Commercial Zones, with Land Prices Rising
Whether a conversion can proceed is ultimately settled by the regulatory compliance of the individual building, but the area’s urban planning conditions have to be established first. From the MLIT Real Estate Information Library we pulled zoning designations and 2025 published land prices for the office cores of the four cities — Yokohama Station East, Fushimi in Nagoya, Ichibancho in Sendai and Yodoyabashi in Osaka.
All four are centred on commercial zones, where hotel and ryokan operations under the Hotel Business Act face no zoning restriction. Floor area ratios vary: 400–800% around Yokohama Station, 500–1,000% in Fushimi, 400–700% in Ichibancho and 400–1,000% in Yodoyabashi. Because converting an existing building does not add floor area, however, the practical focus is less on FAR than on whether the building is legally non-conforming, whether two-way egress can be secured, and the state of shaft compartmentation.
Land prices are in an upswing. Year-on-year changes in the 2025 published land prices run +7.1% to +17.6% around Yodoyabashi in Osaka, +1.8% to +12.1% around Yokohama Station, +1.0% to +9.2% around Fushimi in Nagoya and +2.7% to +7.5% in central Sendai. For value-add deals that involve acquisition, this rise pushes up the entry cost. For owners who already hold a mid-sized building, unrealised land gains are not a direct variable in the conversion decision. That is why the calculations here exclude land cost and assume a change of use for an already-owned building.
| Yokohama Station East | Commercial zone, 400–800% |
| Fushimi, Nagoya | Commercial zone, 500–1,000% |
| Ichibancho, Sendai | Commercial zone, 400–700% |
| Yodoyabashi, Osaka | Commercial zone, 400–1,000% |
| Around Yodoyabashi, Osaka | +7.1% to +17.6% |
| Around Yokohama Station | +1.8% to +12.1% |
| Around Fushimi, Nagoya | +1.0% to +9.2% |
| Central Sendai | +2.7% to +7.5% |
The Calculation Framework — Putting Office and Hotel on a Monthly Per-Tsubo Basis
Aligning the unit of comparison is the whole of this exercise. Office space is discussed in monthly rent per tsubo; hotels in ADR and RevPAR per room. To put the two on the same footing, hotel revenue has to be converted into a monthly figure per tsubo (1 tsubo = 3.3058 m²).
(a) Office side — from asking rent to effective income, and on to NOI
On the office side, asking rent (excluding common area charges) is multiplied by the occupancy rate to give effective rental income, from which operating costs — property taxes, repairs, property management fees — are deducted to reach an NOI equivalent. This article sets occupancy as one minus the vacancy rate and adopts a 15% operating cost ratio. Common area charges are treated separately from rental income, on the premise that they fund the upkeep of shared areas.
(b) Hotel side — converting RevPAR into a monthly figure per tsubo
On the hotel side, the estimated settled ADR compiled by MetroEngines Research & Consulting is multiplied by the occupancy rate to give RevPAR, then by 30.4 days to give monthly revenue per room. Dividing that by the floor area in tsubo each room consumes yields monthly revenue per tsubo.
What matters here is how floor area is allocated per room. On a standard office floor, internal corridors are usually not counted within the leasable area. Once converted to a hotel, corridors are needed to reach each guestroom, so part of the former leasable area becomes circulation. This article assumes a 20% corridor loss and divides the room’s private area by 0.8 to obtain the former-leasable-equivalent area consumed per room. An 18 m² room therefore equates to 22.5 m², or 6.81 tsubo.
| Room private area | Former-leasable equivalent (20% corridor loss) | Tsubo per room | Likely room type |
|---|---|---|---|
| 15 m² | 18.8 m² | 5.67 tsubo | Compact single / semi-double |
| 18 m² | 22.5 m² | 6.81 tsubo | Standard limited-service double (base case here) |
| 22 m² | 27.5 m² | 8.32 tsubo | Spacious twin / upper-tier room |
| 25 m² | 31.3 m² | 9.45 tsubo | Mid-class twin |
(c) A note on asymmetry — rent is net, hotel revenue is gross
Office rent is the owner’s net income, whereas hotel revenue is a gross figure before operating costs. Setting rent against hotel revenue while ignoring this asymmetry makes the hotel side look far larger than it is. This article deducts payroll, utilities, OTA and other distribution commissions, cleaning, consumables and management fees from the hotel side to reach a GOP basis before comparing it with office NOI.
The GOP margin base case is 40%. In listed hotel REIT disclosure, Invincible Investment Corporation (インヴィンシブル投資法人) reports an actual GOP margin of 38.9% across the 91 properties it entrusts to operators (fiscal period ended December 2024). The industry rule of thumb for limited-service hotels is 50–60%, but converted buildings have less freedom than new build in how common areas can be laid out, given the constraints of the existing structure, so we take the conservative side at 40%. The sensitivity analysis also shows 33% and 47%.
The occupancy base case is 80%. The national room occupancy rate for business hotels in the Japan Tourism Agency’s Overnight Travel Statistics Survey (2025 final figures) is 75.3%, but that is a national figure that includes regional areas. In the property-level disclosure of listed hotel REITs, properties located in the four cities covered here show monthly actuals broadly in a 73–99% band over the past year (September 2025 to August 2026; N=18 properties with confirmed property-level disclosure — 3 in Yokohama, 4 in Nagoya and 11 in Osaka, with no qualifying property in Sendai). We set 80% for an urban conversion hotel and also test 72% and 88% in the sensitivity analysis.
Results — Break-Even ADR Spans Nearly 2x, from ¥5,500 in Sendai to ¥10,700 in Umeda
Applying that framework to the seven districts produces the table below. Break-even ADR is the ADR at which the converted hotel’s GOP per tsubo equals the office NOI of the same floor area. Where market ADR exceeds it, conversion has economic logic; where it falls short, leaving the space as office rental is the better outcome.
| District | Office rent | Vacancy | Office NOI per tsubo/mo | Market ADR (trailing 6M) | Hotel GOP per tsubo/mo | Gap | Break-even ADR | Headroom |
|---|---|---|---|---|---|---|---|---|
| Nishi-ku, Yokohama (Yokohama Sta. / Minato Mirai 21) | 13,377 | 4.10% | 10,904 | 19,630 | 28,057 | +17,152 | 7,629 | +157.3% |
| Aoba-ku, Sendai (Station front / Ichibancho) | 9,690 | 5.20% | 7,808 | 9,519 | 13,605 | +5,797 | 5,463 | +74.2% |
| Naka-ku, Yokohama (Kannai) | 13,377 | 7.77% | 10,487 | 11,447 | 16,361 | +5,874 | 7,337 | +56.0% |
| Chuo-ku, Osaka (Yodoyabashi / Hommachi / Semba) | 12,067 | 3.86% | 9,861 | 10,607 | 15,160 | +5,299 | 6,899 | +53.7% |
| Nakamura-ku, Nagoya (Meieki) | 13,343 | 2.60% | 11,047 | 10,418 | 14,890 | +3,844 | 7,729 | +34.8% |
| Naka-ku, Nagoya (Sakae / Fushimi / Marunouchi) | 13,343 | 4.30% | 10,854 | 9,503 | 13,582 | +2,729 | 7,594 | +25.1% |
| Kita-ku, Osaka (Umeda) | 18,524 | 2.63% | 15,331 | 10,092 | 14,424 | −907 | 10,727 | −5.9% |
| [Reference] Tokyo, 5 central wards | 23,287 | 1.95% | 19,408 | — | — | — | 13,579 | — |
The widest headroom is in Nishi-ku, Yokohama. Covering the area around Yokohama Station and Minato Mirai 21, its market ADR of ¥19,600 sits 157% above the ¥7,600 break-even. The gap per tsubo is ¥17,200 a month — close to 1.6 times office NOI on top, and by some distance the largest of the seven. Behind it lies a structure in which upper-band accommodation demand has formed around the Minato Mirai 21 district while office rent remains just under 60% of the level in Tokyo’s five central wards.
By contrast, in Kita-ku, Osaka (Umeda) the break-even ADR reaches ¥10,700, slightly above the market ADR of ¥10,100. The gap is −¥900 per tsubo per month, so under the base assumptions conversion does not stand up economically. Umeda’s asking office rent of ¥18,524 is the highest district-level figure across the four cities and second only to Tokyo’s five central wards. Floor area that commands high office rent is hard for a hotel to match.
Vacancy Explains Almost None of Conversion Feasibility — an R² of 0.06
Plotting the seven districts’ vacancy rates against conversion headroom shows almost no relationship. The coefficient of determination (R²) is 0.06: variation in vacancy explains just 6% of the variation in feasibility. Correlation with market ADR, by contrast, is strong, with an R² of 0.75.
The contrast between Naka-ku, Yokohama (Kannai) and Kita-ku, Osaka (Umeda) is typical. Kannai’s 7.77% vacancy is the highest of the seven, yet its headroom of +56.0% is only mid-pack, because its market ADR of ¥11,400 is just under 60% of the level in Nishi-ku, Yokohama. Conversely, Umeda’s 2.63% vacancy is among the lowest of the seven, yet its headroom of −5.9% is the only negative figure. The intuition that high vacancy makes conversion easy, and low vacancy makes it hard, holds in neither direction.
In practice this changes the order of screening. Filtering candidate buildings by vacancy rate discards the most promising floor area first. What to look at first is the market ADR of the trade area, and next the rent level of the building in question. Vacancy comes into play later in the process, as a variable for estimating the cost of negotiating tenants out and the lead time to starting work.
ADR explains 75% of the variance in conversion headroom. Where the absolute ADR level clears break-even by a wide margin, there is room for a deal to work even if rent is somewhat high.
Within the same city, rents differ by as much as 1.6x between districts. The test has to run on the rent the target building actually commands, not on the city average.
Vacancy is not feasibility itself but a variable governing the cost of negotiating tenants out and the timing of the start. It cannot be used as the entry filter.
Sensitivity Analysis — Room-Size Allocation Moves the Verdict Most
Flexing each variable from the base case shows how robust the verdict is. In short, the floor area allocated per guestroom swings the result more than occupancy or GOP margin do. Revenue per tsubo is earned by fitting rooms into the area, so the larger the rooms, the more linearly per-tsubo revenue falls.
Solving for the room size at which the gap falls to zero gives 46.3 m² in Nishi-ku, Yokohama, 31.4 m² in Aoba-ku, Sendai, 28.1 m² in Naka-ku, Yokohama, 27.7 m² in Chuo-ku, Osaka, 24.3 m² in Nakamura-ku, Nagoya, 22.5 m² in Naka-ku, Nagoya and 16.9 m² in Kita-ku, Osaka. Converting in Umeda is therefore confined to a compact design of under 17 m² per room, while in Nishi-ku, Yokohama rooms of up to 46 m² still beat office rental. Even under the same “office conversion hotel” label, the product that works looks entirely different from area to area.
| District | 14 m² | 16 m² | 18 m² (base) | 20 m² | 22 m² | 25 m² | Break-even room size |
|---|---|---|---|---|---|---|---|
| Nishi-ku, Yokohama | +25,169 | +20,659 | +17,152 | +14,347 | +12,051 | +9,297 | 46.3 m² |
| Aoba-ku, Sendai | +9,684 | +7,498 | +5,797 | +4,437 | +3,323 | +1,988 | 31.4 m² |
| Naka-ku, Yokohama | +10,548 | +7,919 | +5,874 | +4,238 | +2,899 | +1,293 | 28.1 m² |
| Chuo-ku, Osaka | +9,631 | +7,194 | +5,299 | +3,783 | +2,543 | +1,054 | 27.7 m² |
| Nakamura-ku, Nagoya | +8,098 | +5,705 | +3,844 | +2,354 | +1,136 | −326 | 24.3 m² |
| Naka-ku, Nagoya | +6,609 | +4,426 | +2,729 | +1,370 | +259 | −1,075 | 22.5 m² |
| Kita-ku, Osaka | +3,214 | +896 | −907 | −2,349 | −3,530 | −4,946 | 16.9 m² |
The sensitivity to occupancy and GOP margin is worth checking too. Cutting occupancy to 72% halves the gap in Naka-ku, Nagoya from ¥2,700 to ¥1,400 per tsubo per month and worsens Kita-ku, Osaka from −¥900 to −¥2,300. At 88% occupancy, Kita-ku, Osaka turns marginally positive at +¥500. Taking the GOP margin down to a conservative 33% narrows the gap in Chuo-ku, Osaka from ¥5,300 to ¥2,600. None of these alone flips the sign, but the districts with headroom below 30% — the two in Nagoya and Kita-ku, Osaka — sit in a band where the conclusion changes with the assumptions.
The table below folds this across districts onto a single sheet. Redrawing break-even ADR under three scenarios that move occupancy and GOP margin in the same direction (pessimistic 72% / 33%, mid 80% / 40%, optimistic 88% / 47%), the seven districts split into four that work under every scenario, two whose sign changes with the scenario, and one that does not work under the base assumptions.
| District | Market ADR (trailing 6M) | Pessimistic Assumes: 72% occupancy, 33% GOP margin | Mid (base) Assumes: 80% occupancy, 40% GOP margin | Optimistic Assumes: 88% occupancy, 47% GOP margin | |||
|---|---|---|---|---|---|---|---|
| Break-even ADR | Headroom | Break-even ADR | Headroom | Break-even ADR | Headroom | ||
| Nishi-ku, Yokohama (Yokohama Sta. / Minato Mirai 21) | 19,630 | 10,275 | +91.0% | 7,629 | +157.3% | 5,903 | +232.6% |
| Aoba-ku, Sendai (Station front / Ichibancho) | 9,519 | 7,358 | +29.4% | 5,463 | +74.2% | 4,227 | +125.2% |
| Naka-ku, Yokohama (Kannai) | 11,447 | 9,882 | +15.8% | 7,337 | +56.0% | 5,677 | +101.6% |
| Chuo-ku, Osaka (Yodoyabashi / Hommachi / Semba) | 10,607 | 9,292 | +14.2% | 6,899 | +53.7% | 5,338 | +98.7% |
| Nakamura-ku, Nagoya (Meieki) | 10,418 | 10,409 | +0.1% | 7,729 | +34.8% | 5,980 | +74.2% |
| Naka-ku, Nagoya (Sakae / Fushimi / Marunouchi) | 9,503 | 10,228 | −7.1% | 7,594 | +25.1% | 5,875 | +61.7% |
| Kita-ku, Osaka (Umeda) | 10,092 | 14,447 | −30.1% | 10,727 | −5.9% | 8,299 | +21.6% |
Under the pessimistic scenario, headroom in Nakamura-ku, Nagoya falls from +34.8% to +0.1%, and Naka-ku, Nagoya turns negative, from +25.1% to −7.1%. Both sit on the workable side under base assumptions, but the verdict reverses if occupancy and GOP fall together. Under the optimistic scenario, Kita-ku, Osaka (Umeda) moves from −5.9% to +21.6%, bringing the only negative district onto the workable side. The four districts of Nishi-ku Yokohama, Aoba-ku Sendai, Naka-ku Yokohama and Chuo-ku Osaka retain headroom of more than +14% even under the pessimistic case and are robust to how the assumptions are set. When taking a deal to an investment committee, separating out in advance whether it sits in the band where the sign flips keeps the discussion from turning into an argument over assumptions.
Conversion CapEx and Payback — 3.9 to 24.4 Years at ¥600,000–1,000,000 per Tsubo
A gap is meaningless if the conversion works eat it up. The main cost items in a change of use from office to hotel break down as follows.
| Cost item | Indicative (¥10,000/tsubo) | Description |
|---|---|---|
| Guestroom fit-out and interiors | 30–50 | Partitions, doors, floor, wall and ceiling finishes, built-in furniture. The main work of dividing a column-free standard office floor into guestrooms. |
| Bathrooms and plumbing | 15–25 | Unit bath installation, water supply and drainage to each room, new or additional risers. Offices carry plumbing only on a per-floor basis, making this one of the heaviest items in a conversion. |
| Fire safety and egress | 8–15 | Automatic fire alarm systems (mandatory for lodging use regardless of floor area), emergency lighting, sprinklers, securing two-way egress, and remediation of shaft compartmentation and smoke exhaust. |
| HVAC and electrical | 5–10 | Switching to individual room air conditioning, increasing incoming power capacity, per-room distribution. |
| Design and permitting | 3–6 | Building confirmation application for the change of use (over 200 m²), Hotel Business Act licence application, fire department consent, design supervision. |
| FF&E | 5–10 | Furniture, fixtures, equipment, bedding and in-room amenities. |
| Total | 66–116 | This article models payback at ¥600,000, ¥800,000 and ¥1,000,000 per tsubo. |
For an 18 m² room (6.81 tsubo), ¥600,000 per tsubo equates to roughly ¥4.1 million per room, ¥800,000 to about ¥5.5 million and ¥1,000,000 to about ¥6.8 million. Dividing that by the monthly gap per tsubo gives the payback period.
At ¥800,000 per tsubo, payback is 3.9 years in Nishi-ku, Yokohama, 11.3 years in Naka-ku, Yokohama, 11.5 years in Aoba-ku, Sendai, 12.6 years in Chuo-ku, Osaka, 17.3 years in Nakamura-ku, Nagoya and 24.4 years in Naka-ku, Nagoya. Set against a building’s remaining useful life and the owner’s holding policy, around ten years is the practical range for consideration. Nagoya’s two districts are hard to structure an investment period around on these assumptions. Narrowing the room to 15 m², however, shortens Meieki to 9.8 years and Sakae-Fushimi-Marunouchi to 12.2 years. Freedom in product design translates directly into feasibility.
A Note for Underwriting — Osaka’s ADR Has Stepped Down Recently
The market ADR used in these calculations is the trailing six-month average (March to August 2026). Compared with a longer 12-month average (10 months for the two Yokohama wards, given when observation began), the direction differs by city.
Chuo-ku, Osaka averages ¥10,600 over the trailing six months against ¥12,200 over 12 months — 12.7% lower. Kita-ku, Osaka is also down 11.4%, from ¥11,400 to ¥10,100. Autumn 2025 fell within the run of Expo 2025 Osaka, Kansai, when ADR was being pushed up; reading the figures as the payback from that is the natural interpretation. This article uses the trailing six-month average for its verdict in order to test feasibility against the more conservative current level. Using the 12-month average would turn Kita-ku, Osaka’s headroom positive at +6.2%, but that is not a premise we would adopt for underwriting.
Aoba-ku, Sendai and Nakamura-ku, Nagoya are both essentially flat, with movement under 0.2%, while Nishi-ku, Yokohama is up 0.7% and Naka-ku, Yokohama up 1.1%. Because conversion decisions run on a multi-year horizon, the premise is to look at averages across several periods, with a range, rather than at a single month or quarter.
Whether a conversion works is ultimately a building-by-building judgement. The calculations here show the average income differential for an area. Actual feasibility turns on individual conditions beyond zoning: whether the building is legally non-conforming, compliance on two-way egress, shaft compartmentation and smoke exhaust, seismic performance, whether riser routes can be secured, adjacent-site and shadow regulations, and the outlook for fire department consent. Two buildings in the same district at the same rent level can split between workable and not. The figures here are for prioritising candidates and do not substitute for a decision on an individual deal.
Conclusion — Shifting the Test from Vacancy to Income per Tsubo
The office market in 2026 is one of low vacancy and rising rents. The premise of “converting because there is spare vacancy” does not hold, at least in the office clusters of major cities. Feasibility can be judged only on the income differential — how much the same floor area earns per tsubo per month.
Calculating break-even ADR across seven major office districts in Yokohama, Nagoya, Sendai and Osaka produced a spread of almost 2x, from ¥5,500 in Aoba-ku, Sendai to ¥10,700 in Kita-ku, Osaka (Umeda). Against market ADR, Nishi-ku, Yokohama has by far the widest headroom at +157.3%, followed by Aoba-ku, Sendai at +74.2%, Naka-ku, Yokohama at +56.0% and Chuo-ku, Osaka at +53.7%. Nagoya’s two districts are thin at +25% to +35%, and Kita-ku, Osaka is negative under the base assumptions. As a reference point, the break-even ADR for Tokyo’s five central wards is ¥13,600 — a conspicuously high hurdle.
And vacancy explains almost none of that feasibility (R²=0.06). Kannai, with the highest vacancy at 7.77%, has only mid-pack headroom, while Umeda, among the lowest at 2.63%, is the only negative. For mid-sized building owners, funds hunting value-add deals and lenders underwriting conversions alike, the entry filter should be the market ADR of the trade area, not the vacancy rate. Layering the target building’s rent level, the intended room size and conversion CapEx on top of that produces the answer in the form of a payback period.
Related Reading
- Department Store Sites: 6 of 14 Go Hotel, ADR Needs 1.4-3.1x Market
- Old Malls and Warehouses as Next Hotel Rooms: Conversion Investment Boundaries
- Hotel Development Capacity 2026: Zoning, FAR & Land Price in 5 Markets
- Japan’s Pre-1981 Hotel Stock: 236k Rooms, 19.1% — Retrofit or Rebuild
- Policy Rate 1.00%: Break-Even ADR Across Japan’s 8 Hotel Markets
- Banquet Floors to Guestrooms: 20 Markets Clear the ¥9,600 ADR Line
References and Sources
■ Data sources
Market ADR on the hotel side is the estimated settled ADR compiled by MetroEngines Research & Consulting (an estimate on a tax-exclusive equivalent basis, derived by applying segment-specific adjustment coefficients to the per-room rate at double occupancy; 7 wards, N=17–192 properties, September 2025 to August 2026). The office side uses the average vacancy rates and average asking rents published in Miki Shoji “Office Market” as of July 2026 (asking rent for a standard floor, excluding common area charges and consumption tax). Zoning and published land prices are from the MLIT Real Estate Information Library. The levels used for occupancy and GOP margin draw on the Japan Tourism Agency’s Overnight Travel Statistics Survey (2025 final figures) and the property-level disclosure of listed hotel REITs.
■ Calculation assumptions
The base case is an 18 m² room, a 20% corridor loss (6.81 tsubo per room), 80% occupancy, a 40% GOP margin, a 15% office operating cost ratio and 30.4 days per month. On the office side, asking rent × (1 − vacancy rate) × (1 − operating cost ratio) is taken as the NOI equivalent; on the hotel side, ADR × occupancy × 30.4 ÷ tsubo per room × GOP margin is taken as monthly GOP per tsubo, and the ADR level at which the two are equal is defined as the break-even ADR. Sensitivity analysis flexes occupancy at 72/80/88%, GOP margin at 33/40/47%, room private area from 14 to 25 m², and conversion CapEx at ¥600,000/800,000/1,000,000 per tsubo. Land cost, interest, opportunity cost and the rental income forgone during construction are excluded from the calculations.
■ Limitations and caveats
(1) Within the trailing six-month average market ADR, the August 2026 component is on a listing-snapshot basis (an estimate from currently published prices rather than confirmed history) and may move once finalised. Because that month is the lowest value in the period for six of the seven districts, the six-month average leans conservative. (2) Office rent is the city average (district-level rent for the two Osaka districts only) and vacancy is the simple average of district-level values, so both may diverge from the rent the target building actually commands. The test must be rerun on the building’s own market rent. (3) Feasibility turns, beyond zoning, on building-specific conditions: whether the building is legally non-conforming, compliance on two-way egress, shaft compartmentation and smoke exhaust, seismic performance, and whether riser routes can be secured. The figures here are for prioritising candidates and do not substitute for a decision on an individual deal. (4) The “592 properties covered” in the opening KPIs is the count of properties confirmed as listed on OTAs, while the 562 properties totalled in the N figures on each chart and table is the count for which ADR could be calculated; the two definitions differ.
■ Market data
- MetroEngines Research & Consulting — estimated settled ADR (September 2025 to August 2026, 7 wards, N=17–192 properties); room and property counts confirmed as listed on OTAs
■ Office market
- Miki Shoji (三鬼商事) “Office Market” (as of July 2026) — Tokyo / Yokohama / Nagoya / Sendai / Osaka. Average rent is the asking rent for a standard floor, excluding common area charges and consumption tax
- Sumitomo Mitsui Trust Bank, Monthly Research Report, April 2026: “Outlook for the Office Markets of Japan’s Seven Major Cities 2026”
■ Government statistics and public data
- MLIT Real Estate Information Library — Published Land Prices / Prefectural Land Price Survey (2025), urban planning decisions (zoning)
- Japan Tourism Agency, Overnight Travel Statistics Survey (April 2026 second preliminary, May 2026 first preliminary, and 2025 annual final figures) — 2025 room occupancy of 75.3% for business hotels and 74.1% for city hotels
■ REIT and industry reports
- Invincible Investment Corporation (インヴィンシブル投資法人) portfolio disclosure — actual GOP margin of 38.9% across 91 properties entrusted to operators (fiscal period ended December 2024)
- Monthly operating disclosures of listed hotel REITs — property-level occupancy, ADR and RevPAR for properties in the four cities covered
■ Construction costs and regulation
- Benchmark interior construction costs for hotels and ryokan (unit cost per tsubo and per guestroom)
- Points to watch in a change of use to lodging, with worked examples
- Case study: converting vacant offices to hotels — design and regulatory response — change-of-use confirmation applications, fire safety equipment, egress rules