

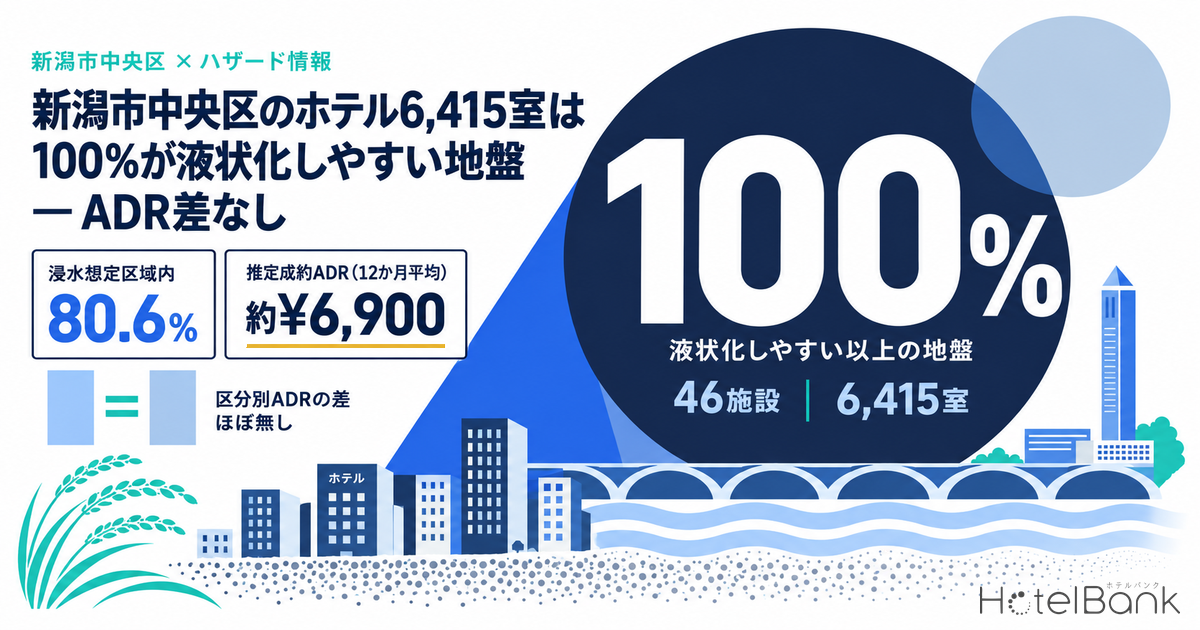
We overlaid the locations of the 46 hotels (6,415 rooms) operating in Chuo Ward, Niigata City on the Ministry of Land, Infrastructure, Transport and Tourism (MLIT) “Liquefaction Tendency Map Based on Landform Classification.” The result: all 46 properties sit in zones rated “liquefaction-prone” or higher. Of these, 34 properties with 5,171 rooms also fall within the flood inundation zone (maximum assumed scale). Yet when we compare estimated settled ADR by ground class and by inundation depth, there is almost no difference in rate levels. For anyone acquiring a hotel in central Niigata, ground risk is not something you can “avoid by choosing”; it is something you must “read property by property under identical conditions.” This article cross-references our property master with public hazard data and sets out the issues that asset managers, lenders and due diligence teams need to cover.
Metric Definitions Used in This Article
- ADR (Average Daily Rate): An estimated settled rate (tax-exclusive equivalent), calculated by applying segment-specific adjustment factors to the lowest-plan rate each property publishes on major booking sites (per room, 2 guests per room, tax-inclusive). Checked against property-level results disclosed by listed hotel REITs (91 properties, most recent 3 months), the median error is about 7%. These are estimates and differ from each property’s actual transaction prices and accounting figures. Area-level ADR is the median of the covered properties (the level of a typical property in the area).
- Listed price: The average across all plans (from room-only to meal-inclusive), per room for 2 guests per room (tax-inclusive). This uses a different basis from ADR.
- OCC (occupancy rate): Rooms sold as a share of total rooms in the area (an estimate based on inventory sold on major booking sites). Used only at the prefecture level; not applied to individual properties.
- Ground class: The liquefaction tendency (6 levels) from the MLIT Real Estate Information Library’s “Liquefaction Tendency Map Based on Landform Classification.” We use the class of the mesh containing each property’s representative coordinates.
- Inundation depth: The inundation depth rank from the same library’s “Flood Inundation Zones (Maximum Assumed Scale).” Where a property’s coordinates fall within more than one assumed zone, we use the deepest rank.
- Data sources: MetroEngines Research & Consulting / MLIT Real Estate Information Library
Source: Compiled by MetroEngines Research & Consulting from MetroEngines Research & Consulting data and the MLIT Real Estate Information Library
- — 100% All 46 hotels (6,415 rooms) operating in Chuo Ward, Niigata City sit in zones rated “liquefaction-prone” or higher on MLIT’s liquefaction tendency map.
- — 80.6% Of the same 46 properties, 34 (5,171 rooms) also lie within the flood inundation zone (maximum assumed scale), and 32 (4,816 rooms) are in the 0.5 m to under 3.0 m depth band.
- — About a 4% gap Estimated settled ADR (Sep 2025 – Aug 2026) is ¥7,198 outside the inundation zone and ¥6,907 in the 0.5 m to under 3.0 m band. That gap is smaller than the spread between properties: the hazard is not priced into rates.
- — 20.6% Nine properties with 1,320 rooms opened before 1981. Because ground conditions do not differentiate this market, building-specific factors (foundation type, bearing stratum, equipment layout, PML and insurance) become the core of due diligence.
- — About ¥16.48 million Lost room revenue per month (30 days) of business interruption, modeled for 100 rooms at an estimated settled ADR of ¥6,865 and a full-year OCC of 80%. Business interruption insurance indemnity periods should be checked alongside the assumed recovery period.
Chuo Ward’s hotel stock is not spread across ground classes
First, the scope. Our property master shows 46 hotels and ryokan (6,415 rooms) operating in Chuo Ward, Niigata City. Properties with 100 or more rooms account for 27 of them and 5,341 rooms. Chuo Ward is the urban core running from Niigata Station through Bandai to Furumachi, so these 46 properties are effectively the backbone of Niigata City’s lodging supply. For reference, Nishi Ward has 6 properties (360 rooms) and Konan Ward has 3 properties (206 rooms).
We overlaid the representative coordinates of these 55 properties on the MLIT Real Estate Information Library’s “Liquefaction Tendency Map Based on Landform Classification.” The map uses landform classification to rate liquefaction susceptibility on six levels (very liquefaction-prone / liquefaction-prone / somewhat liquefaction-prone / somewhat liquefaction-resistant / liquefaction-resistant / not assessed). It is a tool for wide-area screening, not a site-by-site determination based on boring surveys.
The result was clear-cut. All 46 Chuo Ward properties fall in the “liquefaction-prone” or higher classes, and one property with 304 rooms is in the highest class, “very liquefaction-prone.” By room count, that is 100% of 6,415 rooms. By landform, 5,341 rooms (40 properties) sit on deltas and coastal lowlands, 574 rooms (3 properties) on natural levees, and 196 rooms (2 properties) on reclaimed land. All of these are alluvial lowlands formed at the mouth of the Shinano River; the only property on a sand dune is one with 304 rooms, on a “gentle slope at the edge of a sand dune.”
Given how central Niigata developed, this is not surprising. Niigata City grew on sandy sediment carried by the Shinano and Agano rivers, and the heart of the urban area has long been located on the lowlands behind the dunes. In other words, a diversification strategy of “buying only parcels with good ground” is simply not available within Chuo Ward. In Nishi Ward, two properties (35 rooms) sit on dunes and are rated “somewhat liquefaction-resistant,” but both are small; assets of investable scale are concentrated on Chuo Ward’s lowlands.
Source: MLIT Real Estate Information Library, “Liquefaction Tendency Map Based on Landform Classification” / property master from MetroEngines Research & Consulting (operating, 55 properties)
| Ward | Liquefaction tendency | Properties | Rooms | Share of rooms |
|---|---|---|---|---|
| Chuo Ward | Very liquefaction-prone | 1 | 304 | 4.7% |
| Chuo Ward | Liquefaction-prone | 45 | 6,111 | 95.3% |
| Chuo Ward | Somewhat liquefaction-prone or lower | 0 | 0 | 0.0% |
| Nishi Ward | Very liquefaction-prone | 1 | 152 | 42.2% |
| Nishi Ward | Liquefaction-prone | 3 | 173 | 48.1% |
| Nishi Ward | Somewhat liquefaction-resistant | 2 | 35 | 9.7% |
| Konan Ward | Liquefaction-prone | 3 | 206 | 100.0% |
Source: MLIT Real Estate Information Library / MetroEngines Research & Consulting (N=55 properties, operating)
On the map: the urban area itself sits on lowland
The map below shades the liquefaction tendency of central Chuo Ward on a 250 m mesh and overlays hotel locations as circles, with circle size proportional to room count. It does not assess the risk of any individual property; read it as a way to see the structure, namely that almost the entire urban area is covered in the same dark shades. The band of built-up area along both banks of the Shinano River, from Bandai to Furumachi and Hakusan, sits directly on the lowland.
Source: MLIT Real Estate Information Library, “Liquefaction Tendency Map Based on Landform Classification” / property locations from MetroEngines Research & Consulting (N=46 properties)
For reference, liquefaction damage in Niigata City from the January 2024 Noto Peninsula Earthquake was concentrated not in Chuo Ward but, as reported by the Niigata Nippo, in the Sakaiwa and Zenku areas of Nishi Ward and the Amano area of Konan Ward. These areas are rated high-risk on the liquefaction susceptibility maps published by MLIT’s Hokuriku Regional Development Bureau and others, and they overlap the areas that liquefied in the 1964 Niigata Earthquake. It is true that Chuo Ward did not see residential damage on the same scale, but with a different epicenter, duration of shaking or groundwater level, the outcome might not be the same. Under the landform classification, Chuo Ward belongs to the same “liquefaction-prone” band, and acquirers should take that as a starting assumption.
Liquefaction and flooding overlap in the same places: 80.6% of rooms are in the inundation zone
Being lowland also means being likely to overlap with flood hazard zones. Overlaying the same 46 properties on the flood inundation zones (maximum assumed scale), 34 properties with 5,171 rooms fall inside an inundation zone, or 80.6% of rooms. By depth, 32 properties (4,816 rooms) are in the 0.5 m to under 3.0 m band and 2 properties (355 rooms) are under 0.5 m; only 12 properties (1,244 rooms) are outside the zone. The rivers covered by the assumption include the Shinano River as well as the Tsusen River, the Koaganogawa River and Lake Toyano.
A depth range of 0.5 to 3.0 m is not a level at which a hotel building would be washed away. But it is the range in which the lobby, kitchen, restaurant, power receiving equipment, machine rooms and server rooms, which tend to be concentrated on the ground floor, go under water, and it is exactly this band that determines how long recovery and business interruption last. A defining feature of central Niigata’s risk profile is that two scenarios can play out on the same site: an earthquake causing differential settlement and damage to buried pipes through liquefaction, and, on a separate occasion, flooding that knocks out basement and ground-floor equipment.
The picture is the same if we narrow the set to the 27 properties with 100 or more rooms (5,341 rooms). Twenty properties (3,864 rooms) fall into the “liquefaction-prone × 0.5 m to under 3.0 m” combination, and one property (304 rooms) into “very liquefaction-prone × same depth.” Only 5 properties with 100 or more rooms (908 rooms) are outside the inundation zone. The larger the asset, the more likely it is to be in the lowland core, a distribution that simply follows how the city grew.
Source: Compiled by MetroEngines Research & Consulting from MLIT Real Estate Information Library, “Flood Inundation Zones (Maximum Assumed Scale)” (N=46 properties, Chuo Ward)
| Ground class × inundation depth (max. assumed scale) | Properties | Rooms | Of which 100+ rooms |
|---|---|---|---|
| Liquefaction-prone × 0.5 m to under 3.0 m | 31 | 4,512 | 20 properties, 3,864 rooms |
| Liquefaction-prone × outside inundation zone | 12 | 1,244 | 5 properties, 908 rooms |
| Liquefaction-prone × under 0.5 m | 2 | 355 | 1 property, 265 rooms |
| Very liquefaction-prone × 0.5 m to under 3.0 m | 1 | 304 | 1 property, 304 rooms |
| Total | 46 | 6,415 | 27 properties, 5,341 rooms |
Source: Compiled by MetroEngines Research & Consulting from the MLIT Real Estate Information Library
No gap in estimated settled ADR between classes: the risk is not priced in
So are these differences in ground and flood conditions reflected in room rates? Over the 12 months from September 2025 to August 2026, Chuo Ward’s estimated settled ADR averaged about ¥6,900 (44–46 properties per month covered for estimated settled ADR; 45–53 properties per month with confirmed listings). The average listed price over the same period (all-plan average, tax-inclusive) was about ¥13,100; because the two use different bases, they cannot be compared directly.
Split by micro-landform, rates were about ¥7,100 for deltas and coastal lowlands (N=34 properties), about ¥6,600 for natural levees (N=3), about ¥6,400 for reclaimed land (N=1) and about ¥10,400 for the gentle slope at a dune’s edge (N=1). By inundation depth, properties outside the zone came in at about ¥7,200 (N=9) versus about ¥6,900 for the 0.5 m to under 3.0 m band (N=28). That gap of about 4% is clearly smaller than the spread between properties (roughly ¥4,000 to ¥22,700 in Chuo Ward). Many classes have small samples, so no statistically meaningful difference can be claimed.
If anything, what we see is the opposite relationship. The tier with the highest estimated settled ADR in Chuo Ward is the urban core around the station and Bandai, where large limited-service hotels mix with upscale city hotels, and most of those are inside the 0.5 m to under 3.0 m band. In Nishi Ward, the only property rated “very liquefaction-prone” (former river channel / former pond) has an estimated settled ADR of about ¥8,300, above the ward average (about ¥7,300 on a 12-month average). The straightforward reading is that rates are set by location and hotel type, not by ground conditions, and ground and flood risk are barely visible as a price signal.
It is not that investors don’t care. In Special Survey (II) of the Japan Real Estate Institute’s 54th Japanese Real Estate Investor Survey (as of April 2026), 58.4% of respondents named “flooding (inland and river flooding)” and 34.4% named “earthquakes and tsunami” as the natural disaster risks they focus on most when investing or lending (125 valid responses). In the same survey, 62.3% (122 valid responses) said “measures to improve real estate resilience, such as flood countermeasures” had become a greater priority. Investor interest is high, yet it is not yet reflected in hotel rates in regional core cities. That gap gives acquirers room to negotiate, and it could also become a discount factor at exit. We have also looked at how far hazard conditions are priced into rates and capex across multiple markets in a separate analysis that quantifies disaster risk as the fourth axis of hotel site evaluation.
Source: MetroEngines Research & Consulting (Sep 2025 – Aug 2026, property median of estimated settled ADR) / classifications from the MLIT Real Estate Information Library
| Class | Properties | Median estimated settled ADR | vs. Chuo Ward overall |
|---|---|---|---|
| Delta / coastal lowland | 34 | ¥7,110 | +0.8% |
| Natural levee | 3 | ¥6,553 | -7.1% |
| Reclaimed land | 1 | ¥6,437 | -8.8% |
| Gentle slope at dune edge | 1 | ¥10,397 | +47.4% |
| Outside inundation zone | 9 | ¥7,198 | +2.0% |
| Inundation depth under 0.5 m | 2 | ¥8,612 | +22.1% |
| Inundation depth 0.5 m to under 3.0 m | 28 | ¥6,907 | -2.1% |
| Chuo Ward, all properties | 39 | ¥7,054 | — |
Source: MetroEngines Research & Consulting (median of each property’s average estimated settled ADR for Sep 2025 – Aug 2026; N=39 properties) / classifications from the MLIT Real Estate Information Library
Source: MetroEngines Research & Consulting (N=39 Chuo Ward properties with estimated settled ADR available for Sep 2025 – Aug 2026) / inundation depth classes from the MLIT Real Estate Information Library
Demand side: rates are rising and occupancy is high
Listing risks alone does not make an investment decision. On the demand side, Niigata Prefecture’s estimated settled ADR was about ¥11,300 in August 2026, down 4.6% from about ¥11,900 a year earlier (August 2025). On the other hand, January 2026 came in at about ¥11,200, up 18.9% from about ¥9,500 in January 2025, and May 2026 at about ¥9,700, up 2.9% from about ¥9,400 in May 2025. Month-to-month swings aside, the full-year trend is gently upward. For the investment opportunity by area within Niigata Prefecture, our Niigata Hotel Investment Map breaks it into three layers: Niigata City, Echigo-Yuzawa and Sado.
Occupancy (estimated, based on inventory listed on major booking sites) in Niigata Prefecture in August 2026 was 87.9% for all properties (240 properties / 11,947 rooms covered) and 89.4% for business hotels (42 properties / 5,369 rooms). July 2026 was 82.1% for all properties (227 properties / 11,830 rooms) and June 2026 was 82.9% (231 properties / 10,755 rooms), showing sustained high occupancy centered on the summer. These are estimates based on how inventory sold on major booking sites is absorbed and differ from a property’s actual overall occupancy, but central Niigata is not a market with thinning demand.
In short, Chuo Ward assets combine “earnings that hold up” with “hazards that are structurally unavoidable.” This is not a negative conclusion. It means that if price and capital expenditure are designed with the hazard factored in, there are still positions worth taking.
Source: MetroEngines Research & Consulting (Niigata Prefecture, property median of estimated settled ADR; 405–436 properties covered per month)
Five items to confirm in due diligence
With ground classes uniform, the DD question shifts from “which parcel to choose” to “how well this building withstands liquefaction and flooding.” When finalizing the scope for the engineering report, at least the following five points should be checked individually. Note that the depth of the bearing stratum drives not only seismic performance but also the cost of foundation work itself; we have modeled the cost impact of bearing-stratum depth separately for Tokyo Bay hotel sites.
| Issue | What to confirm | Where to get the documents |
|---|---|---|
| 1. Foundation type and pile type | Spread footing or pile foundation. For piles, whether precast concrete, cast-in-place or steel pipe, and the year of installation. Whether the piles penetrate the liquefiable layer and reach the bearing stratum. | Structural drawings, pile layout plans, pile installation records (held by the seller) |
| 2. Bearing stratum depth and groundwater level | N-value profile from boring logs, depth of the bearing stratum, thickness of sandy soil layers and groundwater level. Whether a liquefaction assessment (FL and PL values) has been carried out. | Geotechnical survey report / boring logs published by the municipality |
| 3. Seismic PML | Probable maximum loss as a share of replacement cost. Whether it was calculated under conditions that include ground deformation from liquefaction (standard conditions may not include it). | Seismic risk assessment (PML) report |
| 4. Insurance terms | Whether there is an earthquake coverage endorsement, its limit and deductible, and the scope of flood coverage. Whether basement and ground-floor equipment and fixtures are covered. The indemnity period of business interruption insurance. | Insurance policies and endorsements (held by the seller) |
| 5. BCP and equipment layout | Which floor houses the power receiving equipment, emergency generator, boilers, kitchen and servers. Whether flood barriers and watertight doors are in place. Water supply plan during outages and receiving tank capacity. | Equipment drawings, BCP documents, site inspection |
Source: Compiled by HotelBank Editorial Team / MetroEngines Research & Consulting
The third point is especially easy to overlook. Seismic PML is generally defined as the physical loss at a 90% non-exceedance probability, as a share of replacement cost, for ground motion with a 10% probability of exceedance over the next 50 years. In lending and DD practice, a PML of 15% is often referenced as a rule of thumb. However, standard assessment conditions may not fully reflect ground deformation from liquefaction, so for assets in central Niigata it is worth explicitly commissioning an assessment that includes liquefaction. The same building can produce different PML levels depending on the calculation conditions.
On the fourth point, insurance, the uniform ground conditions mean that the assumption “other properties in the same area are insured, so we’ll be fine” does not hold. Insurability, premium rates and deductibles depend heavily on a building’s structural vintage and foundation type, so it is safer to confirm underwriting terms before acquisition. How much of the revenue lost during business interruption is covered matters especially for liquefaction damage, where recovery can take months.
As a guide to setting the indemnity period, we estimated the room revenue lost to business interruption. Using Chuo Ward’s estimated settled ADR (¥6,865, the Sep 2025 – Aug 2026 average, tax-exclusive equivalent), we show the room revenue of a 100-room property during closure along two axes: days closed and full-year OCC (an assumed value for modeling purposes). In the middle case of 80% full-year OCC and 90 days closed, the loss is about ¥49.43 million; in the pessimistic case of 180 days it reaches about ¥98.86 million. The number of days closed is a modeling assumption, not a forecast of the actual recovery period.
| Scenario (days closed) | Full-year OCC 70% | Full-year OCC 80% | Full-year OCC 90% |
|---|---|---|---|
| Optimistic: 30 days closed | ¥14.42M | ¥16.48M | ¥18.54M |
| Middle: 90 days closed | ¥43.25M | ¥49.43M | ¥55.61M |
| Pessimistic: 180 days closed | ¥86.50M | ¥98.86M | ¥111.21M |
| Reference: 365 days closed | ¥175.40M | ¥200.46M | ¥225.52M |
Source: Compiled by MetroEngines Research & Consulting (simple product of estimated settled ADR ¥6,865 × 100 rooms × full-year OCC × days closed; excludes F&B and ancillary revenue, variable-cost savings during closure, and insurance payouts)
Actual losses will not equal lost room revenue, since fixed costs continue during closure while variable costs fall. Even so, the sense that the revenue at stake doubles depending on whether the indemnity period is set at three months or six is a useful starting point when reading insurance terms.
Capex and subsidies: public support rarely reaches a standalone hotel
How to budget capital expenditure for liquefaction countermeasures is the last open question in DD. The point to note here is that the government’s main support program, the “Residential Land Liquefaction Prevention Project” (funded through the Disaster Prevention and Safety Grant), is designed in a way that a standalone hotel site will struggle to qualify for.
According to the program overview published by MLIT, the project assumes that public facilities such as roads and sewers are treated together with adjacent residential land, and the grant rate is 1/4 (1/2 where certain requirements are met, and 1/2 for restoring developed residential land damaged by the Noto Peninsula Earthquake and similar events). The area requirements include a contiguous site of 3,000 m² or more judged highly likely to suffer significant liquefaction damage, and at least 10 houses within the area. The implementing body is a local government or the landowners.
In other words, it is not realistic to expect a hotel, a non-residential asset on a standalone site, to obtain subsidies for countermeasure costs through this framework alone. Niigata City has been working on block-level liquefaction countermeasures since the Noto Peninsula Earthquake, and it is worth checking with the city in advance whether a site falls within a target area, but as a rule, investment decisions should assume the owner bears the cost of countermeasures.
On that premise, the practical options fall broadly into three tiers. First, if the existing building’s foundation reaches the bearing stratum, direct investment not at the ground itself but at reducing damage to utilities and equipment (flexible joints for buried pipes, moving power receiving equipment and generators to upper floors, installing flood barriers). Second, include in planned renewals the areas where ground settlement or tilting directly affects operations (entrance, drop-off area, parking and exterior works). Third, quantify, against an assumed recovery period, the line between risk that can be transferred through insurance and risk to be retained. Costs vary widely from building to building in all three cases, so generic unit-cost benchmarks should not be stacked up. The practical process is to obtain an engineering report and an on-site estimate from a contractor, and then build the figures into the long-term maintenance plan.
Building vintage: 20% of rooms opened before 1981
Finally, the building vintage of the population. By decade of opening, Chuo Ward’s 46 properties break down as follows: 1950s, 1 property (26 rooms); 1960s, 3 properties (485 rooms); 1970s, 4 properties (659 rooms); 1980s, 7 properties (1,336 rooms); 1990s, 6 properties (795 rooms); 2000s, 12 properties (2,033 rooms); 2010s, 13 properties (1,081 rooms). Nine properties with 1,320 rooms opened before 1981, or 20.6% of rooms.
Opening year is not the same as the year of construction, and it does not reflect the history of extensions, renovations or seismic retrofits, so it cannot by itself support conclusions about seismic performance. Still, it is worth noting as a characteristic of the population that the stock is split around the New Seismic Design Standard (effective June 1981), and that the older side accounts for about 20% of Chuo Ward’s rooms. Meanwhile, the 25 properties (3,114 rooms, 48.5% of rooms) that opened in the 2000s or later were designed under the new standard, so even within the same ground class, building-side conditions vary widely. Precisely because ground conditions do not differentiate this market, buyers who can tell building-specific conditions apart gain an edge.
Frequently Asked Questions
Q. Should I avoid acquiring hotels on land rated “liquefaction-prone”?
A. In Chuo Ward, Niigata City, all 46 operating properties fall into that class, so avoiding it would mean acquiring no central assets at all. The deciding factors are not the class itself but building-specific conditions: foundation type, whether piles reach the bearing stratum, equipment layout and insurance terms.
Q. Is liquefaction risk reflected in acquisition prices?
A. In our analysis, comparing estimated settled ADR by ground class and inundation depth shows a gap of only about 4%, small relative to the spread between properties. In terms of room rates, the risk is barely observable as a price signal.
Q. What is the problem with being inside a flood inundation zone?
A. The 0.5 m to under 3.0 m depth range, the most common in Chuo Ward, is not enough to destroy a building, but it is the range in which the lobby, kitchen, power receiving equipment and machine rooms, concentrated on the ground floor and basement, are damaged. Because it directly determines the length of recovery and business interruption, the key checks are which floor equipment is on and the indemnity period of business interruption insurance.
Q. Are public subsidies available for liquefaction countermeasures?
A. The national “Residential Land Liquefaction Prevention Project” assumes area requirements such as a contiguous site of 3,000 m² or more with at least 10 houses in the area, and it is not designed for a non-residential asset on a standalone site to use on its own. It is worth checking whether a site falls within a municipal block-level project area, but as a rule plans should assume the owner bears the cost.
Q. Is lodging demand in Niigata City solid?
A. Niigata Prefecture’s occupancy (estimated, based on inventory listed on major booking sites) in August 2026 was 87.9% for all properties (240 properties / 11,947 rooms covered) and 89.4% for business hotels (42 properties / 5,369 rooms). Estimated settled ADR is also on a gently rising trend over the full year.
Summary
All of Chuo Ward’s 46 hotels (6,415 rooms) sit in zones rated “liquefaction-prone” or higher on MLIT’s liquefaction tendency map, and 34 of them (5,171 rooms, 80.6%) also lie within the flood inundation zone. Because the urban area is built on the alluvial lowland at the mouth of the Shinano River, portfolio diversification by “choosing parcels with good ground” does not work within Chuo Ward.
And judging by estimated settled ADR, these differences in conditions are not reflected in prices. Investor surveys show strong concern (58.4% for flooding and 34.4% for earthquakes/tsunami), yet no signal has yet appeared in lodging rates in regional core cities.
For acquirers there are three practical implications. First, shift the screening axis from ground class to building conditions (foundation type, bearing stratum, equipment layout). Second, explicitly commission a seismic PML that includes liquefaction, and read it together with the insurance terms. Third, build countermeasure costs into the long-term maintenance plan on an owner-funded basis, without counting on public subsidies. With demand holding at high occupancy, this is a market that still leaves negotiating room for buyers who can price the risk correctly.
Related Articles
References and Sources
■ Data sources
MetroEngines Research & Consulting property master (operating: 46 properties in Chuo Ward, 6 in Nishi Ward and 3 in Konan Ward, Niigata City), estimated settled ADR (Sep 2025 – Aug 2026), and occupancy estimates (Niigata Prefecture, based on inventory listed on major booking sites, Jun–Aug 2026). Ground classes and inundation depths from the MLIT Real Estate Information Library’s “Liquefaction Tendency Map Based on Landform Classification” and “Flood Inundation Zones (Maximum Assumed Scale).”
■ Modeling assumptions
Ground classes and inundation depths were assigned mechanically from the mesh containing each property’s representative coordinates. Class-level ADR is the median of each property’s 12-month average (N=39 properties). Lost revenue from business interruption is the simple product of 100 rooms, estimated settled ADR of ¥6,865 (Chuo Ward average for Sep 2025 – Aug 2026, tax-exclusive equivalent), full-year OCC of 70–90% (assumed values for modeling) and 30–365 days of closure; it excludes F&B and ancillary revenue, variable-cost savings during closure, and insurance payouts.
■ Limitations and caveats
The liquefaction tendency map is a wide-area screening tool based on landform classification, not a determination based on site boring surveys. Opening year does not reflect the year of construction or the history of extensions, renovations or seismic retrofits. Estimated settled ADR and occupancy are both estimates; some classes cover as few as N=1–3 properties, so no statistically meaningful difference between classes can be claimed. This analysis does not assess the safety of any individual property or whether it is suitable for acquisition.
■ Market data
- MetroEngines Research & Consulting — property master (operating: 46 properties in Chuo Ward, 6 in Nishi Ward and 3 in Konan Ward, Niigata City), estimated settled ADR (Sep 2025 – Aug 2026), occupancy estimates (Niigata Prefecture)
■ Government statistics and public data
- MLIT Real Estate Information Library, “Liquefaction Tendency Map Based on Landform Classification” and “Flood Inundation Zones (Maximum Assumed Scale)” (Japanese)
- MLIT, “Residential Land Liquefaction Prevention Project” (Embankment and Residential Land Disaster Prevention) (Japanese)
- MLIT, “Guidance for Promoting Urban Liquefaction Countermeasures” (Japanese)
- MLIT Hokuriku Regional Development Bureau, “Liquefaction Susceptibility Map for Niigata Prefecture” (Japanese)
- Niigata City, “Liquefaction Hazard Map” (Japanese)
- Niigata City, “Information on the 2024 Noto Peninsula Earthquake” (Japanese)
- Niigata Prefecture, “Information on the 2024 Noto Peninsula Earthquake (Damage and Contacts)” (Japanese)
■ Industry surveys
■ News
Scope of this analysis: Ground class and inundation depth were assigned mechanically from the mesh containing each property’s representative coordinates; they are not site-specific determinations based on on-site boring surveys. This analysis does not assess the safety, seismic performance or potential damage of any individual building, nor does it recommend or advise against acquiring or selling any specific property. Actual investment decisions require an engineering report and detailed investigation by specialists. Estimated settled ADR is an estimate and differs from each property’s actual transaction prices and accounting figures.