

The heaviest line item in the upfront cost of a hotel development is not the building but the land. With commercial land prices near stations still rising, the alternative to buying land that is actually used in practice is the fixed-term business land lease (jigyō-yō teiki shakuchiken) under Article 23 of Japan’s Act on Land and Building Leases. In this article we first establish station-front commercial land prices in 15 cities using the Ministry of Land, Infrastructure, Transport and Tourism (MLIT) official land price data, then model a 100-room limited-service hotel under two structures — “buy the land + own the building” and “fixed-term business land lease + own the building” — and back-solve the required ADR for each. We also examine how the cost of returning the site as vacant land at lease expiry and the use of the floor-area ratio affect feasibility.
Metric Definitions Used in This Article
- ADR (Average Daily Rate): An estimated contracted rate (tax-excluded equivalent), calculated by applying segment-specific adjustment factors to the lowest-plan rate each property publishes on major booking sites (2 guests per room, per-room price, tax included). Checked against property-level results disclosed by listed hotel REITs (91 properties, most recent 3 months), the median error is about 7%. These are estimates and differ from each property’s actual contracted prices and accounting figures. Area-level ADR is the median of the target properties (the level of a typical property in the area).
- Required ADR: In this article’s model, the ADR needed for the NOI yield on invested capital to reach the target level (base case 5.0%). All assumptions are listed in the assumptions table below.
- OCC (Occupancy Rate): This article uses the business-hotel room occupancy rate from the Japan Tourism Agency’s Overnight Travel Statistics Survey (2025 annual figure, final: 75.3%, published July 6, 2026) as the model assumption.
- Official land price (kōji chika): Standard sites from MLIT’s Land Price Publication (as of January 1, 2026) with the “commercial” land-use classification located within roughly 700m of each city’s main station.
- Data sources: MetroEngines Research & Consulting / MLIT Real Estate Information Library / Japan Tourism Agency
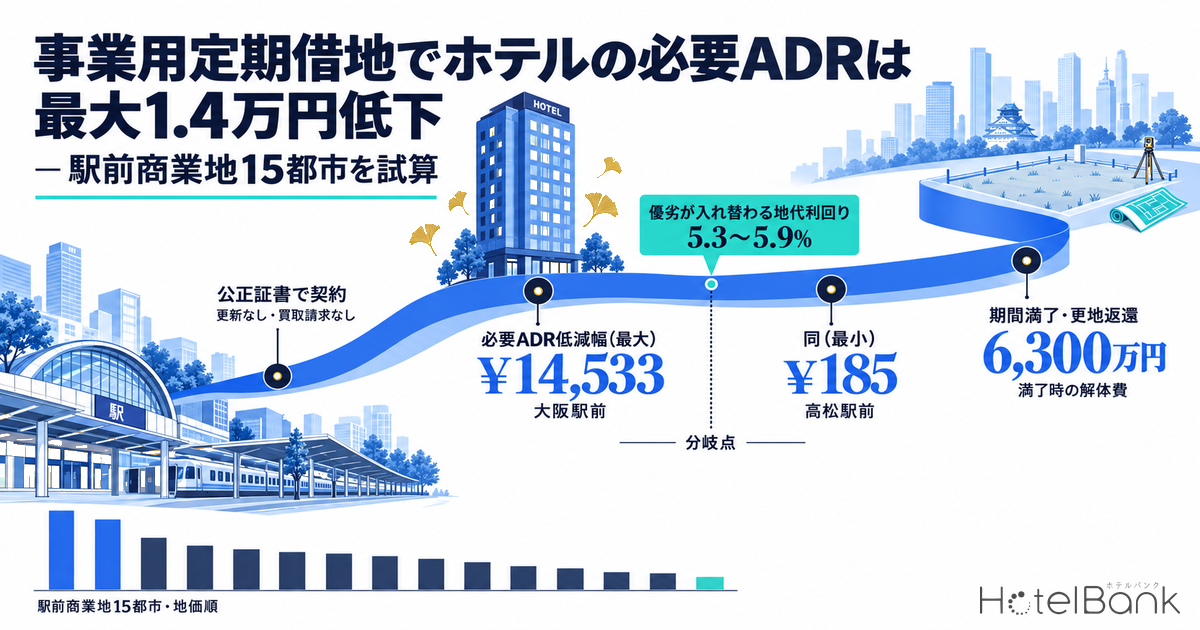
- — Assuming a 5.0% target NOI yield and a 4.5% ground-rent yield, the fixed-term business land lease lowered the required ADR in all 15 cities. The reduction ranged from ¥14,533 at Osaka Station to ¥185 at Takamatsu Station.
- — The ground-rent yield at which ownership and leasehold switch places is 5.25–5.89%. Most of the 3–6% range cited in practice sits below this break-even.
- — Median official prices for station-front commercial land span more than 40x, from ¥8.58M/m² in Osaka to ¥203,000/m² in Takamatsu. Year-on-year changes range from +15.9% in Yokohama to +1.6% in Kagoshima — each city is in a very different phase of the upcycle.
- — Doubling the demolition cost from ¥12,000/m² to ¥25,000/m² moves the required ADR by only about ¥120. End-of-lease costs do not decide feasibility.
- — Using the full floor-area ratio cuts the leasehold required ADR at Osaka Station from ¥56,359 to ¥27,606. The leasehold structure works best when paired with high-density design.
Conclusion — The Higher the Station-Front Land Price, the More a Land Lease Lowers Required ADR
The bottom line first. Under mid-range assumptions of a 5.0% target NOI yield and a 4.5% ground-rent yield, the fixed-term business land lease lowered the required ADR in all 15 cities. The size of the effect, however, tracks the land price level closely. At Osaka Station (Kita Ward, Osaka City), the required ADR is ¥70,892 under ownership versus ¥56,359 under leasehold — ¥14,533 lower — while at Takamatsu Station the gap is just ¥185, effectively no difference.
This gap is structural, not coincidental. Under ownership, the land carries a burden equivalent to “5.0% target yield + 1.2% fixed asset and city planning tax on land = 6.2%”, whereas under leasehold the land burden is simply the ground-rent yield. As long as the ground-rent yield stays below roughly 5.3–5.9% (the break-even after factoring in the opportunity cost of the security deposit and the demolition reserve), leasehold wins, and the gap grows in proportion to the land price. Most of the 3–6% ground-rent range cited in practice sits below this break-even, so the relative advantage of leasehold shows up most clearly in cities with expensive station-front land.
The Legal Framework — Fixed-Term Business Land Leases Come as a Package: No Renewal, No Buyout Right, Return as Vacant Land
Let us first lay out the legal framework. The Act on Land and Building Leases provides three types of fixed-term land lease, and the one used for hotel development is the fixed-term business land lease under Article 23. It cannot be used to own residential buildings, but in exchange it offers more flexibility in setting the lease term. Hotels and ryokan are treated as business buildings for lodging, so they can use this type.
| Type | Legal basis | Term | Use | Contract form | Renewal / building buyout right | At expiry |
|---|---|---|---|---|---|---|
| Fixed-term business land lease (long-term) | Act on Land and Building Leases, Art. 23(1) | 30 to under 50 years | Business buildings only | Notarial deed | Excluded by special agreement | As a rule, remove the building and return as vacant land |
| Fixed-term business land lease (short-term) | Act on Land and Building Leases, Art. 23(2) | 10 to under 30 years | Business buildings only | Notarial deed | Do not apply by operation of law | As a rule, remove the building and return as vacant land |
| General fixed-term land lease | Act on Land and Building Leases, Art. 22 | 50 years or more | No use restriction | In writing (notarial deed, etc.) | Excluded by special agreement | As a rule, remove the building and return as vacant land |
| Land lease with building transfer agreement | Act on Land and Building Leases, Art. 24 | 30 years or more | No use restriction | No specific formal requirement | Landowner buys the building at expiry | Building transferred to landowner (no demolition) |
There are three practical points. First, an Article 23 contract has no effect unless executed by notarial deed (paragraph 3 of the same article). Second, the long-term type (paragraph 1) must explicitly exclude renewal and the building buyout right by special agreement, whereas under the short-term type (paragraph 2) these simply do not apply by law. Third, because the lessee is obliged, as a rule, to remove the building and return the land vacant at expiry, demolition costs must be reserved during the project term. This third point works to narrow the gap with the ownership case in the feasibility calculation below.
If demolition is to be avoided, the Article 24 land lease with a building transfer agreement is an option, but it requires the landowner to pay for the building at expiry. That makes it hard to close when the landowner is a municipality, or when the landowner has no intention of acquiring a lodging facility more than 30 years old. This practical constraint is why Article 23 tends to be chosen for hotel development.
Three Typical Situations Where Hotel Developers Choose a Fixed-Term Business Land Lease
01 Public land tenders
When a municipality wants to attract lodging to city-owned land in front of a station without selling it, it runs a proposal tender that requires a fixed-term business land lease. Tender guidelines typically specify an opening deadline and a minimum number of years of operation.
02 Reserved floors and sites in station-front redevelopment
In urban redevelopment projects, landowners receive “rights floors” through rights conversion, while the “reserved floors” and surplus land created to fund the project must be disposed of. A fixed-term lease is used to bring in operators without transferring land ownership.
03 Landowners who will not sell
For landowners who refuse to sell for inheritance or business-succession reasons, developers build consensus by offering long-term stable income and the return of vacant land at expiry. The method became established in roadside retail development and has spread to hotels.
One example of a public land tender is the Iiyama Station Front City-Owned Land Lodging Facility Development Promotion Project, run by Iiyama City in Nagano Prefecture on city-owned land in front of Iiyama Station on the Hokuriku Shinkansen. The city published the proposal tender guidelines in April 2021 and adopted a framework in which it would sign a basic agreement and a fixed-term business land lease contract with the top-ranked bidder. According to the city, the lease contract was to be concluded by March 31, 2022, and the conditions were that the lodging facility open within three years of the contract and continue operating for at least 20 years. Fixing the opening deadline and minimum operating period at the tender-guideline stage is a design principle common to public land tenders. For the route by which public land comes to market for sale rather than lease, we have separately counted the individual lots offered in Japan’s state-owned land sales, finding 128 lots, of which only 4 could fit a 100-room hotel.
Station-Front Commercial Land Prices — Medians Across 15 Cities Span More Than 40x, from ¥200,000 to ¥8.58M per m²
As the basis for back-solving ground rent, we first establish land price levels. From the official land price data in MLIT’s Real Estate Information Library, we extracted standard sites classified as “commercial” within roughly 700m of each city’s main station, and compiled their median, maximum, year-on-year change and floor-area ratio. The reference date is January 1, 2026.
| City (station) | Median (¥/m²) | Maximum (¥/m²) | YoY (median) | FAR (median) | FAR (max) | Standard sites |
|---|---|---|---|---|---|---|
| Osaka (Osaka Sta.) | 8,580,000 | 24,700,000 | +8.1% | 600% | 800% | 7 |
| Nagoya (Nagoya Sta.) | 4,060,000 | 19,800,000 | +3.4% | 700% | 1300% | 17 |
| Fukuoka (Hakata Sta.) | 3,405,000 | 8,180,000 | +9.2% | 500% | 600% | 8 |
| Kyoto (Kyoto Sta.) | 2,170,000 | 8,870,000 | +15.2% | 300% | 600% | 7 |
| Saitama (Omiya Sta.) | 1,400,000 | 5,200,000 | +7.7% | 400% | 600% | 13 |
| Yokohama (Kannai Sta.) | 1,350,000 | 2,480,000 | +15.9% | 600% | 800% | 13 |
| Sendai (Sendai Sta.) | 1,280,000 | 4,880,000 | +12.0% | 500% | 700% | 13 |
| Sapporo (Sapporo Sta.) | 1,180,000 | 7,300,000 | +8.8% | 600% | 800% | 9 |
| Kobe (Sannomiya Sta.) | 1,120,000 | 8,000,000 | +8.8% | 600% | 800% | 12 |
| Hiroshima (Hiroshima Sta.) | 796,000 | 3,100,000 | +6.2% | 450% | 900% | 6 |
| Naha (Kenchomae Sta.) | 758,000 | 2,260,000 | +6.6% | 300% | 400% | 3 |
| Chiba (Chiba Sta.) | 750,000 | 2,890,000 | +9.2% | 400% | 800% | 8 |
| Kagoshima (Kagoshima-Chuo Sta.) | 605,500 | 936,000 | +1.6% | 450% | 600% | 6 |
| Kanazawa (Kanazawa Sta.) | 397,000 | 1,230,000 | +4.6% | 500% | 600% | 6 |
| Takamatsu (Takamatsu Sta.) | 203,000 | 268,000 | +2.0% | 400% | 400% | 3 |
By median, the highest is Osaka Station at ¥8,580,000/m² and the lowest is Takamatsu Station at ¥203,000/m², a gap of more than 40x. Year on year, Kyoto Station (+15.2%), Yokohama Kannai (+15.9%) and Sendai Station (+12.0%) posted double-digit gains, while Takamatsu (+2.0%) and Kagoshima (+1.6%) were steady — each city is clearly in a different phase of the land price upcycle. A decision to buy land is also a decision about how to price in this rate of appreciation.
Model Assumptions — A 100-Room Limited-Service Hotel, 3,500m² Floor Area, 1,500m² Site
We build a model to compare the two cases. All assumptions are disclosed in the table below. The unit building cost of ¥590,571/m² is derived from our own aggregation of hotel construction plan data (construction cost of ¥20.67M per room, 35.0m² gross floor area per room). Converted per tsubo, this is about ¥1.95M, nearly identical to the 2025 all-structure average (¥1.952M/tsubo) based on MLIT’s Building Construction Starts statistics. The ¥20.67M per room and 35.0m² per room figures come from 31 hotel construction plans in our database.
| Item | Assumption | Basis / notes |
|---|---|---|
| Rooms | 100 | Model scale for a limited-service hotel |
| Floor area per room (gross) | 35.0m² | MetroEngines Research & Consulting (measured from aggregated hotel construction plan data) |
| Gross floor area | 3,500m² | 100 rooms × 35.0m² |
| Site area | 1,500m² | Equivalent to a 333% FAR; within the median FAR of all 15 cities |
| Unit construction cost | ¥590,571/m² | ¥20.67M per room ÷ 35.0m². About ¥1.95M per tsubo, consistent with the 2025 all-structure average in MLIT’s Building Construction Starts statistics |
| Construction cost (total) | ¥2,067,000,000 | ¥20.67M per room |
| Land price | Median official price × 1,500m² | MLIT “Land Price Publication,” January 1, 2026 |
| Occupancy | 75.3% | Japan Tourism Agency Overnight Travel Statistics Survey, business-hotel room occupancy of 75.3% (full year January–December 2025, final figure, published July 6, 2026) |
| GOP margin | 50% | Lower end of the 50–60% industry benchmark for limited-service hotels. For reference, Invincible Investment Corporation discloses a GOP of 38.9% across 91 operator-managed properties (fiscal period ended December 2024, including full-service) |
| Revenue scope | Rooms only | Conservative setting excluding F&B, retail and other ancillary revenue |
| FF&E reserve | 3% of revenue | Funds for renewing room furnishings and interiors |
| Fixed asset tax & city planning tax | Building 0.7% / Land 1.2% | Building: approximation on acquisition cost. Land: taxable base of 70% of official price at a 1.7% tax rate |
| Target NOI yield | 5.0% | Base case; sensitivities at 4.0% and 6.0% shown later |
| Lease term | 30 years | Minimum under Art. 23(1) of the Act on Land and Building Leases (30 to under 50 years) |
| Ground-rent yield | 3.0% / 4.5% / 6.0% | Expected yield on land value. Presented as a range reflecting practice; no specific level is treated as standard |
| Security deposit | 12 months’ ground rent | Interest-free, refunded at expiry. Opportunity cost at the target yield is charged to the leasehold case |
| Demolition unit cost | ¥12,000–25,000/m² (mid ¥18,000/m²) | Practical range for demolishing reinforced-concrete buildings (¥40,000–80,000 per tsubo) converted to m². The upper end allows for premiums on tight urban sites and removal of ancillary equipment |
The structure of upfront investment and annual costs in the two cases is shown below, using Sapporo Station (Chuo Ward, Sapporo; median official price ¥1,180,000/m²) as the representative example.
| Item | A. Buy land + own building | B. Fixed-term business land lease + own building |
|---|---|---|
| Land acquisition | ¥1,770,000,000 | None |
| Construction | ¥2,067,000,000 | ¥2,067,000,000 |
| Security deposit (12 months’ rent) | — | ¥79,650,000 |
| Total upfront investment | ¥3,837,000,000 | ¥2,146,650,000 |
| Annual ground rent (4.5% yield) | — | ¥79,650,000 |
| Same, per occupied room-night | — | ¥2,898 |
| Depreciation (tax, 39-year straight line) | ¥53,000,000 | ¥53,000,000 |
| Depreciation (economic, 30-year lease term) | — | ¥68,900,000 |
| Fixed asset tax & city planning tax | ¥35,709,000 | ¥14,469,000 |
| Annual demolition reserve | — | ¥2,100,000 |
| Target NOI (upfront investment × 5.0%) | ¥191,850,000 | ¥107,332,500 |
Note the two depreciation rows. The statutory useful life for tax purposes is 39 years, but with a 30-year lease term the building still has an undepreciated balance of ¥477,000,000 at expiry. This is written off as a loss on disposal together with demolition, so the mismatch between the project term and the useful life, while invisible in cash flow, cannot be overlooked in the investment decision. Taking a longer lease term of 40 or 50 years largely resolves the issue.
Back-Solving Required ADR — Leasehold Helps Most Where Land Is Expensive; the Gap to Market Rates Varies Widely by City
With the assumptions set, we back-solve by city the ADR each case needs to meet the 5.0% target NOI yield. For comparison, we show the estimated contracted ADR of business hotels in each city’s central ward (average of the last 12 months, September 2025–August 2026).
| City (central ward) | Land price (¥M) | Required ADR A: Own | Required ADR B: Lease 4.5% | A−B | Market ADR | N | A/Market | B/Market |
|---|---|---|---|---|---|---|---|---|
| Osaka (Kita) | 12,870 | ¥70,892 | ¥56,359 | ¥14,533 | ¥10,667 | 54 | 6.65x | 5.28x |
| Nagoya (Nakamura) | 6,090 | ¥38,350 | ¥31,559 | ¥6,791 | ¥10,068 | 64 | 3.81x | 3.13x |
| Fukuoka (Hakata) | 5,108 | ¥33,635 | ¥27,965 | ¥5,670 | ¥14,096 | 132 | 2.39x | 1.98x |
| Kyoto (Shimogyo) | 3,255 | ¥24,743 | ¥21,189 | ¥3,554 | ¥14,768 | 115 | 1.68x | 1.43x |
| Saitama (Omiya) | 2,100 | ¥19,200 | ¥16,965 | ¥2,235 | ¥9,840 | 14 | 1.95x | 1.72x |
| Yokohama (Naka) | 2,025 | ¥18,840 | ¥16,690 | ¥2,150 | ¥11,158 | 40 | 1.69x | 1.50x |
| Sendai (Aoba) | 1,920 | ¥18,336 | ¥16,306 | ¥2,030 | ¥9,285 | 55 | 1.97x | 1.76x |
| Sapporo (Chuo) | 1,770 | ¥17,616 | ¥15,758 | ¥1,858 | ¥13,777 | 101 | 1.28x | 1.14x |
| Kobe (Chuo) | 1,680 | ¥17,184 | ¥15,428 | ¥1,756 | ¥11,522 | 38 | 1.49x | 1.34x |
| Hiroshima (Minami) | 1,194 | ¥14,851 | ¥13,651 | ¥1,200 | ¥8,854 | 18 | 1.68x | 1.54x |
| Naha (Naha City) | 1,137 | ¥14,578 | ¥13,442 | ¥1,136 | ¥9,448 | 105 | 1.54x | 1.42x |
| Chiba (Chuo) | 1,125 | ¥14,520 | ¥13,398 | ¥1,122 | ¥9,149 | 24 | 1.59x | 1.46x |
| Kagoshima (Kagoshima City) | 908 | ¥13,480 | ¥12,605 | ¥875 | ¥6,426 | 58 | 2.10x | 1.96x |
| Kanazawa (Kanazawa City) | 596 | ¥11,979 | ¥11,461 | ¥518 | ¥8,833 | 82 | 1.36x | 1.30x |
| Takamatsu (Takamatsu City) | 304 | ¥10,582 | ¥10,397 | ¥185 | ¥7,956 | 52 | 1.33x | 1.31x |
The difference (A−B) grows almost in proportion to the land price. It is ¥14,533 at Osaka Station, ¥6,791 at Nagoya Station and ¥5,670 at Hakata Station, versus only ¥518 at Kanazawa Station and ¥185 at Takamatsu Station. This reflects a simple relationship — the land-burden gap = land price × (target yield + land tax rate − ground-rent yield) — so the relative advantage of leasehold is structurally larger in cities with higher land prices.
On the other hand, the ratio of required ADR to market ADR differs widely by city. In Sapporo (A/Market 1.28x, B/Market 1.14x), Takamatsu (1.33x / 1.31x) and Kanazawa (1.36x / 1.30x), a new build is within reach if it can command a rate 20–30% above the existing stock average. By contrast, Osaka Station and Nagoya Station show multiples of 3x to 6x; at the median price of commercial land right by the station, a low-density standalone hotel of 100 rooms and 3,500m² cannot reach the assumed yield.
Two caveats apply to this reading. First, market ADR here is the median estimated contracted ADR of the entire existing stock, and newly opened properties generally launch at rates above the market average. The multiple should therefore be read as a question: how much new-build premium can be priced in? Second, the standard sites used are commercial land within 700m of the main station, whereas actual hotel sites are often found on the outer edge of this zone. In cities where the multiple exceeds 3x, the choice is between looking for a site one step back from the prime station-front location, switching to a design that uses the full floor-area ratio as discussed in the next section, or leasing the land rather than buying it.
End-of-Lease Costs and Sensitivity Analysis — Demolition Matters Little; Ground-Rent Yield Is What Counts
Next we factor in the cost specific to the leasehold case: returning the site as vacant land. For 3,500m² of floor area at a demolition unit cost of ¥12,000–25,000/m², total demolition cost is ¥42M–¥87.5M; spread over the 30-year lease term, the annual reserve is ¥1.4M–¥2.92M. Per occupied room-night, that is ¥51–¥106.
| Demolition unit cost | Total demolition (¥M) | Annual reserve (¥M) | Required ADR (rent 3.0%) | Required ADR (rent 4.5%) | Required ADR (rent 6.0%) |
|---|---|---|---|---|---|
| ¥12,000/m² | 42 | 1.4 | ¥13,545 | ¥15,703 | ¥17,861 |
| ¥18,000/m² | 63 | 2.1 | ¥13,599 | ¥15,757 | ¥17,915 |
| ¥25,000/m² | 88 | 2.9 | ¥13,662 | ¥15,820 | ¥17,978 |
Even doubling the demolition unit cost moves the required ADR by only about ¥120. It is a fixed cost spread over 30 years and divided by a large denominator of rooms × occupancy × 365. What decides the economics of the leasehold case is not demolition cost but the ground-rent yield.
| A: Own | B: Lease, rent 3.0% | B: Lease, rent 4.5% | B: Lease, rent 6.0% | |
|---|---|---|---|---|
| Target yield 4.0% | ¥14,645 | ¥11,958 | ¥14,095 | ¥16,233 |
| Target yield 5.0% | ¥17,616 | ¥13,599 | ¥15,757 | ¥17,915 |
| Target yield 6.0% | ¥20,586 | ¥15,240 | ¥17,419 | ¥19,598 |
The calculations so far hold occupancy fixed at a single national average. The table below shows, on two axes combined with the ground-rent yield, how required ADR moves when demand shifts. The base row matches the figures in the text.
| A: Own | B: Lease, rent 3.0% | B: Lease, rent 4.5% | B: Lease, rent 6.0% | |
|---|---|---|---|---|
| Occupancy (assumed) 70.0% — downside | ¥18,950 | ¥14,629 | ¥16,951 | ¥19,273 |
| Occupancy (assumed) 75.3% — base (2025 annual, final) | ¥17,616 | ¥13,599 | ¥15,757 | ¥17,915 |
| Occupancy (assumed) 80.0% — upside | ¥16,582 | ¥12,801 | ¥14,832 | ¥16,864 |
Lowering the assumed occupancy by 5.3pt, from 75.3% to 70.0%, raises the required ADR in the leasehold case (4.5% rent) from ¥15,757 to ¥16,951, an increase of ¥1,194. That is about 55% of the impact of moving the ground-rent yield by 1.5pt (¥2,158). Because a demand-side downside carries weight comparable to 1.5pt of ground-rent negotiation, the rent level and the assumed occupancy must be tested together. The model does not reflect occupancy differences between cities, so for an actual project the figures should be adjusted to the demand level of the target city.
The 100% line in the chart marks the break-even. At Osaka Station, with a 3.0% ground-rent yield the leasehold required ADR falls to 57.4% of the ownership case, reaching parity around 5.9%. At Takamatsu Station the gap is small even at 3.0% (94.7%), and the order reverses around 5.3%. The break-evens for all 15 cities fall between 5.25% and 5.89%, so regardless of land price the practical decision line is whether the ground-rent yield exceeds the mid-5% range. Ground rent is negotiable, and whether a developer can approach the landowner with this benchmark in mind determines whether a leasehold scheme succeeds. Our analysis Leasehold Hotel Development: 1.38x Land Price Reach Across 9 Markets, which puts ground rent itself at the center and back-solves the maximum rent a project can bear in each market, is also useful for narrowing the negotiating range.
Zoning and Floor-Area Ratio — The Same Site Can Hold Anywhere from 90 to 300 Rooms
Finally, we add site utilization as a variable. All the standard sites in the 15 cities are zoned as commercial districts, but the median designated floor-area ratio ranges from 300% at Kyoto Station and Naha to 700% at Nagoya Station. Some sites reach 1,300% at Nagoya Station, 800% at Osaka Station and 900% at Hiroshima Station. Even on the same 1,500m² site, the buildable floor area and room count when the median FAR is fully used change as follows.
| City | FAR (median) | Permitted floor area (m²) | Rooms | Required ADR A: Own | Required ADR B: Lease 4.5% | Reduction in B (vs 100-room model) |
|---|---|---|---|---|---|---|
| Osaka | 600% | 9,000 | 257 | ¥33,161 | ¥27,606 | ¥28,753 |
| Nagoya | 700% | 10,500 | 300 | ¥18,864 | ¥16,709 | ¥14,850 |
| Fukuoka | 500% | 7,500 | 214 | ¥20,588 | ¥18,026 | ¥9,939 |
| Kyoto | 300% | 4,500 | 128 | ¥21,367 | ¥18,626 | ¥2,563 |
| Saitama | 400% | 6,000 | 171 | ¥15,038 | ¥13,799 | ¥3,166 |
| Yokohama | 600% | 9,000 | 257 | ¥12,908 | ¥12,171 | ¥4,519 |
| Sendai | 500% | 7,500 | 214 | ¥13,439 | ¥12,577 | ¥3,729 |
| Sapporo | 600% | 9,000 | 257 | ¥12,431 | ¥11,808 | ¥3,950 |
| Kobe | 600% | 9,000 | 257 | ¥12,263 | ¥11,680 | ¥3,748 |
| Hiroshima | 450% | 6,750 | 192 | ¥12,146 | ¥11,599 | ¥2,052 |
| Naha | 300% | 4,500 | 128 | ¥13,425 | ¥12,574 | ¥868 |
| Chiba | 400% | 6,000 | 171 | ¥12,301 | ¥11,713 | ¥1,685 |
| Kagoshima | 450% | 6,750 | 192 | ¥11,432 | ¥11,055 | ¥1,550 |
| Kanazawa | 500% | 7,500 | 214 | ¥10,469 | ¥10,314 | ¥1,147 |
| Takamatsu | 400% | 6,000 | 171 | ¥9,998 | ¥9,958 | ¥439 |
At Nagoya Station with a 700% FAR, 300 rooms fit in theory; at 600% (Osaka Station, Sapporo Station, Kobe Sannomiya and Kannai), 257 rooms. Because land cost is divided by the number of rooms, higher density lowers the land burden per room. In the Osaka Station leasehold case, the required ADR of ¥56,359 for the 100-room model falls to ¥27,606 in the 257-room model that uses the full FAR. In other words, the main way to make the numbers work at expensive station-front sites is not the leasehold scheme alone but the combination of leasehold and high-density design.
Conversely, at Kyoto Station and Naha, where the FAR is 300%, the ceiling is 128 rooms, leaving little room to adjust through density. Kyoto Station shows the highest land price growth of the 15 cities at +15.2% year on year, yet with its FAR held down, there is limited scope to dilute land acquisition cost across more rooms. In such areas, the case for leasing rather than owning the land carries relatively more weight.
Note that the FARs used here are the values designated for the standard sites; actual plans are also subject to limits based on front-road width, shadow regulations, and bonuses under the comprehensive design system or high-level use districts. Site-specific verification is essential at the master planning stage.
Summary — “Buy or Lease” Can Be Decided at a Ground-Rent Yield in the Mid-5% Range
1. Leasehold’s advantage scales with land price
With a 5.0% target NOI yield and a 4.5% ground-rent yield, the fixed-term business land lease lowered the required ADR in all 15 cities. The reduction — ¥14,533 at Osaka Station, ¥185 at Takamatsu Station — grows in proportion to the land price.
2. The decision line is 5.25–5.89%
The ground-rent yield at which ownership and leasehold switch places fell between 5.25% and 5.89% across the 15 cities. Most of the 3–6% range cited in practice sits below this break-even, so whether rent negotiations can hold to this level is the deciding factor.
3. Density matters more than end-of-lease cost
Doubling demolition from ¥12,000/m² to ¥25,000/m² moves the required ADR by only about ¥120. Whether the full FAR can be used, by contrast, changes the required ADR by 30–40%. Leasehold and high-density design should be considered together.
A fixed-term business land lease removes land acquisition from the upfront investment in exchange for annual ground rent and the obligation to return the land vacant at expiry. What our calculations show is that whether this trade-off pays off depends not on the land price level itself but on how far the ground-rent yield falls below the sum of the target yield and the cost of holding land. And the more expensive the station-front land, the larger the monetary benefit from the same yield gap.
That said, as the ratio of required to market ADR shows, only a limited number of cities can support a standalone business hotel at the median price of commercial land right by the station. In markets such as Sapporo, Kanazawa and Takamatsu, where the multiple is 1.1–1.4x, a new-build premium is enough to close the gap; at the station fronts of Osaka, Nagoya and Hakata, one of several design decisions is a prerequisite — moving one step off the prime location, reworking the plan as a high-density scheme that uses the full FAR, or positioning lodging within a mixed-use development. “Buy or lease” is a question that should be considered together with those design decisions.
Related Articles
References and Sources
■ Data Sources
Estimated contracted ADR is the monthly median for business hotels in the central ward of each of the 15 cities, averaged over September 2025–August 2026 (N=14–132 properties per month). Land prices and designated FARs are from MLIT’s “Land Price Publication” (as of January 1, 2026; standard sites with the “commercial” classification within roughly 700m of each main station; n=3–17 sites). Occupancy is the business-hotel room occupancy of 75.3% from the Japan Tourism Agency’s Overnight Travel Statistics Survey (full year January–December 2025, final figure, published July 6, 2026). The unit construction cost comes from our aggregation of hotel construction plan data (¥20.67M per room, 35.0m² floor area per room) and is checked against the 2025 all-structure average of ¥1.952M/tsubo in MLIT’s Building Construction Starts statistics.
■ Calculation Assumptions
The common model is a 100-room limited-service hotel with 3,500m² floor area on a 1,500m² site. Revenue is rooms only (a conservative setting excluding F&B, retail and other ancillary revenue), GOP margin 50%, FF&E reserve 3% of revenue. Fixed asset and city planning taxes are 0.7% for the building and 1.2% for land (taxable base of 70% of the official price at a 1.7% rate). The leasehold case assumes a 30-year term, a security deposit of 12 months’ rent (interest-free, refunded at expiry, with opportunity cost at the target yield charged), and a demolition unit cost of ¥12,000–25,000/m² (mid ¥18,000/m²) spread over 30 years. Required ADR is back-solved as the level that meets the target NOI yield (base case 5.0%).
■ Limitations
(1) A single national average occupancy is applied to all 15 cities; differences in demand by city are not reflected (the effect of variation is shown in the two-axis sensitivity in Table 8). (2) Market ADR is the estimated contracted rate of existing stock and differs from launch rates of newly opened properties. (3) FARs are the designated values of standard sites and do not reflect limits from front-road width, shadow regulations, or adjustments under the comprehensive design system, etc. (4) Ground-rent yield, GOP margin and demolition unit cost are all presented as practical ranges; no specific level is treated as standard. (5) Future changes in construction costs, borrowing terms and interest rates, tax reforms, and land price movements during development are not included. Site-specific verification is required at the master planning stage.
■ Market Data
- MetroEngines Research & Consulting — estimated contracted ADR (business hotels in the central wards of the 15 target cities, September 2025–August 2026); aggregated hotel construction plan data (construction cost per room, floor area per room)
■ Laws and Regulations
- Act on Land and Building Leases (Act No. 90 of 1991), Articles 22, 23 and 24 (e-Gov Laws and Regulations Search, Japanese)
- All Japan Real Estate Association, “Legal Amendments Concerning Business Land Leases” (Japanese)
■ Government Statistics and Public Data
- MLIT Real Estate Information Library — official land price and prefectural land price survey points (as of January 1, 2026), zoning and designated FAR
- Japan Tourism Agency, “Overnight Travel Statistics Survey (April 2026 second preliminary, May 2026 first preliminary, and 2025 annual final figures),” published July 6, 2026
- MLIT, “Building Construction Starts Statistics”
- MLIT, “Examples of Fixed-Term Land Leases”
■ Municipal Documents and Tender Guidelines
- Iiyama City, “Basic Agreement Concluded for the Iiyama Station Front City-Owned Land Lodging Facility Development Promotion Project” (Japanese)
- Iiyama City, “Iiyama Station Front City-Owned Land Lodging Facility Development Promotion Project: Proposal Tender Guidelines” (April 2021, Japanese)
■ Reference Benchmarks