

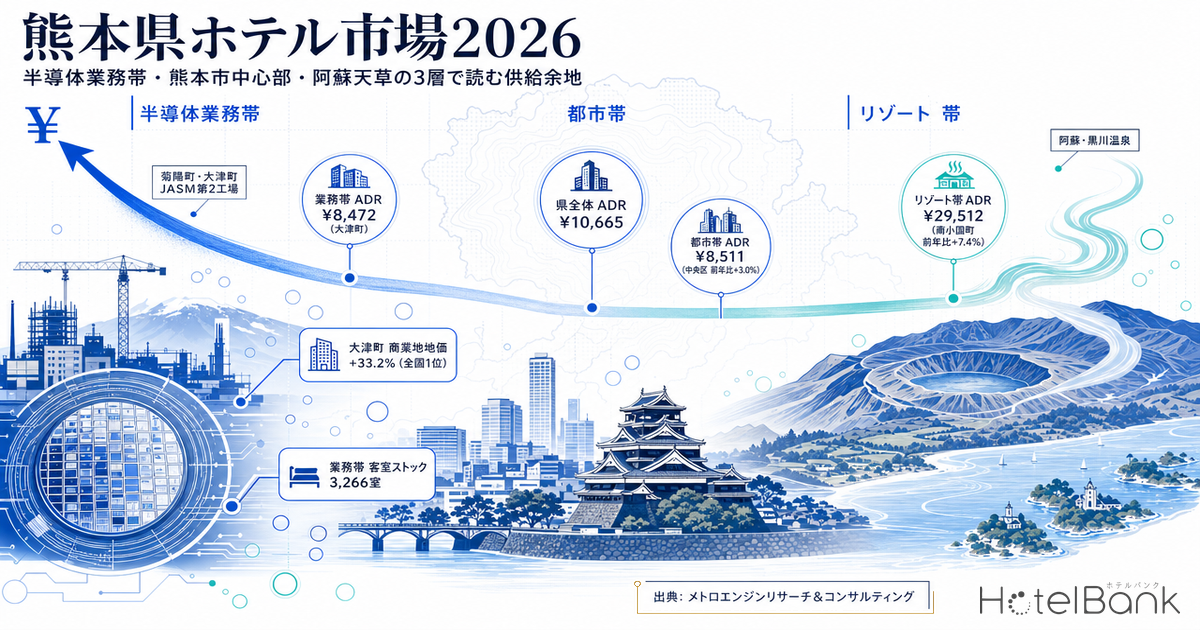
Kumamoto Prefecture’s hotel market loses its true shape the moment you describe it with a single prefecture-wide average. There is the business belt of Kikuyo and Ozu, where semiconductor investment is concentrated; the urban belt of central Kumamoto City, where inbound overnight stays hit a record high; and the resort belt of Aso, Kurokawa and Amakusa, which sustains rates among the highest in Japan. These three layers differ completely in price level, supply structure and the seasonality of occupancy. This article combines MetroEngines Research estimated settled ADR, the opening pipeline, government statistics and primary sources to quantify where each of the three layers stands today and how much room for new supply remains.
Metric Definitions Used in This Article
- ADR (average daily rate) = an estimated settled rate (tax-exclusive equivalent) calculated by applying property-type correction coefficients to the lowest published plan rate each property lists on OTAs (double occupancy, per room, tax-inclusive). Cross-checked against property-level disclosures by listed hotel REITs (91 properties, most recent 3 months), the median error is approximately 7%. It is an estimate and differs from each property’s actual contracted rates and accounting figures. Area-level ADR is the median of the properties covered (the level of a typical property in that area).
- Listed price (all-plan average) = the average price of all plans published on OTAs (double occupancy, per room, tax-inclusive). Because it spans room-only through meal-inclusive plans, it sits higher than the ADR above. This article keeps the two clearly distinguished.
- OCC (occupancy) = the share of sold rooms against total rooms in the area (an estimate based on OTA sales inventory; consistency checks against REIT monthly disclosures confirm accuracy of roughly a few percentage points). Used only as a macro indicator at the prefecture and category level.
- Data source: MetroEngines Research & Consulting
- — ¥8,472 vs ¥8,511 — estimated settled ADR in Ozu, in the semiconductor business belt, is on par with Chuo Ward at the heart of the prefectural capital. A gap of 11 properties against 58 is being closed on rate alone (average for July 2025–June 2026).
- — 4.0x stock gap — Kumamoto City holds 230 properties and 13,091 rooms, while the four municipalities of the business belt hold 79 properties and 3,266 rooms. Rates converge, but capacity remains at roughly one quarter.
- — ¥29,512, +7.4% YoY — estimated settled ADR in Minamioguni, in the resort belt, ranks among the highest nationwide. Yet only 77 properties have 20 rooms or more, leaving 30–60 rooms at a high rate as an open white space.
- — OCC 88.6% / 83.7% — as of April 2026, city hotels ran at 88.6% (N=18 properties) and business hotels at 83.7% (N=103 properties), holding high occupancy while absorbing the 2025–2026 supply additions.
- — December 2027 / spring 2029 or later — two milestones, the start of JASM Fab 2 operations and the opening of the new station near Haramizu, set the investment timing for the business belt.
Executive Summary — A Three-Layer Structure with a 3.5x Rate Gap and a 4x Supply Gap
Start with the whole picture. Kumamoto Prefecture’s estimated settled ADR is ¥10,700 on a trailing 12-month average (-0.4% YoY, N=approx. 390 properties) — essentially flat at the prefectural level. Inside that average, however, sit Minamioguni at ¥29,500 and Koshi at ¥6,100, a rate gap of roughly 4.8x. Room stock is skewed in the same way: within the scope MetroEngines Research covers, Kumamoto City (five wards) holds 230 properties and 13,091 rooms, while the four municipalities where semiconductor investment is concentrated — Ozu, Kikuyo, Koshi and Kikuchi — hold just 79 properties and 3,266 rooms.
That asymmetry is the starting point for reading the Kumamoto market. What follows examines the rate, supply and demand drivers of each of the three layers in turn.
Outlines of the Three Layers — Estimated Settled ADR and Listed Price by Municipality
Line up estimated settled ADR by municipality (trailing 12-month average) and the hierarchy of the three layers comes into sharp relief. What stands out is that Ozu in the business belt (approx. ¥8,500) has reached almost the same level as Chuo Ward (approx. ¥8,500), the core of the urban belt. A smaller area by both population and property count is matching the rate of the prefectural capital’s central district — evidence that semiconductor-related business travel and construction demand is underpinning price.
| Layer | Municipality | Estimated settled ADR | YoY | Listed price (all-plan avg) | Properties in ADR calc | Listed properties |
|---|---|---|---|---|---|---|
| Semiconductor business belt | Ozu | ¥8,472 | -3.8% | ¥16,242 | 11 | 14 |
| Semiconductor business belt | Kikuyo | ¥7,326 | -5.3% | ¥14,762 | 4 | 2 |
| Semiconductor business belt | Kikuchi | ¥7,905 | +3.6% | ¥24,978 | 13 | 20 |
| Semiconductor business belt | Koshi | ¥6,079 | +4.1% | ¥11,007 | 1 | 1 |
| Urban belt | Chuo Ward | ¥8,511 | +3.0% | ¥16,486 | 58 | 78 |
| Urban belt | Nishi Ward | ¥8,181 | -1.0% | ¥18,695 | 9 | 20 |
| Urban belt | Higashi Ward | ¥5,794 | +21.6% | ¥12,633 | 3 | 3 |
| Urban belt | Kita Ward | ¥13,460 | -3.7% | ¥39,842 | 10 | 10 |
| Urban belt | Minami Ward | ¥7,019 | +3.6% | ¥12,813 | 2 | 3 |
| Resort belt | Minamioguni | ¥29,512 | +7.4% | ¥54,344 | 44 | 58 |
| Resort belt | Ubuyama | ¥31,319 | +7.0% | ¥47,051 | 1 | 1 |
| Resort belt | Minamiaso | ¥25,572 | +2.8% | ¥27,954 | 15 | 61 |
| Resort belt | Aso City | ¥18,642 | +11.4% | ¥33,577 | 25 | 54 |
| Resort belt | Oguni | ¥17,794 | -5.4% | ¥36,081 | 20 | 25 |
| Resort belt | Takamori | ¥14,720 | -0.9% | ¥24,198 | 2 | 10 |
| Resort belt | Kamiamakusa | ¥13,576 | +2.8% | ¥29,475 | 20 | 47 |
| Resort belt | Amakusa City | ¥8,141 | +3.3% | ¥19,352 | 28 | 51 |
The strongest year-on-year gain was Aso City at +11.4% (N=25 properties), followed by Minamioguni at +7.4% (N=44 properties). Both sit in the resort belt, and the rate growth across the Aso and Kurokawa areas stands out within the prefecture as a whole. In the business belt, Ozu (-3.8%) and Kikuyo (-5.3%) are in a mild correction, but the natural reading is that this reflects a run of large hotel openings around the airport through 2025 and 2026, which suddenly widened the choice set. That the correction was held to a few percent while supply expanded is itself a sign of demand depth. How the rates in these three municipalities have tracked the JASM Fab 2 construction schedule is followed month by month across 32 months in TSMC Fab 2 and Kumamoto’s Chip Corridor: Kikuyo–Koshi–Ozu ADR 2024–2026.
Seasonal Pattern in Prefecture-Wide ADR — Normalization from the 2024 Peak and a Renewed Climb in Late 2026
Overlay prefecture-wide estimated settled ADR year by year and three distinct phases of the Kumamoto market become visible. The first half of 2024 ran in the ¥12,000 range — the peak of the past three years, coinciding with the opening of JASM Fab 1 (February 2024) and the peak of related construction work. Rates then settled into the low ¥10,000 range through 2025 and held at that level through the first half of 2026.
The shape of late 2026 is what draws the eye. Figures from July onward are estimates based on published rates at the survey date, but September shows ¥13,300 — the highest level in three years. Whether that lands as actual bookings depends on how sales develop from here; at minimum, it shows the supply side has shifted to aggressive pricing.
Geography of the Three Layers — Airport, Fab, Castle Town, Caldera
The three layers are also cleanly separated in space. The business belt, anchored by Kumamoto Airport and JASM, sits on the plateau in the centre of the prefecture; the urban belt occupies the castle town on the lower Shirakawa river; and the resort belt clusters in the Aso caldera and the Amakusa islands. Roughly 16 km separates the airport from central Kumamoto City, and roughly 50 km separates it from Kurokawa Onsen — distances that let the three layers capture entirely different pools of demand.
Comparing circle sizes (room counts) on the map, the density of large properties in the urban belt is conspicuous. Restricting to properties with 20 rooms or more, the urban belt has 118 properties and 12,413 rooms, against 31 properties and 2,886 rooms in the business belt and 77 properties and 4,460 rooms in the resort belt. The resort belt has many properties but each is small: more than 80% of its stock consists of small inns with fewer than 20 rooms.
Business Belt — TSMC Fab 2 and the 70-Hectare Haramizu Project Are Changing the Nature of Demand
Demand drivers in the business belt are unambiguous. In Kikuyo, Japan Advanced Semiconductor Manufacturing (JASM) — funded by TSMC, Sony Semiconductor Solutions, Denso and Toyota Motor — is building its second fab. Located east of Fab 1, the investment totals approximately US$13.9 billion (about ¥2.1 trillion). Main construction began in June 2025, and a siting agreement with the town of Kikuyo was signed on 24 October 2025. The fab will chiefly produce semiconductors at a 6-nanometre process node, targeting the start of operations in December 2027. Headcount is planned at approximately 1,700, bringing the combined total with Fab 1 to roughly 3,400. The Ministry of Economy, Trade and Industry has announced subsidies of up to ¥732 billion for the second fab.
The other large project is a land readjustment scheme covering approximately 70 hectares around Haramizu Station on the JR Hohi Line. Kikuyo plans a new station between Sanrigi and Haramizu, developing the surrounding area in three zones: a “bustle zone” (retail, hotels, condominiums), a “live-work proximity zone” (housing) and a “knowledge cluster zone” (satellite campuses and similar). On 28 November 2024, an agreement was signed naming Mitsubishi Corporation and Mitsui Fudosan as partners. Note, however, that on 3 December 2024 JR Kyushu announced it was pushing the new station’s opening back from the original target of around spring 2027 to spring 2029 or later. Any full-scale emergence of hotel sites will therefore move in step with the progress of the land readjustment scheme.
| Ozu (commercial land) | +33.2% (1st nationally) |
| Kikuyo (commercial land) | +30.8% (2nd nationally) |
| Kumamoto Prefecture (residential avg) | +2.8% / ¥62,800/m² |
| Properties | 79 |
| Rooms | 3,266 |
| Of which 50+ rooms | 21 properties / 2,610 rooms |
| Kumamoto City (reference) | 230 properties / 13,091 rooms |
Land prices mirror the market’s assessment of this corridor directly. In MLIT’s 2026 official land price survey, commercial land in Ozu rose +33.2% year on year, the highest of any municipality in Japan, with Kikuyo second at +30.8%. Land acquisition costs are rising fast, so hotel development feasibility work needs its land-cost assumptions refreshed every year. Conversely, operators that have already secured sites are accumulating unrealized gains.
The nature of demand is shifting too. In the construction phase, medium-to-long stays by contractors dominate; once the fab is operating, the mainstay becomes traffic from overseas engineers and visits from suppliers. Both differ from one-night business demand in length of stay and in amenity requirements. Fittingly, Tabino Hotel Aso Kumamoto Airport (213 rooms, Ozu), which opened in April 2026, equips every room with a washing machine, microwave and two-door refrigerator, and some rooms with a kitchen. It was also approved by Kumamoto Prefecture as a “regional economy-driving project.” Workers Hotel Kumamoto Ozu (202 rooms), which opened in February 2026, is likewise designed to take consecutive-night bookings from one to sixty nights through its official site. Product design specialized for medium-to-long stays is becoming the new standard in the business belt.
Supply Pipeline — 826 Rooms to the Business Belt and 668 to the Urban Belt in 2025–2026
Aggregate new openings over the past three years by layer and the centre of gravity of supply has clearly shifted to the business belt and the airport corridor. Restricting to projects of 50 rooms or more, 2024 was urban-belt-centred (294 rooms), whereas 411 rooms went into the business belt in 2025 and 415 rooms in 2026. Across the two years 2025–2026, 826 rooms were added to the business belt — roughly a 25% increase against its existing stock of 3,266 rooms.
| Opening | Layer | Property | Rooms |
|---|---|---|---|
| April 2024 | Urban belt | Grids Premium Hotel Kumamoto | 197 |
| July 2024 | Urban belt | Comfort Inn Kumamoto Miyuki Fueda | 97 |
| June 2025 | Business belt | Toyoko Inn Kumamoto Airport | 208 |
| June 2025 | Business belt | Super Hotel Premier Aso Kumamoto Airport | 203 |
| August 2025 | Urban belt | Natural Hot Spring Higo-no-Yu Onyado Nono Kumamoto | 191 |
| October 2025 | Urban belt | HOTEL TAU, KUMAMOTO | 69 |
| February 2026 | Business belt | Workers Hotel Kumamoto Ozu | 202 |
| April 2026 | Business belt | Tabino Hotel Aso Kumamoto Airport | 213 |
| May 2026 | Other | HOTEL R9 The Yard Yamaga | 53 |
| July 2026 | Resort belt | TAOYA Aso | 59 |
| July 2026 | Urban belt | Via Inn Prime Kumamoto Hibari-no-Yu | 232 |
| October 2026 | Urban belt | Hotel Amanek Kumamoto | 176 |
| October 2026 | Resort belt | La Vista Minamiaso | 90 |
So does this supply satisfy demand for rooms in the business belt? JASM Fab 2 alone plans roughly 1,700 staff, and roughly 3,400 combined with Fab 1 — but most of them will become residents rather than direct accommodation demand. The mainstay of lodging demand is business travellers handling construction, installation and maintenance, plus traffic from suppliers and overseas sites. The 826 rooms added in 2025–2026 are a commensurate response to the construction peak before operations begin, but once the December 2027 start-up brings supply-chain traffic in earnest, it is reasonable to expect that room remains.
Note that in planning data based on MLIT’s Building Construction Statistics Survey, the accommodation projects captured in Kumamoto Prefecture centre on a mixed-use scheme in Sakuramachi, Chuo Ward, Kumamoto City (37,500 m² gross floor area, 14 storeys). Because building confirmation applications are typically filed one to two years before opening, this figure should be read as the lower bound of the confirmed pipeline at present, with project and room counts expected to rise as further applications are filed. The count itself cannot be treated as a population.
Urban Belt — 1.15 Million Inbound Guests Lifting Central Kumamoto City
Kumamoto City’s tourism statistics are bright. Foreign overnight stays in 2025 reached 1,154,000, topping one million for the first time, while foreign visitor numbers rose roughly 30% year on year to 1,808,000. Total visitors reached 6,547,000 (+3.8% YoY), total overnight stays 4,180,000 (+3.9%) and tourism spending ¥128.0 billion (+11.0%) — all record highs. By country and region, Taiwan led with 324,000 (28.1% share), followed by mainland China at 218,000, South Korea at 185,000 and Hong Kong at 94,000. New and expanded scheduled international routes into Kumamoto Airport are credited as a contributor.
Against that demand backdrop, estimated settled ADR in Chuo Ward, Kumamoto City ran at approximately ¥8,500 (N=58 properties), up 3.0% year on year. On a listed-price (all-plan average) basis it was approximately ¥16,500. Nishi Ward came in at approximately ¥8,200 (N=9 properties) and Kita Ward at approximately ¥13,500 (N=10 properties) — levels vary by ward, but the picture is one of Chuo Ward, the centre of supply, steadily building rate.
By category, estimated settled ADR for business hotels is approximately ¥6,900 (N=116 properties, +1.7% YoY) and for city hotels approximately ¥9,900 (N=19 properties, +2.1%). Occupancy (estimated, based on OTA listed inventory) as of April 2026 was highest for city hotels at 88.6% (N=18 properties, 1,999 rooms), followed by business hotels at 83.7% (N=103 properties, 12,105 rooms). These are estimates based on how listed OTA inventory is absorbed and differ from each property’s actual overall occupancy. For reference, the Japan Tourism Agency’s Overnight Travel Statistics Survey puts Kumamoto Prefecture’s room occupancy at 67.3% for 2025.
On the supply side of the urban belt, Via Inn Prime Kumamoto Hibari-no-Yu (232 rooms) arrives in July 2026 and Hotel Amanek Kumamoto (176 rooms) in October. Together with the 191-room hot-spring property that opened in August 2025, central Kumamoto City and the area in front of Kumamoto Station are receiving a run of mid-to-large limited-service properties with large communal baths. In a market where the inbound share has climbed to nearly 28%, concentrating supply on products differentiated by large baths and hot springs is a rational move.
Kumamoto City has also levied an accommodation tax since 1 July 2026, and how that flows through into pricing is a factor worth watching alongside the supply additions above.
Resort Belt — Rates Among the Highest Nationally, Scale Still Small
The highest rates among the three layers belong to the resort belt. Minamioguni, home to Kurokawa Onsen, posts estimated settled ADR of approximately ¥29,500 (N=44 properties, +7.4% YoY), followed by Minamiaso at approximately ¥25,600 (N=15 properties) and Aso City at approximately ¥18,600 (N=25 properties, +11.4%). On a listed-price (all-plan average) basis, Minamioguni reaches approximately ¥54,300 — 3.3 times Chuo Ward in the urban belt (approximately ¥16,500).
By category, ryokan post the highest estimated settled ADR in the prefecture at approximately ¥17,300 (N=229 properties). The -1.2% year-on-year reading is a slight correction, largely a payback from high levels in 2024. How the Aso area recovered to this rate level in the first place is traced chronologically in Kumamoto Quake 10Y x Aso: Data on Recovery and Tourism Brand Rebound. Resort hotels, by contrast, are at approximately ¥13,700 (N=20 properties) and growing +5.6% year on year — the phase differs by property type.
On supply, TAOYA Aso (59 rooms) arrives in July 2026 and La Vista Minamiaso (90 rooms) in October. Two new resort projects of 50 rooms or more landing in the Aso area in the same year is unusual in recent times. In addition, a long-established ryokan in Tamana Onsen reopened in April 2026 after rebranding as Onyado Satsuki (18 rooms), so value regeneration of existing stock is progressing in parallel. As Hoshino Resorts operates an onsen ryokan brand in the Aso area, out-of-prefecture capital in the high-rate segment forms part of the market as well.
What deserves attention here is the size distribution. Of the resort belt’s 634 properties, only 77 have 20 rooms or more, accounting for 4,460 of its 8,036 rooms. Rates rank among the highest nationwide, yet because each property is small, the area’s overall capacity is limited. With Kurokawa Onsen and Aso holding steady at ¥25,000–¥30,000 and maintaining year-on-year growth, the situation points to clear headroom in the white space of mid-scale (30–60 rooms) at a high rate.
Investment Headroom in Each Layer — Where the White Space Is
Business belt | Product design for medium-to-long stays
ADR ¥6,100–8,500 · 79 properties, 3,266 rooms
Traffic for construction, installation and maintenance continues in the run-up to Fab 2 operations in December 2027. New supply specialized for medium-to-long stays has already begun, and product requirements — kitchens, washing machines, consecutive-night rate structures — are taking hold. With land costs in an upswing, conversion or rebranding of existing properties is also a strong option.
Urban belt | Upper-grade inbound
ADR ¥5,800–13,500 · 230 properties, 13,091 rooms
Against a demand structure of 1.15 million foreign guests and a 28% share, supply is skewed toward limited-service. Mid-scale properties with large baths and hot springs keep arriving, but the grades above them (rooms of 30 m² or more, stay-oriented formats) still leave room. Including pricing design after the accommodation tax, there is margin to build rate.
Resort belt | Mid-scale at a high rate
ADR ¥8,100–31,300 · 634 properties, 8,036 rooms
Rates in Kurokawa and Aso rank among the highest nationally and are still growing year on year. Yet only 77 properties have 20 rooms or more, and the 30–60 room high-rate segment is thin. Landscape regulations and onsen water rights make entry hard — and that scarcity is precisely what makes the position valuable for incumbents.
Room Revenue per Key in the Business Belt — Three Scenarios
A mechanical calculation using only the figures presented in this article. The base case is Ozu’s estimated settled ADR of ¥8,472 (monthly average, July 2025–June 2026) and business hotel occupancy of 83.7% (as of April 2026, N=103 properties). The ADR range applies the actual year-on-year range by municipality shown above (Kikuyo -5.3% to Kikuchi +3.6%); the occupancy range applies ±5 points. Only the identity RevPAR = ADR × occupancy is used; no further assumptions such as GOP margin or investment yield are introduced.
| Scenario | Assumption | Estimated settled ADR | Occupancy | RevPAR | Annual / room |
|---|---|---|---|---|---|
| Downside | ADR -5.3% (Kikuyo YoY, above) | ¥8,023 | 78.7% | ¥6,314 | ¥2,305k |
| Base | ADR flat (Ozu trailing 12-month average, above) | ¥8,472 | 83.7% | ¥7,091 | ¥2,588k |
| Upside | ADR +3.6% (Kikuchi YoY, above) | ¥8,777 | 88.7% | ¥7,785 | ¥2,842k |
Two-Axis Sensitivity, ADR × Occupancy — RevPAR (¥ per room per day)
Occupancy runs down the vertical axis (±10 points against the 83.7% base) and estimated settled ADR across the horizontal axis (±10% against the ¥8,472 base), with RevPAR at each intersection. This too is a mechanical conversion using the identity RevPAR = ADR × occupancy and contains no new empirical claim. With land costs rising in the business belt, the grid shows that adding 5% to ADR and lifting occupancy by 5 points have almost equivalent effects on RevPAR.
| Occupancy \ Estimated settled ADR | -10% ¥7,625 | -5% ¥8,048 | Base ¥8,472 | +5% ¥8,896 | +10% ¥9,319 |
|---|---|---|---|---|---|
| 93.7% | ¥7,144 | ¥7,541 | ¥7,938 | ¥8,335 | ¥8,732 |
| 88.7% | ¥6,763 | ¥7,139 | ¥7,515 | ¥7,890 | ¥8,266 |
| 83.7% (base) | ¥6,382 | ¥6,737 | ¥7,091 | ¥7,446 | ¥7,800 |
| 78.7% | ¥6,001 | ¥6,334 | ¥6,667 | ¥7,001 | ¥7,334 |
| 73.7% | ¥5,619 | ¥5,932 | ¥6,244 | ¥6,556 | ¥6,868 |
What the three layers share is that none of them is a market struggling with falling rates. Prefecture-wide ADR is flat, the resort belt is rising, and the business belt has held its correction to a few percent while absorbing new supply. The real question lies on the capacity side — and that reads as an investment opportunity.
Conclusion — Look Inside the Average
Describe Kumamoto Prefecture’s hotel market through the single point of a ¥10,700 prefectural ADR and almost none of what is actually happening becomes visible. A business belt where semiconductor investment has pushed land prices to the first- and second-highest growth rates in Japan; an urban belt where inbound overnight stays passed one million for the first time; and a resort belt running at rates among the nation’s highest while a gap in scale remains. The three have independent demand drivers and reach their investment decision points at different moments.
The business belt in particular faces two milestones: JASM Fab 2 operations in December 2027, and the new station opening in spring 2029 or later. Hotel use is explicitly designated within the land readjustment scheme’s “bustle zone,” so how operators structure the intervening years becomes the practical question. That existing stock is thin at 3,266 rooms means, conversely, that there is considerable room for first movers.
In following the Kumamoto market, we would recommend looking at the rate, occupancy and supply of each of these three layers separately, rather than at the prefectural average.
⚠ Note on ADR for future dates: estimated settled ADR from July 2026 onward in the charts in this article is an estimate based on sales prices published on OTAs as of the survey date, and will move as the check-in date approaches. Please note that rates set high at present may fall through last-minute price adjustments.
Related Reading
- How TSMC’s Arrival Moved Kumamoto Hotel ADR — Expectations vs. Data
- Kumamoto Quake 10Y x Aso: Data on Recovery and Tourism Brand Rebound
- TSMC Fab 2 and Kumamoto’s Chip Corridor: Kikuyo–Koshi–Ozu ADR 2024–2026
References and Sources
■ Data sources
MetroEngines Research & Consulting estimated settled ADR and listed prices (Kumamoto Prefecture, N=366–399 properties per month, July 2024–December 2026), occupancy (estimated on an OTA listed-inventory basis, as of April 2026) and new opening data (based on confirmed OTA listings). These are combined with MLIT’s “2026 Official Land Price Survey,” the Japan Tourism Agency’s “Overnight Travel Statistics Survey,” Kumamoto City’s “Kumamoto City Tourism Statistics,” Kumamoto Prefecture tourism statistics, and official announcements and news reports from the operators concerned.
■ Calculation assumptions
Estimated settled ADR by municipality is the simple average of monthly values for July 2025–June 2026; year-on-year figures compare that period with the prior-year period (July 2024–June 2025). The three layers are defined as: semiconductor business belt = Ozu, Kikuyo, Koshi and Kikuchi; urban belt = the five wards of Kumamoto City; resort belt = Aso, Minamioguni, Oguni, Minamiaso, Takamori, Ubuyama, Amakusa and Kamiamakusa. The three scenarios for room revenue per key and the two-axis sensitivity grid apply the base values and actual ranges stated in this article to the identity RevPAR = ADR × occupancy; they are mechanical calculations and introduce no further assumptions such as GOP margin, operating cost ratio or investment yield.
■ Limitations and caveats
Estimated settled ADR applies property-type correction coefficients to OTA listed prices and differs from each property’s actual contracted rates and accounting figures (cross-checks against listed hotel REIT disclosures show a median error of approximately 7%). Occupancy is likewise an estimate based on OTA sales inventory, used only as a macro indicator at the area and category level. Koshi and Ubuyama are reference values only, as N=1 property. ADR from July 2026 onward is a forward value based on published rates at the survey date and will move as the check-in date approaches.
■ Market data
- MetroEngines Research & Consulting — estimated settled ADR and listed prices (N=380–399 properties per month, Kumamoto Prefecture), occupancy (estimated, OTA listed-inventory basis), new opening data (based on confirmed OTA listings)
- Compiled by MetroEngines Research & Consulting from MLIT’s “Building Construction Statistics Survey” — building plan data for accommodation facilities
■ Government statistics and public data
- Kumamoto Prefecture, “2026 Official Land Price Survey (Kumamoto Prefecture section)” (18 March 2026)
- Japan Tourism Agency, “Overnight Travel Statistics Survey”
- Kumamoto City, “Kumamoto City Tourism Statistics”
- Kumamoto Prefecture tourism site, “Tourism Statistics Data”
■ News and press releases
- Nikkan Kensetsu Kogyo Shimbun, “JASM / Main construction of Fab 2 in Kikuyo, Kumamoto to begin under siting agreement with the town / operations from December 2027”
- Nikkei, “TSMC to manufacture 6-nanometre semiconductors in Kumamoto; Fab 2 to start operations in December 2027”
- Nikkei, “Up to ¥732 billion in subsidies for TSMC’s Kumamoto Fab 2, METI minister announces”
- Mynavi News, “JR Kyushu revises opening of new Hohi Line station between Sanrigi and Haramizu to ‘spring 2029 or later'” (3 December 2024)
- BUILT, “A 70-hectare large-scale urban development in Kikuyo, Kumamoto, a semiconductor cluster; Mitsubishi Corporation and Mitsui Fudosan selected as partners”
- Sun Frontier Fudousan, “Tabino Hotel Aso Kumamoto Airport, a regional-revitalization hotel approved by Kumamoto Prefecture as a ‘regional economy-driving project,’ opens 17 April”
- Workers Hotel Kumamoto Ozu official site
- “[Official land prices] Ozu’s growth rate is ‘first among all municipalities nationwide’; Kikuyo and Koshi, where TSMC has located, also rise sharply”
- Kumamoto Nichinichi Shimbun, “Foreign overnight guests top one million for the first time in Kumamoto City; total visitors and spending also at record highs”