

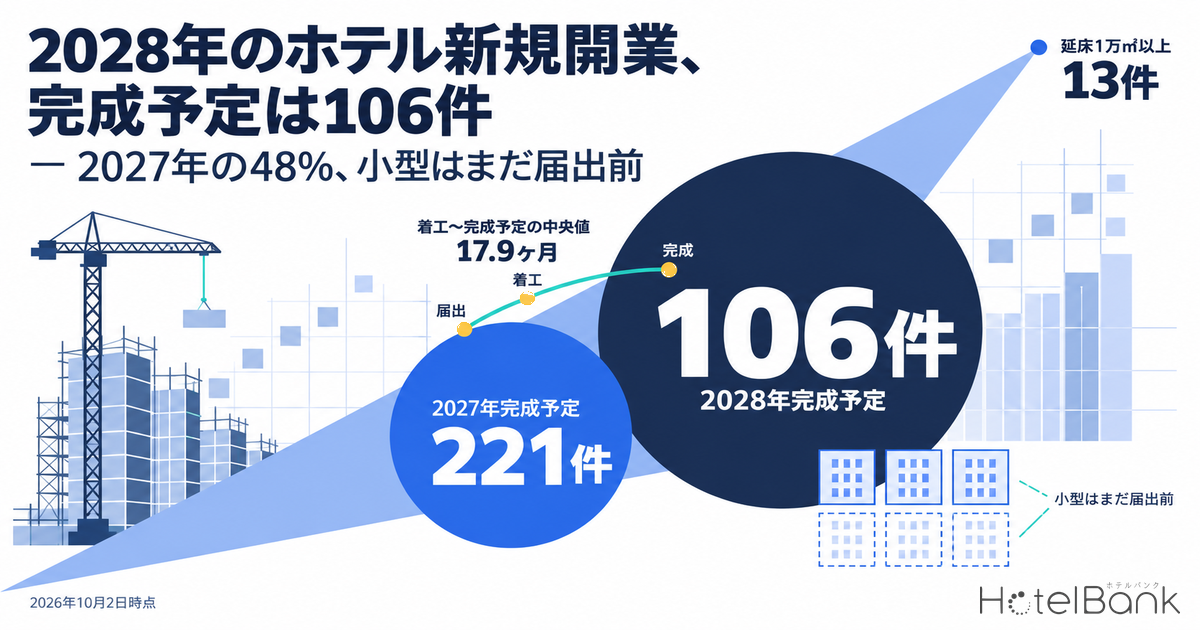
How much of Japan’s 2028 hotel opening pipeline is visible today? Tallying the building plans tracked by MetroEngines Research as of October 2, 2026, 106 hotel projects are scheduled for completion in 2028 — only 48.0% of the 221 scheduled for 2027. That gap does not mean supply will halve. Large projects with a gross floor area (GFA) of 10,000㎡ or more already number 13, the same as in 2027; what is missing are small projects that are completed roughly a year after construction starts. This article takes stock of the supply pipeline from 2028 onward by prefecture and size band, then overlays the lag from construction start to completion and the national building starts statistics to gauge the size of the “supply not yet visible” and to set out a timeline for investment decisions.
Metric Definitions Used in This Article
| Hotel project | A building-plan filing whose primary use includes a hotel (lodging facility). Compiled, within the scope tracked by MetroEngines Research, from public information such as the MLIT “Survey of Building Dynamics Statistics” (建築物動態統計調査). Limited to projects confirmed through building plans and press reports; it is not a complete count, nor does it indicate opening dates or operators. |
| Project count | Where the same building has multiple filings (plan changes, re-filings, etc.), they are consolidated into one project. The population for this article is 584 projects (scheduled completion in January 2025 or later), consolidated at the building level from 991 filings. The scheduled completion is taken from the most recent filing. |
| Scheduled completion | The year and month of scheduled completion stated in the filing. This is a planned date that can move earlier or later with construction delays or plan changes, and is not the opening date itself. |
| Hotel-led / mixed-use | A mechanical classification: filings whose primary use includes offices, multi-family housing, commercial facilities, halls, arenas or theaters are “mixed-use”; filings where a hotel is accompanied only by ancillary uses such as shops, restaurants and parking are “hotel-led”. |
| Existing room stock | Total rooms at properties tracked by MetroEngines Research that are confirmed to be operating (by prefecture). Smaller than the registration-based total. |
| Room estimate | For hotel-led projects whose filing does not state a room count, rooms are estimated as GFA ÷ 44.9㎡ per room (the median of N=34 hotel-led projects in Tokyo and Osaka with a known room count; the interquartile range of 18.6–54.1㎡ per room is used as the range). Mixed-use projects without a stated room count are excluded from the estimate. |
| Data sources | MetroEngines Research & Consulting / MLIT “Survey of Building Dynamics Statistics” (建築物動態統計調査) and MLIT “Building Starts Statistics” (建築着工統計調査) |
Source: Compiled by MetroEngines Research & Consulting from MLIT “Survey of Building Dynamics Statistics” (建築物動態統計調査) (N=584 projects, as of October 2, 2026. Based on building-confirmation filings identified at the time of the survey; project and room counts are expected to rise as further filings are added. Treat as a lower bound of the confirmed pipeline at this point.)
- — Hotel projects scheduled for completion in 2028 number 106, or 48.0% of the 221 for 2027 (building-plan basis, N=584, as of October 2, 2026). This is not a complete count but a lower bound of what is known today.
- — Projects with GFA of 3,000㎡ or more number 37, the same as in 2027. Of the 115-project gap between the two years, 113 arise below 3,000㎡: filings for small projects have not yet all come in.
- — The median from construction start to scheduled completion is 17.9 months (hotel-led 17.1 months, mixed-use 44.5 months; N=559). Projects under 3,000㎡ can still make a 2028 completion if they start by the end of 2027.
- — Known projects add +2.0% to existing room stock in Tokyo (range +1.7% to +4.8%), +2.1% in Kanagawa and +1.3% in Osaka. Part of the room count is estimated from GFA.
- — Outside the project list are the roughly 2,500 rooms of the Yumeshima IR, targeting an opening around autumn 2030, and the regional and resort construction starts shown in the building starts statistics (2,836 buildings and about 1.76 million ㎡ in 2024).
The Big Picture by Completion Year — 106 Projects for 2028, 48 Known for 2029 Onward
We start with the number of projects by scheduled completion year. Of the 584 projects consolidated at the building level, 60 are scheduled for completion in 2025, 149 in 2026 and 221 in 2027, after which the count falls to 106 in 2028, 28 in 2029 and single digits per year from 2030. Known projects from 2028 onward total 154, or 26.4% of the whole. Total GFA, however, is 1.37 million ㎡ for 2029, exceeding the 0.75 million ㎡ for 2028 even though 2028 has nearly four times as many projects. The further out the year, the fewer the projects but the larger each one is.
Source: Compiled by MetroEngines Research & Consulting from MLIT “Survey of Building Dynamics Statistics” (建築物動態統計調査) (N=584 projects, as of October 2, 2026. Based on building-confirmation filings identified at the time of the survey; project and room counts are expected to rise as further filings are added. Treat as a lower bound of the confirmed pipeline at this point.)
| Completion year | Projects | Of which Tokyo | Of which mixed-use | Total GFA | Room count stated | Scheduled start date passed |
|---|---|---|---|---|---|---|
| 2025 | 60 | 36 | 12 | 1,767,839㎡ | 28 / 5,587 rooms | 56 |
| 2026 | 149 | 97 | 12 | 1,385,538㎡ | 32 / 4,891 rooms | 140 |
| 2027 | 221 | 155 | 18 | 1,899,066㎡ | 39 / 4,792 rooms | 205 |
| 2028 | 106 | 74 | 8 | 752,178㎡ | 17 / 1,752 rooms | 72 |
| 2029 | 28 | 22 | 8 | 1,374,599㎡ | 4 / 636 rooms | 10 |
| 2030 | 5 | 4 | 3 | 238,156㎡ | — | 2 |
| 2031 | 5 | 4 | 4 | 1,113,264㎡ | 2 / 317 rooms | 3 |
| 2032 | 6 | 6 | 4 | 617,540㎡ | — | 0 |
| 2033 onward | 4 | 2 | 3 | 841,200㎡ | — | 0 |
| Total | 584 | 400 | 72 | 9,989,380㎡ | 122 / 17,975 rooms | 488 |
Source: Compiled by MetroEngines Research & Consulting from MLIT “Survey of Building Dynamics Statistics” (建築物動態統計調査) (N=584 projects, as of October 2, 2026. Based on building-confirmation filings identified at the time of the survey; project and room counts are expected to rise as further filings are added. Treat as a lower bound of the confirmed pipeline at this point.)
It would be premature to read this table as “supply thins out from 2028.” Building-plan filings are submitted shortly before construction starts and, as discussed below, small hotels are completed about a year after starting. In other words, for many of the small projects that will be completed in the second half of 2028, the filing itself has not yet been made. Indeed, 205 of the projects scheduled for completion in 2027 had passed their filed construction start date as of the survey date (October 2, 2026), compared with 72 of the 103 projects with a stated start date for 2028 completion, and only 10 for 2029. Filings that state a room count are also limited to 17 projects and 1,752 rooms for 2028, so total volume in room terms cannot be counted from filings alone.
Inside the 106 Projects for 2028 — 74 in Tokyo, 36 in Taito Ward Alone
Next we break the 106 projects scheduled for 2028 down by prefecture. Tokyo has 74 (69.8%), followed by Kanagawa and Osaka with 12 each, Chiba with 3, Hokkaido with 2, and Okayama, Gifu and Kyoto with 1 each. Within Tokyo, Taito Ward has 36, or 48.6% of the Tokyo total, followed by Sumida and Chuo wards with 9 each and Shinjuku Ward with 5. Small and mid-sized hotel projects of 1,000–3,000㎡ GFA are clustering in districts on the tourist routes such as Asakusa, Ueno and Kuramae. In Kanagawa, 7 of the 12 projects are in the towns of Hakone and Yugawara, and the 5 in Hakone are resort-type properties of 60–90 rooms.
| Prefecture | Scheduled for 2028 | Hotel-led | Mixed-use | Total GFA | Room count stated |
|---|---|---|---|---|---|
| Tokyo | 74 | 69 | 5 | 474,517㎡ | 4 / 136 rooms |
| Kanagawa | 12 | 11 | 1 | 121,635㎡ | 7 / 588 rooms |
| Osaka | 12 | 12 | 0 | 55,392㎡ | 1 / 117 rooms |
| Chiba | 3 | 2 | 1 | 15,596㎡ | 1 / 238 rooms |
| Hokkaido | 2 | 2 | 0 | 19,638㎡ | 1 / 200 rooms |
| Okayama | 1 | 0 | 1 | 40,400㎡ | 1 / 300 rooms |
| Gifu | 1 | 1 | 0 | Not stated | 1 / 120 rooms |
| Kyoto | 1 | 1 | 0 | 25,000㎡ | 1 / 53 rooms |
| Total | 106 | 98 | 8 | 752,178㎡ | 17 / 1,752 rooms |
Source: Compiled by MetroEngines Research & Consulting from MLIT “Survey of Building Dynamics Statistics” (建築物動態統計調査) (N=106 projects, as of October 2, 2026. Based on building-confirmation filings identified at the time of the survey; project and room counts are expected to rise as further filings are added. Treat as a lower bound of the confirmed pipeline at this point.)
By use, 98 of the 106 projects are hotel-led and 8 (7.5%) are mixed-use developments integrated with offices, housing, commercial facilities and the like. Among the 48 projects for 2029 onward, by contrast, mixed-use accounts for 22 (45.8%). What is visible for the distant years is mainly mixed-use development that redevelopment associations and major developers pursue over several years; hotel-led projects appear to be at the stage where filings are still to come.
By size band, GFA of 1,000–3,000㎡ is the most common with 50 projects, followed by 3,000–10,000㎡ with 24, under 1,000㎡ with 17 and 10,000㎡ or more with 13 (excluding 2 projects with no stated GFA). The 13 projects of 10,000㎡ or more are shown in the table below. Redevelopments in Shibuya, Nishi-Azabu and Akasaka, an arena-linked project in front of Kawasaki Station, a redevelopment in central Okayama City and several resort projects in Hakone — central-city mixed-use developments and hot-spring resorts line up in the same year.
| Location (to town level) | Primary use as filed | Floors | GFA | Rooms | Scheduled start | Scheduled completion |
|---|---|---|---|---|---|---|
| Shibuya, Shibuya-ku, Tokyo | Hotel, offices, hall, commercial facilities, industry incubation facility, parking, etc. | 33 | 191,150㎡ | Not stated | Aug 2024 | Aug 2028 |
| Nishi-Azabu, Minato-ku, Tokyo | Multi-family housing, shops, offices, hotel, car park | 54 | 96,827㎡ | Not stated | Sep 2024 | Apr 2028 |
| Ekimae-Honcho, Kawasaki-ku, Kawasaki, Kanagawa | Spectator venue (arena), hotel (lodging), other (bathing facility), shops | 17 | 52,600㎡ | Not stated | Aug 2025 | Jun 2028 |
| Nodayacho, Kita-ku, Okayama City, Okayama | Housing, hotel, shops | 12 | 40,400㎡ | 300 rooms | Apr 2021 | Dec 2028 |
| Akasaka, Minato-ku, Tokyo | Spectator venue (theater), hotel, restaurants, parking (car park), other (station building) | 18 | 38,143㎡ | Not stated | Nov 2023 | Mar 2028 |
| Sanjusangendo-mawari, Higashiyama-ku, Kyoto | Hotel | 4 | 25,000㎡ | 53 rooms | Not stated | Dec 2028 |
| Ginza, Chuo-ku, Tokyo | Hotel, parking (car park) | 15 | 14,495㎡ | Not stated | Nov 2025 | Dec 2028 |
| Gora, Hakone, Kanagawa | Hotel (68 rooms) | 4 | 11,800㎡ | 68 rooms | Jul 2026 | Dec 2028 |
| Kita 3-jo Nishi, Chuo-ku, Sapporo, Hokkaido | Hotel, restaurants | 17 | 11,084㎡ | Not stated | Sep 2026 | Jun 2028 |
| Tsuruhashi, Ikuno-ku, Osaka | Hotel | 11 | 10,920㎡ | Not stated | Jul 2026 | Jan 2028 |
| Sengokuhara, Hakone, Kanagawa | Hotel (60 rooms) | 2 | 10,280㎡ | 60 rooms | Jul 2026 | Jul 2028 |
| Gora, Hakone, Kanagawa | Hotel (3 buildings, 90 rooms in total) | 4 | 10,100㎡ | 90 rooms | Oct 2026 | Sep 2028 |
| Urikura, Kisarazu, Chiba | Mixed-use complex (commercial facilities, hotel, medical and welfare facilities, etc.) | 1 | 10,000㎡ | Not stated | Aug 2026 | Feb 2028 |
Source: Compiled by MetroEngines Research & Consulting from MLIT “Survey of Building Dynamics Statistics” (建築物動態統計調査) (N=13 projects (GFA of 10,000㎡ or more among those scheduled for 2028), as of October 2, 2026. Based on building-confirmation filings identified at the time of the survey; project and room counts are expected to rise as further filings are added. Treat as a lower bound of the confirmed pipeline at this point.)
Locations of hotel projects scheduled for completion in 2028 (N=106; circle size = GFA, dark color = mixed-use). The initial view shows central Tokyo; move the map to see other areas. Locations are approximate, derived from filed addresses. Source: Compiled by MetroEngines Research & Consulting from MLIT “Survey of Building Dynamics Statistics” (建築物動態統計調査)
What Is Not Yet Visible — Small Projects at 17.3% of 2027, Large Ones at 100%
This is the core of the article. Comparing the 106 projects for 2028 with the 221 for 2027 by size band, GFA of 10,000㎡ or more is 13 versus 13 and 3,000–10,000㎡ is 24 versus 24 — identical in both bands. But 1,000–3,000㎡ drops to 50 against 82 (61.0%), and under 1,000㎡ to 17 against 98 (17.3%). Of the 115-project gap between 2028 and 2027, 113 arise in the two bands below 3,000㎡.
Source: Compiled by MetroEngines Research & Consulting from MLIT “Survey of Building Dynamics Statistics” (建築物動態統計調査) (N=321 projects (excluding projects with no stated GFA), as of October 2, 2026. Based on building-confirmation filings identified at the time of the survey; project and room counts are expected to rise as further filings are added. Treat as a lower bound of the confirmed pipeline at this point.)
The same pattern shows up by quarter of scheduled completion. In 2027, each quarter is roughly flat at 53–60 projects, but in 2028 the count declines quarter by quarter, from 47 in January–March to 24 in April–June, 22 in July–September and 13 in October–December. The 35 projects in the second half of 2028 are only 32.7% of the 107 in the second half of 2027. There is no apparent reason for demand to be skewed toward the first half of 2028, so this downward slope most likely reflects simply how complete the filings are.
Source: Compiled by MetroEngines Research & Consulting from MLIT “Survey of Building Dynamics Statistics” (建築物動態統計調査) (N=355 projects (scheduled completion January 2027–December 2029), as of October 2, 2026. Based on building-confirmation filings identified at the time of the survey; project and room counts are expected to rise as further filings are added. Treat as a lower bound of the confirmed pipeline at this point.)
Measuring the Lag — Median 17.9 Months From Start to Scheduled Completion, 44.5 for Mixed-Use
Why are only the small projects not visible? The reason lies in differences in the time from construction start to completion. Measured across the 559 projects with both a scheduled start date and a scheduled completion date, the median is 17.9 months. Hotel-led projects (N=491) take 17.1 months (interquartile range 12.8–21.0 months) and mixed-use projects (N=68) take 44.5 months (25.2–58.6 months), a 2.6-fold difference by use. By size band, the median is 12.5 months for GFA under 1,000㎡, 18.0 months for 1,000–3,000㎡, 24.0 months for 3,000–10,000㎡ and 43.0 months for 10,000㎡ or more. Below 10,000㎡ the period lengthens by about half a year with each step up in size band; at 10,000㎡ or more it jumps as the share of mixed-use rises.
Source: Compiled by MetroEngines Research & Consulting from MLIT “Survey of Building Dynamics Statistics” (建築物動態統計調査) (N=559 projects (with both scheduled start and completion dates known), as of October 2, 2026. Based on building-confirmation filings identified at the time of the survey; project and room counts are expected to rise as further filings are added. Treat as a lower bound of the confirmed pipeline at this point.)
Working backward from these periods gives a rough guide to when construction must start to make a December 2028 completion: around May 2025 for GFA of 10,000㎡ or more, around December 2026 for 3,000–10,000㎡, around June 2027 for 1,000–3,000㎡ and around December 2027 for under 1,000㎡. Large and mid-sized projects have already reached or are about to reach their start window, which is consistent with their filings being largely complete. Conversely, projects under 3,000㎡ can still be completed in 2028 if they start between now and the end of 2027. Whether small-project filings build up to 2027 levels will be decided by filings over the next year or so.
| GFA band | Scheduled for 2027 | Scheduled for 2028 | 2028 / 2027 | Median start-to-completion | Start needed for completion by end-2028 (guide) |
|---|---|---|---|---|---|
| Under 1,000㎡ | 98 | 17 | 17.3% | 12.5 months (N=212) | Around Dec 2027 |
| 1,000–3,000㎡ | 82 | 50 | 61.0% | 18.0 months (N=176) | Around Jun 2027 |
| 3,000–10,000㎡ | 24 | 24 | 100.0% | 24.0 months (N=82) | Around Dec 2026 |
| 10,000㎡ or more | 13 | 13 | 100.0% | 43.0 months (N=81) | Around May 2025 (already passed) |
Source: Compiled by MetroEngines Research & Consulting from MLIT “Survey of Building Dynamics Statistics” (建築物動態統計調査) (N=559 projects (basis for the medians), as of October 2, 2026. Based on building-confirmation filings identified at the time of the survey; project and room counts are expected to rise as further filings are added. Treat as a lower bound of the confirmed pipeline at this point.)
Re-reading the Count if Filings Build Up — Three Cases
For the two bands below 3,000㎡ GFA, where filings are not yet complete, we set out three cases showing the project count if filings were hypothetically to build up to the same number as for 2027. The 104 known projects (those with a stated GFA) become 136 if only the 1,000–3,000㎡ band reaches the 2027 level, and 217 if both bands below 3,000㎡ do. This is a mechanical substitution of counts by size band, not a forecast. Note also that the 2027 count itself may still be added to by future filings.
| Case | Assumption | Under 1,000㎡ | 1,000–3,000㎡ | 3,000–10,000㎡ | 10,000㎡ or more | Scheduled for 2028, total | vs. 2027 |
|---|---|---|---|---|---|---|---|
| Known (lower bound) | Filings as of October 2, 2026 only | 17 | 50 | 24 | 13 | 104 | 47.9% |
| Middle | 1,000–3,000㎡ reaches 2027 level (82) | 17 | 82 | 24 | 13 | 136 | 62.7% |
| Upper guide | Both bands under 3,000㎡ reach 2027 level (98 and 82) | 98 | 82 | 24 | 13 | 217 | 100.0% |
Source: Compiled by MetroEngines Research & Consulting from MLIT “Survey of Building Dynamics Statistics” (建築物動態統計調査) (projects with a stated GFA; N=217 scheduled for 2027 and N=104 for 2028, as of October 2, 2026. A simple estimate by substituting counts, not a forecast.)
We also checked the relationship between scheduled completion and actual opening dates. Among projects scheduled for completion between January 2025 and September 2026, 12 had a location matching an opened property and both a scheduled start date and an opening date. The median from construction start to opening was 32.0 months: 26.4 months for the 8 hotel-led projects and about 48 months for the 4 mixed-use ones. In 10 of the 12 cases the opening date fell within one month either side of the scheduled completion date; the other two opened 3.4 months before and 7.2 months after. The matched projects are mainly larger ones of 150 rooms or more and N is only 12, so this should be treated as a reference value. Our earlier article, Hotel Build Times: 2.80-Year Median, 1.96 Solo vs 4.00 Mixed-Use, measured construction periods for projects of 50 rooms or more; the median here is shorter because this article includes small projects.
Source: MetroEngines Research & Consulting (based on confirmed OTA listings, N=12 properties) / MLIT “Survey of Building Dynamics Statistics” (建築物動態統計調査)
Filling the Gap With Building Starts Statistics — The Depth of Supply Outside the Project List
The project list tells us what is being built where, but it is not a yardstick for total supply. We therefore overlay lodging-use buildings from the MLIT “Building Starts Statistics” (建築着工統計調査). Nationwide starts shrank in floor area from 2,118 buildings and 3,039,844㎡ in 2018 to 2,222 buildings and 902,844㎡ in 2023, then recovered in 2024 to 2,836 buildings and 1,756,286㎡, up 94.5% YoY in floor area. That is 57.8% of the 2018 level. Applying the construction periods from the previous section, the 2024 starts would be completed in sequence from the second half of 2025 through 2028.
Source: Compiled by MetroEngines Research & Consulting from MLIT “Building Starts Statistics” (建築着工統計調査) (by use and by owner; lodging use, all owners, nationwide, 2011–2024)
Here we measure the gap against the project list. Projects in the list with a scheduled start in 2024 number 48, with hotel-led GFA of 166,959㎡ — 1.7% by count and 9.5% by floor area of that year’s building starts (2,836 buildings, 1,756,286㎡). The units and timing of aggregation differ, so this is not a strict comparison, but it gives a sense of scale: the project list captures only part of total supply, mainly mid-sized to large urban projects. The same holds from the side of actual openings: new openings in 2025, based on confirmed OTA listings, totaled 1,768 properties (23 rooms on average), far above the 60 projects in the list scheduled for 2025. Small lodging facilities such as rental villas and cottages hardly appear in the project list.
Ranking prefectures by floor area started in 2022–2024, Tokyo is the largest at 664,710㎡ (17.2% of the national total), followed by Hokkaido, Okinawa, Osaka and Nagasaki. Okinawa had 441 buildings and 296,914㎡ of starts and Nagano 436 buildings and 138,722㎡, yet the project list contains 1 project in Okinawa, 1 in Nagano and none in Nagasaki. For resort areas and regional markets, the building starts statistics show more depth than the project list. When reading 2028 supply in regional markets, blanks in the project list should not be interpreted as “no supply”; the building starts statistics and operator announcements should be used alongside it.
| Prefecture | Lodging-use floor area started (2022–2024 total) | Buildings | Share of national total (floor area) | Projects in the list (completion 2025 onward, all periods) | Of which scheduled for 2028 |
|---|---|---|---|---|---|
| Tokyo | 664,710㎡ | 147 | 17.2% | 400 | 74 |
| Hokkaido | 352,023㎡ | 425 | 9.1% | 27 | 2 |
| Okinawa | 296,914㎡ | 441 | 7.7% | 1 | 0 |
| Osaka | 234,896㎡ | 56 | 6.1% | 47 | 12 |
| Nagasaki | 197,235㎡ | 93 | 5.1% | 0 | 0 |
| Kyoto | 147,872㎡ | 157 | 3.8% | 11 | 1 |
| Nagano | 138,722㎡ | 436 | 3.6% | 1 | 0 |
| Chiba | 136,080㎡ | 559 | 3.5% | 12 | 3 |
| Kanagawa | 107,052㎡ | 109 | 2.8% | 39 | 12 |
| Fukuoka | 101,251㎡ | 77 | 2.6% | 1 | 0 |
Source: MLIT “Building Starts Statistics” (建築着工統計調査) (lodging use, all owners, 2022–2024) / Compiled by MetroEngines Research & Consulting from MLIT “Survey of Building Dynamics Statistics” (建築物動態統計調査) (project list: N=584, as of October 2, 2026; a lower bound based on building-confirmation filings) / MetroEngines Research & Consulting (based on confirmed OTA listings; 2025 openings N=1,768 properties)
How to Read It — 2028 Completions Are “2028–2029 Supply”; +2.0% of Existing Stock in Tokyo
When translating scheduled completions into supply, it is sensible to allow for a spread across years. In the 12 matched cases, opening dates were scattered around the scheduled completion date, with one slipping as much as 7.2 months later. The 35 projects scheduled for completion in the second half of 2028 would become 2029 supply if pre-opening preparation or construction takes longer. In practice, therefore, the 106 projects scheduled for 2028 are best read as “supply that will reach the market in 2028–2029.”
On that basis, we estimated the rate of increase against existing room stock for six major prefectures. In Tokyo, only 4 of the 74 projects scheduled for 2028 state a room count (136 rooms), so adding hotel-led projects without a stated room count, converted from GFA, gives about 3,266 rooms (range 2,731–7,705). Against the existing stock confirmed to be operating — 1,506 properties and 160,239 rooms — that is +2.0% (+1.7% to +4.8%). Osaka comes to about 1,223 rooms or +1.3%, Kanagawa about 883 rooms or +2.1%, and Hokkaido, Chiba and Kyoto are each below +1%. Compared with the projects scheduled for 2027 (Tokyo +3.1%, Chiba +2.3%), about two-thirds of that depth is already visible for 2028 in Tokyo. The ratio to existing stock at the ward level within Tokyo is covered in Tokyo 23 Wards Supply Pressure 2026, which can be read alongside the prefecture-level estimates here.
Source: Compiled by MetroEngines Research & Consulting from MLIT “Survey of Building Dynamics Statistics” (建築物動態統計調査) (lower bound based on building-confirmation filings; room counts partly estimated) / Existing room stock: MetroEngines Research & Consulting (properties confirmed to be operating; N=7,450 properties across the six prefectures)
| Prefecture | Existing room stock | Scheduled for 2027 (estimate) | % of stock | Scheduled for 2028 (estimate) | % of stock | Range | Mixed-use with unknown rooms (not estimated) |
|---|---|---|---|---|---|---|---|
| Tokyo | 1,506 properties / 160,239 rooms | 155 / approx. 4,966 rooms | +3.1% | 74 / approx. 3,266 rooms | +2.0% | +1.7–+4.8% | 5 |
| Osaka | 1,006 properties / 93,041 rooms | 23 / approx. 978 rooms | +1.1% | 12 / approx. 1,223 rooms | +1.3% | +1.1–+3.0% | — |
| Kanagawa | 760 properties / 42,982 rooms | 10 / approx. 702 rooms | +1.6% | 12 / approx. 883 rooms | +2.1% | +1.9–+3.0% | 1 |
| Hokkaido | 1,432 properties / 82,854 rooms | 13 / approx. 1,116 rooms | +1.3% | 2 / approx. 447 rooms | +0.5% | +0.5–+1.0% | — |
| Chiba | 634 properties / 44,241 rooms | 3 / approx. 1,000 rooms | +2.3% | 3 / approx. 266 rooms | +0.6% | +0.6–+0.7% | 1 |
| Kyoto | 2,112 properties / 43,967 rooms | 2 / approx. 160 rooms | +0.4% | 1 / approx. 53 rooms | +0.1% | +0.1–+0.1% | — |
Source: As above. Estimate uses GFA ÷ 44.9㎡ per room (range 18.6–54.1㎡ per room). Mixed-use projects without a stated room count are excluded from the estimate.
Growth rates of 1–2% a year are all lower bounds that count only projects already filed. As seen in the preceding sections, projects under 3,000㎡ GFA have ample room for filings to build up, and mixed-use projects whose room counts have not been disclosed (5 in Tokyo) are also outside the estimate. Put the other way round, what is locked in as large-scale room supply in central Tokyo for 2028 is a limited number of redevelopments, and for small and mid-sized hotel-led projects there is still time to make a go decision and reach the 2028 market.
The Yumeshima IR’s Roughly 2,500 Rooms — A Large Block Outside Building-Plan Data
As a large block outside the project list, we note the integrated resort (IR) on Yumeshima, Osaka. According to materials published by the City of Osaka, the Osaka IR is targeting an opening around autumn 2030, with a total of about 2,500 rooms across three hotels. In this article’s project list, Osaka Prefecture has 12 projects and about 1,223 rooms (estimate) scheduled for 2028 and no projects with a known room count for 2029 onward, so the IR’s roughly 2,500 rooms are about 2.0 times the known 2028 volume. Against this article’s existing stock (1,006 properties and 93,041 rooms confirmed to be operating), it is an addition of about 2.7%. In reading Osaka for 2028–2030, it is useful to view on separate time axes the steady build-up of small and mid-sized hotel projects at around 1% a year and the single large block that adds a high-2% share in 2030.
Source: City of Osaka, “Integrated Resort: Osaka IR” (統合型リゾート 大阪IR) / Compiled by MetroEngines Research & Consulting from MLIT “Survey of Building Dynamics Statistics” (建築物動態統計調査)
A Timeline for Investment Decisions — When to Revisit Which Data
To summarize, the pipeline from 2028 onward has two layers: “large projects already visible” and “small and mid-sized projects yet to become visible.” From the standpoint of investors and developers, it makes sense to separate the data and timing of review according to the size of the deal.
| Period | Supply becoming visible | Data to check | How to read it |
|---|---|---|---|
| October 2026–March 2027 | Projects under 3,000㎡ GFA completing in H1 2028 | Building-plan filings (monthly) | The period when the 71 projects for January–June 2028 will be added to. Filing trends in Taito Ward, Sumida Ward, Chuo Ward in Osaka City and similar areas serve as leading indicators. |
| April–December 2027 | Small and mid-sized projects completing in H2 2028–H1 2029 | Building-plan filings / building starts statistics for 2025 and 2026 | How close the 35 projects for H2 2028 come to H2 2027 (107) will determine the depth of supply for 2028–2029. |
| 2028 | Openings of 2028 completions; room-count disclosures for mixed-use developments completing in 2029–2030 | Actual openings based on confirmed OTA listings / operator announcements | Allow a spread of several months from scheduled completion to opening. Disclosure of room counts and operators for the 22 mixed-use projects for 2029 onward will progress. |
| Around autumn 2030 | Yumeshima IR, approx. 2,500 rooms | Materials published by the City of Osaka and the operator | Read as large-scale supply separate from the project list, together with price bands in the Osaka Bay area. |
Source: Compiled by MetroEngines Research & Consulting
In regional and resort markets, the small number of projects in the list may itself point to where the opportunities are. Projects scheduled for completion in 2028 could be confirmed in 8 prefectures; in the remaining 39, no filing-based projects are visible at this point. As the building starts statistics show, regional construction continues, but the prefectures where projects of 3,000㎡ GFA or more can be confirmed for 2028 are limited. This can also be read as leaving room to capture demand growth in markets where competition from new supply is relatively thin.
Summary
Hotel projects scheduled for completion in 2028 number 106, or 48.0% of 2027. However, the 37 projects of 3,000㎡ GFA or more already match the 2027 count, and almost all of the gap arises in projects under 3,000㎡, which are completed 12–18 months after construction starts. The median from start to scheduled completion is 17.1 months for hotel-led projects and 44.5 months for mixed-use, so small and mid-sized projects can still be completed in 2028 if they start by the end of 2027. The 2028 figure is a lower bound that will be added to by filings over the next year or so.
In terms of existing stock, known projects alone are estimated at +2.0% in Tokyo, +2.1% in Kanagawa and +1.3% in Osaka. On top of this come, separately, the regional and resort starts shown in the building starts statistics and the roughly 2,500 rooms of the Yumeshima IR around autumn 2030. In reading supply from 2028 onward, rather than comparing project counts by completion year at face value, it will be effective to update the picture quarterly, taking into account when filings become complete for each size band.
Frequently Asked Questions
Q. How many new hotels will open in Japan in 2028?
A. Within the scope tracked by MetroEngines Research, 106 hotel projects are scheduled for completion in 2028 (as of October 2, 2026, based on building-plan filings). This is not a complete count, and small projects are expected to increase as further filings come in.
Q. Why are there fewer projects for 2028 than for 2027?
A. Hotels with a gross floor area under 3,000㎡ are typically completed about 12–18 months after construction starts, so filings for 2028 completions have not yet all been submitted. Projects of 3,000㎡ or more match the 2027 count.
Q. What about 2029 and beyond?
A. There are 48 projects scheduled for completion in 2029 or later, of which 22 are mixed-use developments combined with offices, residences and other uses. Only some of the filings state a room count.
Recommended Reading
References and Sources
■ Data Sources
Hotel building-plan filing information compiled by MetroEngines Research & Consulting, within the scope it tracks, from public information such as the MLIT “Survey of Building Dynamics Statistics” (建築物動態統計調査) (584 projects consolidated at the building level from 991 filings; scheduled completion January 2025 or later; as of October 2, 2026). To supplement total supply we used the MLIT “Building Starts Statistics” (建築着工統計調査) (lodging use, 2011–2024); for existing room stock, rooms at properties confirmed to be operating (N=7,450 properties across six prefectures); and for actual openings, new openings based on confirmed OTA listings (2025: N=1,768 properties).
■ Estimation Assumptions
Hotel-led projects without a stated room count were converted at GFA ÷ 44.9㎡ per room (the median of N=34 hotel-led projects in Tokyo and Osaka with a known room count; the range is the interquartile 18.6–54.1㎡ per room). Mixed-use projects without a stated room count are excluded from the estimate. The start-to-scheduled-completion period is the median of the 559 projects with both dates known. The three cases for filing counts are a substitution by size band among projects with a stated GFA (217 scheduled for 2027 and 104 for 2028), not a forecast.
■ Limitations and Caveats
The project data is limited to what could be confirmed from building plans and press reports and is not a complete count. Tokyo accounts for 68.5% of the projects identified, and outside Tokyo coverage centers on projects above a certain size. Scheduled completion and start dates are planned dates as filed; they can change with construction delays or plan changes and do not indicate opening dates. The measurement from construction start to opening rests on a small sample of N=12 and is only a reference value. Ratios to existing stock are lower bounds counting only known projects, and investment decisions on individual deals require project-by-project scrutiny.
■ Market Data
| MetroEngines Research & Consulting — tally of hotel building plans (N=584, as of October 2, 2026), existing room stock (properties confirmed to be operating), and actual new openings (based on confirmed OTA listings; 2025: N=1,768 properties) |
■ Government Statistics and Public Data
| MLIT “Survey of Building Dynamics Statistics” (建築物動態統計調査) (building-plan filing information) |
| MLIT “Building Starts Statistics” (建築着工統計調査) (e-Stat; by use and by owner, lodging use, 2011–2024) |
| City of Osaka, “Integrated Resort: Osaka IR” (opening timing and total room count) |
| Geospatial Information Authority of Japan (GSI) address search (used to derive map locations) |