

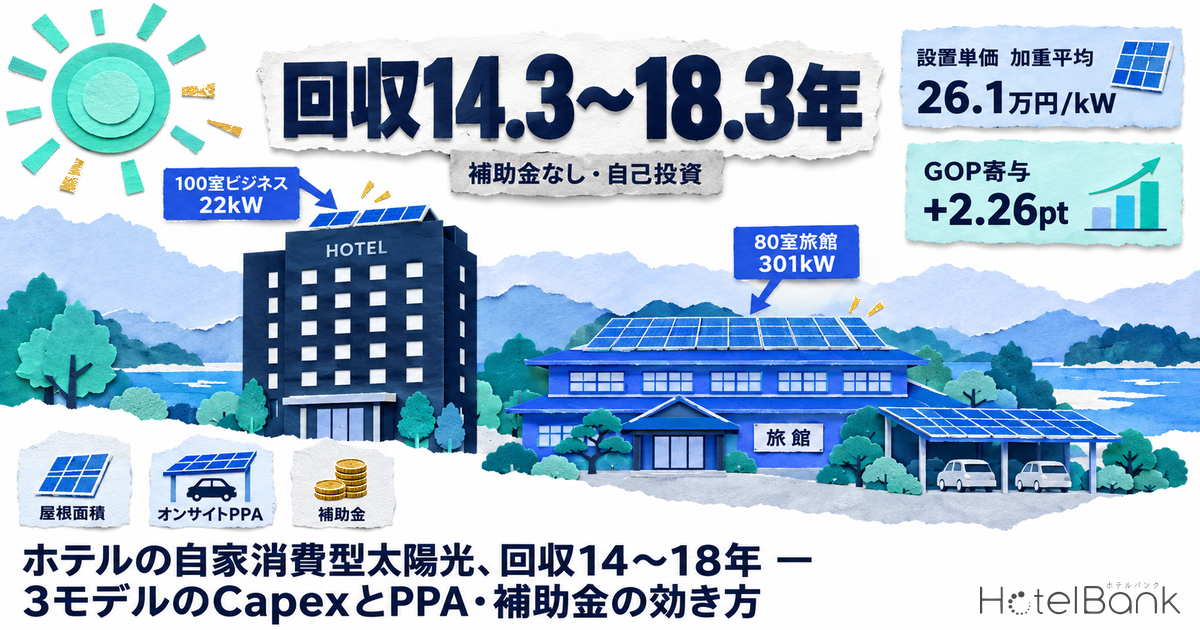
Putting solar panels on a hotel roof has usually been discussed in the context of “electricity got more expensive.” But what an investment decision actually needs is not the size of the price increase — it is how much the equipment itself costs and how many years it takes to earn that back. This article narrows the subject to exactly that: the capex and payback period of self-consumption rooftop solar. Using three models — a 100-room business hotel, a 200-room city hotel and an 80-room resort ryokan — we quantify installable capacity built up from roof area, regional generation yields, self-ownership versus on-site PPA, how each type of subsidy works, and finally the annual benefit per room and the contribution in GOP points.
Metric Definitions Used in This Article
- ADR (average daily rate): an estimated settled rate (tax-excluded equivalent) derived by applying a property-type correction factor to the cheapest publicly listed plan level each property posts on OTAs and similar channels (double occupancy, per-room price, tax included). Against property-level results disclosed by listed hotel REITs (91 properties, most recent three months), the median error is roughly 7%. These are estimates and differ from each property’s actual transacted prices and accounting figures. Area-level ADR is the median of the properties covered (the level of a typical property in that area).
- OCC (occupancy): the share of rooms sold against the total room count in an area (an estimate based on OTA sales inventory). Because it is based on how listed OTA inventory is absorbed, it differs from a property’s true overall occupancy.
- Cost per kW (installed cost): total construction cost of a solar PV system — design, equipment and installation work — expressed per 1 kW of PV output (tax excluded).
- Annual yield coefficient: annual generation per 1 kW of installed capacity (kWh/kW/year). Determined by local solar irradiance and design conditions.
- On-site PPA: a contract under which a power producer installs and owns solar generation equipment on the customer’s roof or site at its own expense and sells the electricity generated to that customer at a long-term fixed unit price. The customer’s upfront cost is zero.
- GOP (gross operating profit): hotel total revenue less departmental direct costs (rooms, F&B and so on) and undistributed operating expenses such as administration, sales and utilities. A cut in the electricity bill lifts GOP directly. “GOP contribution (pt)” in this article is the annual net effect divided by estimated total revenue, equivalent to the uplift in GOP margin.
- Data sources: MetroEngines Research & Consulting (ADR, OCC) / various public materials (equipment, subsidies, solar irradiance, electricity tariffs)
- — Payback of 14.3–18.3 years on self-funded investment with no subsidy. Installed cost is a weighted average of ¥261,000/kW, back-calculated from 307 grant approvals in Tokyo.
- — 0.22 kW versus 3.76 kW per room: a nine-storey, 100-room business hotel takes 22 kW; a three-storey, 80-room resort ryokan takes 301 kW including carport arrays. Capacity is set by building footprint, not room count.
- — Break-even at ¥189,000–245,000/kW: unless you can procure below that, an on-site PPA (¥12–15/kWh) beats self-investment on a 20-year cumulative basis.
- — Payback exceeds 20 years in the pessimistic case: at third-quartile installed cost and electricity rates 10% lower, the 100-room business hotel takes 26.5 years and the 80-room ryokan 23.9 years. A PPA stays cumulatively positive over 20 years in all three models.
- — GOP contribution of +0.07 to +2.26 pt: for urban properties it is a level that a 0.1 pt move in occupancy erases; for a low-rise ryokan with a large site it shifts more than 2 pt independently of demand swings.
Conclusion — 14–18 years to payback, decided by roof area and subsidy type
The conclusion first. Back-calculating installed cost from 307 grant-approval records published by the Tokyo Metropolitan Government gives a weighted average of ¥261,000/kW (tax excluded) for self-consumption solar of 10 kW and above. On that basis, self-funded investment without subsidy pays back in 14.3–18.3 years across the three models — a large share of a 20-year appraisal horizon spent simply recovering the outlay. An on-site PPA, by contrast, requires no upfront cost and turns cash-flow positive from year one, assuming a contract price of ¥15/kWh (tax excluded, fixed for 20 years).
More important is that this investment means something of an entirely different order depending on property type. The annual saving per room is ¥3,630 at the 100-room business hotel and ¥5,287 at the 200-room city hotel, but reaches ¥55,505 at the 80-room resort ryokan with room to spare on its site. Translated into GOP contribution, the first two deliver +0.07 pt and +0.08 pt while the resort ryokan delivers +2.26 pt. For urban limited-service hotels, rooftop solar is an investment where the available area is structurally insufficient; for low-rise properties on generous sites, it is an investment that moves the earnings structure.
What does installation actually cost — back-calculated from 307 grant approvals
The per-kW cost of self-consumption solar is usually quoted as a vendor estimate, and figures a third party can verify are hard to come by. So for this article we used the list of grant approvals under the “Local Production for Local Consumption Renewable Energy Reinforcement Project” published by Cool Net Tokyo (Tokyo Metropolitan Research Institute for Environmental Protection), covering fiscal 2020 through fiscal 2024, and back-calculated the per-kW cost of actually ordered projects by dividing eligible project costs by total output for cases approved for solar PV alone. Eligible costs include design, equipment and installation work.
There are 373 solar-only cases with no storage battery noted in the remarks column; of these, 307 have PV output of 10 kW or more, totalling 31,531 kW, with eligible costs of ¥8.22bn in aggregate. Dividing straightforwardly gives a weighted average of ¥261,000/kW and a median of ¥266,000/kW. Broken out by capacity band, economies of scale are unmistakable.
Source: Cool Net Tokyo (Tokyo Metropolitan Research Institute for Environmental Protection), “Local Production for Local Consumption Renewable Energy Reinforcement Project — List of Grant Approvals” (FY2020–FY2024); compiled by MetroEngines Research & Consulting
| Capacity band | Cases | Median cost/kW | 1st quartile | 3rd quartile |
|---|---|---|---|---|
| Under 10 kW | 66 | ¥296k | ¥244k | ¥450k |
| 10–49 kW | 140 | ¥300k | ¥250k | ¥381k |
| 50–99 kW | 65 | ¥248k | ¥205k | ¥302k |
| 100–199 kW | 67 | ¥239k | ¥190k | ¥287k |
| 200–499 kW | 25 | ¥248k | ¥185k | ¥284k |
| 500 kW and above | 10 | ¥229k | ¥161k | ¥271k |
Source: Cool Net Tokyo, “Local Production for Local Consumption Renewable Energy Reinforcement Project — List of Grant Approvals” (FY2020–FY2024, solar-only cases N=373); compiled by MetroEngines Research & Consulting
In the 10–49 kW band the median is ¥300,000/kW, but above 50 kW it falls to ¥248,000/kW and at 500 kW and above it reaches ¥229,000/kW. The interquartile range is wide because construction cost swings substantially with roof form (flat concrete roof versus folded-plate metal roof), spare capacity in the existing substation equipment, and scaffolding and lifting conditions. Put the other way: for the same capacity, whether a quote lands near the first or the third quartile moves payback by more than five years.
Note that this population consists of projects that received Tokyo subsidies, so it skews toward urban flat roofs and smaller projects, and should be read with that discount. A wide folded-plate roof in a regional location leaves room for lower unit costs.
On-site PPA terms — ¥12–15/kWh, fixed for 20 years
The option that requires no upfront outlay is the on-site PPA. A power producer installs and owns equipment on the customer’s roof and sells the electricity generated at a long-term fixed price. The producer also carries maintenance. At the end of the contract the equipment is either transferred to the customer or removed.
According to the Renewable Energy Institute’s “Corporate PPA: Latest Trends in Japan, 2025 Edition” (March 2025), the generation cost of an on-site PPA (solar, rooftop, 100% self-consumption) is ¥12–15/kWh over a 20-year contract term. That material estimates the national average level for fiscal 2024 and excludes consumption tax. It also shows variation by installation conditions: taking a folded-plate roof with 100% self-consumption as the baseline, a flat concrete roof raises the unit price by the cost of mounting structures, and a lower self-consumption ratio also pushes the price up.
The structural reason an on-site PPA comes in below ordinary grid purchases is clear. Power is generated and consumed within the same site, so the transmission and distribution network is not used. No wheeling charges apply, and the electricity is not subject to the renewable energy surcharge either. The same material puts ordinary high-voltage electricity at ¥22/kWh plus the renewable surcharge, and the gap against ¥12–15/kWh for an on-site PPA is the customer’s saving.
For the calculations in this article we built up the avoidable electricity price — the price that self-generation displaces — from published tariffs in each area. The energy charge unit prices (tax included) under TEPCO Energy Partner’s high-voltage “Basic Plan,” effective 1 April 2026, are ¥17.43 in Kanto, ¥16.78 in Kansai, ¥16.73 in Hokkaido and ¥16.42 in Kyushu. Converting these to a tax-excluded basis and adding the fiscal 2026 renewable energy surcharge of ¥4.18/kWh gives an avoidable unit price of ¥19.1–20.0 per kWh of self-consumption (tax excluded).
Regional yield gaps — 23% between Sapporo and Miyazaki, 21% in yen
The same capacity generates different amounts in different regions. We took global solar radiation (daily average, MJ/m²) for each location from the Japan Meteorological Agency’s climatological normals (1991–2020), then folded in the gain from tilted mounting and an overall system design coefficient to derive annual yield coefficients. Every assumption is disclosed in the “Calculation Assumptions” section below.
Source: Japan Meteorological Agency, “Past Weather Data — Climatological Normals (1991–2020)” / TEPCO Energy Partner, “Electricity Tariff Table (Extra-High and High Voltage), effective 1 April 2026”; compiled by MetroEngines Research & Consulting
| Location | Global solar radiation (MJ/m²/day) | Annual sunshine hours (hours) |
Yield coefficient (kWh/kW/yr) | Annual output at 100 kW | Annual saving at 100 kW | Tokyo=100 |
|---|---|---|---|---|---|---|
| Sapporo | 12.3 | 1,718.0 | 1,040 | 104,000 kWh | ¥2.02mn | 92 |
| Niigata | 12.4 | 1,639.6 | 1,050 | 105,000 kWh | ¥2.05mn | 93 |
| Tokyo | 12.7 | 1,926.7 | 1,130 | 113,000 kWh | ¥2.26mn | 100 |
| Nagano | 14.7 | 1,969.9 | 1,250 | 125,000 kWh | ¥2.44mn | 111 |
| Fukuoka | 13.3 | 1,889.4 | 1,190 | 119,000 kWh | ¥2.27mn | 105 |
| Osaka | 13.6 | 2,048.6 | 1,210 | 121,000 kWh | ¥2.35mn | 107 |
| Naha | 14.5 | 1,727.1 | 1,290 | 129,000 kWh | ¥2.47mn | 114 |
| Miyazaki | 14.4 | 2,121.7 | 1,280 | 128,000 kWh | ¥2.45mn | 113 |
Source: Japan Meteorological Agency, “Climatological Normals (1991–2020)”; calculations by MetroEngines Research & Consulting. Savings converted using each area’s high-voltage energy charge unit price (tax excluded) plus the renewable energy surcharge
Against Sapporo’s 1,040 kWh/kW/year, Miyazaki delivers 1,280 — a difference of 24,000 kWh a year on the same 100 kW. Converted into money, though, the gap narrows. Because the energy charge unit price in the Hokkaido area is higher than in Kyushu, the annual saving per 100 kW is about ¥2.02mn in Sapporo against about ¥2.45mn in Miyazaki, a gap of only 21%. Ruling out northern locations on irradiance alone is premature.
The other case easily overlooked in practice is Nagano. Its global solar radiation of 14.7 MJ/m²/day is the highest of the eight locations covered here, and even after building in snow losses the yield coefficient comes to 1,250 kWh/kW/year, close to Miyazaki. Inland highlands get strong irradiance at low temperatures, so output losses from panel heating are small. Highland resort roofs are better suited to generation than one might assume.
Source: Japan Meteorological Agency, “Climatological Normals (1991–2020)”; compiled by MetroEngines Research & Consulting
Installable capacity in three models — 22 kW / 61 kW / 301 kW
How many kW fit on a roof is determined by building footprint, storey count and roof form. We divided gross floor area by storey count to get the footprint, deducted mechanical plant, rooftop housings, evacuation routes and maintenance space to arrive at usable roof area, and then applied an area requirement per kW for each mounting method.
| Item | A. 100-room business hotel | B. 200-room city hotel | C. 80-room resort ryokan |
|---|---|---|---|
| Assumed location | Tokyo (Kanto area) | Osaka (Kansai area) | Miyazaki (Kyushu area) |
| Gross floor area | 3,300 m² | 12,000 m² | 6,400 m² |
| Storeys / footprint | 9 / 367 m² | 12 / 1,000 m² | 3 / 2,133 m² |
| Roof form | Flat roof (tilted mounts) | Flat roof (tilted mounts) | Pitched / folded-plate roof |
| Usable roof area (55%) | 202 m² | 550 m² | 1,173 m² |
| Area required per kW | 9.0 m²/kW | 9.0 m²/kW | 6.0 m²/kW |
| Parking carport | None | None | 60 spaces / 840 m² (8.0 m²/kW) |
| Installable capacity | 22 kW | 61 kW | 301 kW |
| Capacity per room | 0.22 kW | 0.31 kW | 3.76 kW |
| Annual output (20-yr average) | 23,617 kWh | 70,120 kWh | 366,016 kWh |
| Assumed self-consumption ratio | 100% | 100% | 85% |
Source: MetroEngines Research & Consulting calculations (all assumptions disclosed in the “Calculation Assumptions” section)
Source: MetroEngines Research & Consulting calculations
What the numbers show is the structural constraint on urban limited-service hotels. A 100-room business hotel gains volume through height, so its footprint is small: nine storeys leaves a roof of just 367 m². Strip out the plant room, stair housing, smoke-extraction equipment and maintenance walkways and the usable area is around 200 m², which takes only 22 kW — 0.22 kW per room.
The 80-room resort ryokan, by contrast, is three storeys with a 2,133 m² footprint: 195 kW on the roof alone, plus another 105 kW if carport structures are built over 60 parking spaces. That totals 301 kW, or 3.76 kW per room — 17 times the business hotel. What matters here is not room count but being low-rise and having a car park.
At the resort ryokan, however, daytime electricity demand caps the system before available capacity does. The Storage Parity programme’s own requirements prohibit reverse power flow (surplus electricity spilling back onto the grid), so output must be curtailed in hours when generation exceeds demand. These calculations set the resort ryokan’s self-consumption ratio at 85%, assuming 15% is curtailed. The more generous the site, the more the binding design constraint becomes daytime consumption rather than roof area.
■ Calculation Assumptions
1. Generation
- Annual horizontal-plane solar radiation = JMA climatological normals (1991–2020) global solar radiation (daily average, MJ/m²) × 365 ÷ 3.6
- Tilt correction factor 1.10 (assuming due-south orientation and 20–30° tilt)
- Overall design coefficient K = 0.80 (includes panel temperature rise, inverter losses, wiring losses and soiling)
- Snowy locations (Sapporo, Niigata, Nagano) are multiplied by an additional 0.95 for generation stoppage under winter snow cover
- Degradation: 0.95 of rated output on a 20-year average (assuming roughly 0.5% output decline per year)
2. Electricity unit price (avoidable cost)
- TEPCO Energy Partner high-voltage “Basic Plan” energy charge unit prices (effective 1 April 2026, tax included) divided by 1.1 for a tax-excluded basis: ¥17.43 Kanto, ¥16.78 Kansai, ¥16.73 Hokkaido, ¥16.42 Kyushu, ¥16.83 Chubu
- Renewable energy surcharge of ¥4.18/kWh added (fiscal 2026, for meter readings from May 2026 through April 2027)
- Fuel cost adjustment and market price adjustment unit prices are set to zero (a neutral assumption; in months when these are positive, savings come in higher)
- Result: avoidable unit prices of ¥20.03 Kanto, ¥19.43 Kansai, ¥19.39 Hokkaido and ¥19.11 Kyushu (all tax excluded, per kWh)
- Reductions in the basic (contracted demand) charge are not included in these calculations
3. System capacity
- Footprint = gross floor area ÷ storeys. Usable roof area = footprint × 55% (deducting mechanical plant, rooftop housings, evacuation routes and maintenance strips)
- Area required per kW: flat roof (tilted mounts with array spacing) 9.0 m²/kW, pitched or folded-plate roof (flush-mounted) 6.0 m²/kW, carport structures 8.0 m²/kW
- Carports converted at 14 m² per parking space
4. Costs
- Installed cost (tax excluded): Model A ¥300,000/kW (median of the 10–49 kW band), Model B ¥248,000/kW (median of the 50–99 kW band), Model C ¥270,000/kW (the ¥248,000 median of the 200–499 kW band plus a premium for carport structures)
- Maintenance: ¥5,000/kW/year (periodic inspection, remote monitoring, insurance and a reserve for inverter replacement)
- Storage battery (only in the subsidy case): ¥118,000/kWh (tax excluded, installation included — the fiscal 2026 target price for commercial and industrial batteries set out in the Ministry of the Environment’s FY2026 Storage Parity programme application guidelines)
5. On-site PPA
- Contract price: ¥15.0/kWh for Models A and B (flat roofs) and ¥14.0/kWh for Model C (mainly pitched roof). All tax excluded and fixed for 20 years, set within the ¥12–15/kWh rooftop range indicated by the Renewable Energy Institute according to installation conditions
- Zero upfront and maintenance cost for the customer. Contract term of 20 years
6. Revenue (the denominator for GOP contribution)
- ADR is MetroEngines Research’s estimated settled ADR (monthly median, September 2025 to August 2026). A = Tokyo business hotels ¥14,098 (monthly median of 914 properties covered), B = Osaka city hotels ¥13,084 (92 properties), C = Miyazaki ryokan ¥7,248 (44 properties)
- OCC is estimated occupancy for July 2026 (based on OTA listed inventory). A = 91.7% (Tokyo, business, N=535 properties / 77,917 rooms), B = 83.9% (Osaka, city, N=34 properties / 7,897 rooms), C = 83.6% (Miyazaki, ryokan, N=21 properties / 330 rooms)
- Total revenue = rooms revenue ÷ rooms revenue share. Assumed at 88% for A, 62% for B and 90% for C
Payback — 14.3–18.3 years self-funded, PPA positive from year one
| Item | A. Business, 100 rooms 22 kW / Tokyo | B. City, 200 rooms 61 kW / Osaka | C. Ryokan, 80 rooms 301 kW / Miyazaki |
|---|---|---|---|
| Self-investment | |||
| Upfront investment (tax excl.) | ¥6.60mn | ¥15.13mn | ¥81.27mn |
| Annual self-consumed output | 23,617 kWh | 70,120 kWh | 311,114 kWh |
| Annual electricity saving | ¥473k | ¥1.36mn | ¥5.95mn |
| Maintenance cost | −¥110k | −¥305k | −¥1.51mn |
| Annual net effect | ¥363k | ¥1.06mn | ¥4.44mn |
| Simple payback period | 18.2 yrs | 14.3 yrs | 18.3 yrs |
| Cumulative 20-year result | +¥660k | +¥6.02mn | +¥7.54mn |
| On-site PPA (zero upfront cost) | |||
| PPA contract price | ¥15.0/kWh | ¥15.0/kWh | ¥14.0/kWh |
| Spread vs avoidable price | ¥5.03/kWh | ¥4.43/kWh | ¥5.11/kWh |
| Annual net effect | ¥119k | ¥311k | ¥1.59mn |
| Cumulative 20-year result | +¥2.38mn | +¥6.21mn | +¥31.80mn |
| Installed cost at which self-investment wins | ¥222,000/kW or below | ¥245,000/kW or below | ¥189,000/kW or below |
Source: MetroEngines Research & Consulting calculations (all assumptions disclosed in the “Calculation Assumptions” section)
Source: MetroEngines Research & Consulting calculations
The most practically useful line in this table is the break-even at the bottom. For self-investment to beat an on-site PPA on a cumulative 20-year basis, installed cost has to be held at or below ¥189,000–245,000/kW depending on the model. The medians from the grant-approval data in the previous section were ¥300,000/kW in the 10–49 kW band and ¥248,000/kW in the 50–99 kW band. In other words, at small capacities, self-investment cannot reach the PPA as long as you procure at the market’s typical price. Only above 50 kW does the break-even come within reach, and self-investment wins clearly if competitive bidding pulls the quote toward the first quartile (¥190,000–210,000/kW).
This structure explains exactly why on-site PPAs spread so quickly in Japan. Power producers procure equipment across multiple projects at once, and they qualify for the subsidies discussed below at a higher rate than owner-occupiers do. The price a single hotel gets on a one-off order carries the full weight of that scale difference.
Source: MetroEngines Research & Consulting calculations
Swinging installed cost from ¥200,000/kW to ¥300,000/kW moves payback by six to seven years in all three models: from 11.5 to 17.3 years in Model B (61 kW) and from 13.6 to 20.3 years in Model C (301 kW). The spread in quoted prices affects payback more than the regional difference in irradiance (23% between Sapporo and Miyazaki). For an existing property that cannot choose its location, the numbers confirm the obvious: the variable you can move is procurement price.
Sensitivity analysis — how far payback moves on installed cost and electricity price
The payback figures above are a central case that fixes installed cost and avoidable electricity price at a single point each. In a real investment decision, the result shifts with where the quote lands within the quartiles of the grant-approval data, and with which way the fuel cost adjustment and market price adjustment — set to zero in the assumptions — actually move. So we applied the first and third quartiles by capacity band to installed cost, ±10% (roughly ±¥2 per kWh) to the avoidable price, and built optimistic, central and pessimistic scenarios. Generation, maintenance cost and the PPA contract price are held at the assumptions given in the body.
| Model | Scenario | Installed cost | Avoidable price | Annual net effect | Payback | 20-yr cumulative (self-investment) | 20-yr cumulative (PPA) | GOP contribution (self-investment) |
|---|---|---|---|---|---|---|---|---|
| A. Business, 100 rooms (22 kW / Tokyo) | Optimistic | ¥250k 1st quartile | ¥22.03 +10% | ¥410k | 13.4 yrs | +¥2.71mn | +¥3.32mn | +0.08 pt |
| Central | ¥300k body assumption | ¥20.03 ±0% | ¥363k | 18.2 yrs | +¥660k | +¥2.38mn | +0.07 pt | |
| Pessimistic | ¥381k 3rd quartile | ¥18.03 −10% | ¥316k | 26.5 yrs | −¥2.07mn | +¥1.43mn | +0.06 pt | |
| B. City, 200 rooms (61 kW / Osaka) | Optimistic | ¥205k 1st quartile | ¥21.37 +10% | ¥1.19mn | 10.5 yrs | +¥11.37mn | +¥8.94mn | +0.09 pt |
| Central | ¥248k body assumption | ¥19.43 ±0% | ¥1.06mn | 14.3 yrs | +¥6.02mn | +¥6.21mn | +0.08 pt | |
| Pessimistic | ¥302k 3rd quartile | ¥17.49 −10% | ¥921k | 20.0 yrs | ±¥0 | +¥3.49mn | +0.07 pt | |
| C. Ryokan, 80 rooms (301 kW / Miyazaki) | Optimistic | ¥207k 1st quartile | ¥21.02 +10% | ¥5.04mn | 12.4 yrs | +¥38.39mn | +¥43.69mn | +2.56 pt |
| Central | ¥270k body assumption | ¥19.11 ±0% | ¥4.44mn | 18.3 yrs | +¥7.54mn | +¥31.80mn | +2.26 pt | |
| Pessimistic | ¥306k 3rd quartile | ¥17.20 −10% | ¥3.85mn | 23.9 yrs | −¥15.19mn | +¥19.91mn | +1.96 pt |
Source: quartiles by capacity band from Cool Net Tokyo, “Local Production for Local Consumption Renewable Energy Reinforcement Project — List of Grant Approvals” (FY2020–FY2024), and TEPCO Energy Partner, “Electricity Tariff Table (Extra-High and High Voltage), effective 1 April 2026”; calculations by MetroEngines Research & Consulting. Installed costs use the quartiles of the 10–49 kW band for A, the 50–99 kW band for B and the 200–499 kW band for C (C adds ¥22,000/kW for carport structures, as in the central case). The denominator for GOP contribution is fixed at the estimated total revenue in Table 9
In the pessimistic scenario, Model A pays back in 26.5 years — beyond the 20-year appraisal horizon — and its cumulative 20-year result is −¥2.07mn. Model C is also short of full recovery at 23.9 years and −¥15.19mn. Model B lands at 20.0 years, almost exactly on the horizon. In the optimistic scenario, meanwhile, Model C pays back in 12.4 years with a cumulative +¥38.39mn, narrowing the gap against the PPA under the same conditions (+¥43.69mn). The on-site PPA stays cumulatively positive over 20 years in all three models even on the downside for electricity prices, beating self-investment on resilience to adverse moves.
The next two tables move both variables at once. Green marks payback within 15 years, red beyond the 20-year horizon, and the bold outline marks the central case used in the body.
| Installed cost \ avoidable price | −20% ¥15.5/kWh | −10% ¥17.5/kWh | ±0% ¥19.4/kWh | +10% ¥21.4/kWh | +20% ¥23.3/kWh |
|---|---|---|---|---|---|
| ¥180,000/kW | 14.0 yrs | 11.9 yrs | 10.4 yrs | 9.2 yrs | 8.3 yrs |
| ¥210,000/kW | 16.3 yrs | 13.9 yrs | 12.1 yrs | 10.7 yrs | 9.6 yrs |
| ¥248,000/kW | 19.3 yrs | 16.4 yrs | 14.3 yrs | 12.7 yrs | 11.4 yrs |
| ¥270,000/kW | 21.0 yrs | 17.9 yrs | 15.6 yrs | 13.8 yrs | 12.4 yrs |
| ¥300,000/kW | 23.3 yrs | 19.9 yrs | 17.3 yrs | 15.3 yrs | 13.8 yrs |
| Installed cost \ avoidable price | −20% ¥15.3/kWh | −10% ¥17.2/kWh | ±0% ¥19.1/kWh | +10% ¥21.0/kWh | +20% ¥22.9/kWh |
|---|---|---|---|---|---|
| ¥180,000/kW | 16.7 yrs | 14.1 yrs | 12.2 yrs | 10.8 yrs | 9.6 yrs |
| ¥210,000/kW | 19.4 yrs | 16.4 yrs | 14.2 yrs | 12.6 yrs | 11.2 yrs |
| ¥240,000/kW | 22.2 yrs | 18.8 yrs | 16.3 yrs | 14.3 yrs | 12.8 yrs |
| ¥270,000/kW | 25.0 yrs | 21.1 yrs | 18.3 yrs | 16.1 yrs | 14.4 yrs |
| ¥300,000/kW | 27.8 yrs | 23.5 yrs | 20.3 yrs | 17.9 yrs | 16.0 yrs |
Source: MetroEngines Research & Consulting calculations (no subsidy, tax excluded; generation and maintenance at ¥5,000/kW/year as set out in the “Calculation Assumptions” section)
What the two tables show is that a ¥30,000/kW difference in installed cost and a 10% difference in electricity price carry roughly equal weight for payback. In Model B, holding the price to ¥210,000/kW pays back in 13.9 years even if electricity prices fall 10%, while ordering at ¥300,000/kW takes 15.3 years even if electricity prices rise 10%. In Model C, a 20% fall in electricity prices pushes payback past 15 years (to 16.7) even at ¥180,000/kW. Model A (22 kW), not shown in the tables, pays back in 12.7 years at ¥210,000/kW with electricity prices unchanged, and in 20.9 years at ¥300,000/kW with prices 10% lower. Since a property cannot move the electricity price, how far negotiation can pull installed cost toward the first quartile is the real deciding factor between self-investment and a PPA.
How subsidies work — a flat per-kW grant and a one-half grant rate give opposite answers
There are two main types of national subsidy worth comparing for self-consumption solar on a hotel roof. As of September 2026 the Ministry of the Environment’s flat-rate programme is open for applications, while the Japan Tourism Agency’s grant-rate programme is used here as a reference case on the terms under which it was offered in fiscal 2025. Because the two are designed on different principles, which one is better flips with property size.
The Ministry of the Environment’s “Project to Promote Cost Reduction of Solar Power Generation Equipment Toward Achieving Storage Parity” (FY2026 initial budget) is running a second application round from 27 August 2026 to noon on 2 October 2026 (the first round ran from 9 July to 31 July 2026). The implementing body is the Environmental Restoration and Conservation Agency’s designated organisation, the Environmental Innovation Information Organization. Reference grant amounts are ¥40,000/kW for owner-installed solar and ¥50,000/kW for on-site PPA or lease arrangements (each capped at ¥20mn), and ¥39,000/kWh for commercial and industrial stationary storage batteries (capped at ¥40mn), with a combined cap of ¥60mn per application.
Five requirements matter under this programme. First, solar equipment and a storage battery must be installed together in the same project (except where perovskite solar cells are installed under a separate project). Second, the self-consumption ratio must be at least 50%. Third, other than detached housing, generated power must not be exported to the grid in reverse flow (which, as a rule, requires a reverse power relay). Fourth, no FIT or FIP certification may be obtained. Fifth, from the second round onward, equipment with IP communication functions is limited to products carrying a JC-STAR conformity label (★1 or above). The implementation deadline for subsidised projects under the FY2026 initial-budget second round is 29 January 2027.
The Japan Tourism Agency’s “Accommodation Facility Sustainability Enhancement Support Project” is aimed specifically at lodging operators, supporting energy-efficient HVAC and lighting, energy-efficient boilers, solar generation and storage equipment at a grant rate of one-half capped at ¥10mn. The fiscal 2025 round was open from 24 March to 30 May 2025. As of September 2026, no fiscal 2026 round for this programme appears in the Japan Tourism Agency’s 2026 application listings, so case ③ in the table below is a reference calculation applying the fiscal 2025 terms (one-half, capped at ¥10mn) unchanged. Read it as a comparison axis in case a similar grant-rate programme is offered again, and check the Japan Tourism Agency’s application information for the current position before applying.
By contrast, the Ministry of Economy, Trade and Industry’s “Support Project for Customer-Led Solar Power Generation and Renewable-Paired Storage Batteries” cannot be used for self-consumption solar on a hotel roof. That programme is designed around off-site PPAs involving a power producer, a customer and a retail electricity supplier, and it covers generation facilities of 2 MW or more and under 30 MW in aggregate; on-site arrangements are out of scope. On top of that, no new round is being run in fiscal 2026, leaving only outlays for previously selected projects. It should not be assumed as a basis when considering a rooftop project of tens to hundreds of kW.
| Case | A. Business, 100 rooms 22 kW | B. City, 200 rooms 61 kW | C. Ryokan, 80 rooms 301 kW |
|---|---|---|---|
| ① No subsidy (solar only) net cost / payback | ¥6.60mn 18.2 yrs | ¥15.13mn 14.3 yrs | ¥81.27mn 18.3 yrs |
| ② Storage Parity programme solar + battery (simultaneous installation required) | ¥7.30mn 20.1 yrs (+1.9 yrs) | ¥15.06mn 14.2 yrs (−0.1 yrs) | ¥81.08mn 18.3 yrs (±0 yrs) |
| ③ Accommodation Sustainability Enhancement (fiscal 2025 terms, reference) one-half grant rate, capped at ¥10mn | ¥3.30mn 9.1 yrs (−9.1 yrs) | ¥7.56mn 7.2 yrs (−7.1 yrs) | ¥71.27mn 16.1 yrs (−2.2 yrs) |
| Grant amount | ② ¥1.66mn / ③ ¥3.30mn | ② ¥3.61mn / ③ ¥7.56mn | ② ¥17.89mn / ③ ¥10.00mn |
Source: Ministry of the Environment, “FY2026 Application Guidelines — Project to Promote Cost Reduction of Solar Power Generation Equipment Toward Achieving Storage Parity” / Japan Tourism Agency, “Accommodation Facility Sustainability Enhancement Support Project”; calculations by MetroEngines Research & Consulting. Case ② includes the cost of the storage battery (A = 20 kWh, B = 30 kWh, C = 150 kWh) in net cost and excludes any reduction in the basic charge from the battery
Source: MetroEngines Research & Consulting calculations
The results mirror the design of each programme. Because the Storage Parity programme pays a flat amount per kW and per kWh, the total grant grows with capacity. Model C (301 kW plus 150 kWh) qualifies for ¥17.89mn, which roughly offsets the ¥17.70mn cost of the battery. For a large property, in other words, the programme works as a way to add a storage battery at effectively no cost.
In Model A (22 kW), by contrast, the solar grant of ¥880k is set against a net ¥1.58mn for a 20 kWh battery, so net cost ends up ¥700k higher than for solar alone. Payback stretches from 18.2 to 20.1 years. Reaching for the battery requirement at small capacity produces the inversion where taking the subsidy slows payback down.
The Japan Tourism Agency’s lodging-sector programme (on fiscal 2025 terms), meanwhile, is a one-half grant rate capped at ¥10mn, so investment up to ¥20mn is halved outright. Payback shortens to 9.1 years in Model A and 7.2 years in Model B, gains of seven to nine years. In Model C, however, the ¥10mn cap binds against an ¥81.27mn investment, so the gain is only 2.2 years.
In short, the grant-rate programme (Japan Tourism Agency) works roughly below 100 kW and the flat-rate programme (Storage Parity) above 200 kW. Because duplicate national subsidies on the same equipment are generally not allowed, deciding which programme to target on the basis of scale is the design fork to settle first. Note also that peak shaving by the battery — excluded from case ② — leaves upside in the basic charge worth roughly ¥140k a year in Model A, ¥190k in Model B and ¥910k in Model C (assuming contracted demand can be lowered by 50% of battery output). There is separate value in securing emergency power that is hard to quantify.
Annual benefit per room and GOP contribution — 0.07 pt, or 2.26 pt
The meaning of the investment becomes clear not in absolute yen but per room and as a share of revenue. The lodging industry as a whole runs sustained capital expenditure on the order of ¥430,000 per room per year, so it also matters what share of that budget solar would take.
| Item | A. Business, 100 rooms | B. City, 200 rooms | C. Ryokan, 80 rooms |
|---|---|---|---|
| Estimated ADR (12-month median) | ¥14,100 | ¥13,100 | ¥7,200 |
| Estimated OCC (July 2026) | 91.7% | 83.9% | 83.6% |
| Estimated rooms revenue (yr) | ¥472mn | ¥801mn | ¥177mn |
| Estimated total revenue (yr) | ¥536mn | ¥1,293mn | ¥197mn |
| Annual benefit per room (self-investment) | ¥3,630 | ¥5,287 | ¥55,505 |
| Annual benefit per room (PPA) | ¥1,188 | ¥1,553 | ¥19,872 |
| GOP contribution (self-investment) | +0.07 pt | +0.08 pt | +2.26 pt |
| GOP contribution (PPA) | +0.02 pt | +0.02 pt | +0.81 pt |
| Expressed in ADR (benefit per room ÷ ADR) | 0.26 nights | 0.40 nights | 7.66 nights |
Source: MetroEngines Research & Consulting (estimated ADR and estimated OCC) and its own calculations
Model A’s ¥3,630 per room per year is only 0.26 nights of ADR. A GOP contribution of +0.07 pt disappears with a 0.1 pt move in occupancy. For urban limited-service hotels, rooftop solar will not be the lead measure against electricity costs. The same capital put into HVAC or lighting replacement will tend to deliver more reduction per yen invested.
Model C, on the other hand, delivers ¥55,505 per room per year — 7.66 nights of ADR — and +2.26 pt of GOP. At an 80-room ryokan, an annual net effect of ¥4.44mn is one of the few ways to move GOP margin by 2 pt without raising room rates. And the effect is independent of swings in occupancy and rate. Cash flow that does not erode when demand falls carries more weight from an investor’s perspective than ordinary fixed-cost reduction.
That said, Model C’s GOP contribution is sensitive to how the denominator is set. Estimated ADR for the Miyazaki ryokan category is ¥7,248 across a monthly median of 44 properties covered, but the average property in that population is small (the July 2026 estimated OCC covers 21 properties and 330 rooms), and an 80-room resort ryokan most likely sits in a higher rate band than that median. Resetting ADR to ¥15,000 lifts estimated total revenue to ¥407mn and lowers GOP contribution to +1.09 pt. Even then it clears 1 pt.
Summary — use roof square metres as the first screen
Three practical guidelines follow from these calculations.
First, the scale of the investment is set by building footprint, not room count. The gap between 22 kW at the 100-room business hotel and 301 kW at the 80-room resort ryokan comes from storeys and site, not rooms. As a first screen on any project, footprint (gross floor area ÷ storeys) and the number of parking spaces give you the order of magnitude of installable capacity and savings on the spot. At properties below 0.3 kW per room, solar will not rank highly as a way to cut electricity costs.
Second, the fork between self-investment and an on-site PPA sits at ¥190,000–250,000/kW. If there is a credible path to ordering at or below that level, self-investment wins on a cumulative 20-year basis; if not, a PPA leaves more cash in hand. Where a project below 50 kW is quoted at the market median of ¥300,000/kW, there is little rationale for going ahead with self-investment.
Third, choose a subsidy by its type. The flat-rate Storage Parity programme (¥40,000/kW owner-installed, ¥50,000/kW on-site PPA, plus ¥39,000/kWh for batteries; second round closing at noon on 2 October 2026) works better the larger the capacity, and because simultaneous battery installation is required it can actually raise net cost at small capacities. The grant-rate Accommodation Facility Sustainability Enhancement Support Project (fiscal 2025 terms: one-half, capped at ¥10mn; no fiscal 2026 round listed as of September 2026) shortens payback by seven to nine years on projects up to ¥20mn under the same terms. Along with the fact that the customer-led off-site programme does not cover rooftop projects, confirm the scope of each programme before anything else.
Look at on-site generation as a question of capex and payback rather than energy self-sufficiency, and much of the answer is already written into the shape of the building. In an onsen district there is also the option of monetising a heat source other than solar, which is a separate line of analysis.
Related reading
References and Sources
■ Data sources
Installed cost is eligible project cost ÷ PV output for the 373 solar-only cases (307 of them at 10 kW or above) in the list of grant approvals published by Cool Net Tokyo (FY2020–FY2024). Solar irradiance is from JMA climatological normals (1991–2020); electricity prices are TEPCO Energy Partner’s high-voltage standard menu (effective 1 April 2026) plus the fiscal 2026 renewable energy surcharge; subsidy figures are from each implementing body’s application guidelines and notices. Estimated settled ADR and estimated occupancy are MetroEngines Research & Consulting aggregates (ADR is the monthly median by prefecture × property type; OCC is an estimate based on OTA listed inventory).
■ Calculation assumptions
Yield coefficients, avoidable unit prices, installable capacity, installed cost, maintenance cost, PPA contract prices and how revenue is set are all disclosed item by item in the “Calculation Assumptions” section above. Payback is simple payback on 20-year average generation (no discount rate, tax effects or depreciation). Sensitivity analysis varies installed cost across the quartiles by capacity band and the avoidable price by ±10% (±20% in the two-axis tables).
■ Limitations and caveats
The grant-approval data covers Tokyo-subsidised projects and skews toward urban flat roofs and smaller projects. The three models are standard forms derived from gross floor area and storey count, and do not reflect constraints from structural capacity, substation equipment or grid interconnection. Fuel cost adjustment and basic-charge reduction are set neutral (zero). The Japan Tourism Agency’s grant-rate programme is a reference calculation on fiscal 2025 terms; as of September 2026 no fiscal 2026 round is listed. Estimated ADR and estimated OCC differ from actual transacted prices and from a property’s true overall occupancy.
■ Market data
- MetroEngines Research & Consulting — estimated settled ADR (Tokyo business hotels, Osaka city hotels, Miyazaki ryokan, September 2025 to August 2026), estimated occupancy (based on OTA listed inventory, July 2026)
■ Equipment costs and subsidies
- Cool Net Tokyo (Tokyo Metropolitan Research Institute for Environmental Protection), “Local Production for Local Consumption Renewable Energy Reinforcement Project” — list of grant approvals (FY2020–FY2024)
- Ministry of the Environment, “Second call for applications under the FY2026 budget: Project to Promote Cost Reduction of Solar Power Generation Equipment Toward Achieving Storage Parity” (27 August 2026)
- Environmental Innovation Information Organization, “FY2026 initial budget — Application guidelines, Project to Promote Cost Reduction of Solar Power Generation Equipment Toward Achieving Storage Parity”
- Environmental Innovation Information Organization, “Renewable energy — case studies at private facilities” (self-consumption solar and storage battery installations)
- Japan Tourism Agency, “Applications now open for the Accommodation Facility Sustainability Enhancement Support Project” (fiscal 2025)
- Japan Tourism Agency, “Application information 2026” (no fiscal 2026 round for the programme listed as of September 2026)
■ PPA and electricity tariffs
- Renewable Energy Institute, “Corporate PPA: Latest Trends in Japan, 2025 Edition” (March 2025)
- TEPCO Energy Partner, “Revisions to the standard extra-high and high voltage menus from 1 April 2026” and “Electricity Tariff Table (Extra-High and High Voltage)”
- TEPCO Energy Partner, “Renewable energy generation promotion surcharge” (fiscal 2026 rate of ¥4.18/kWh)
■ Weather and solar irradiance
Note on these calculations: the investment figures in this article are simplified calculations using assumptions drawn from publicly available materials, and do not guarantee investment outcomes at any particular property. Whether installation is feasible, at what capacity and at what construction cost varies widely with roof structural capacity, spare capacity in existing substation equipment, grid interconnection availability and regulatory restrictions. Subsidy requirements, unit amounts and application windows change from year to year, so check each implementing body’s latest application information before applying. An actual investment decision requires a detailed feasibility study.