

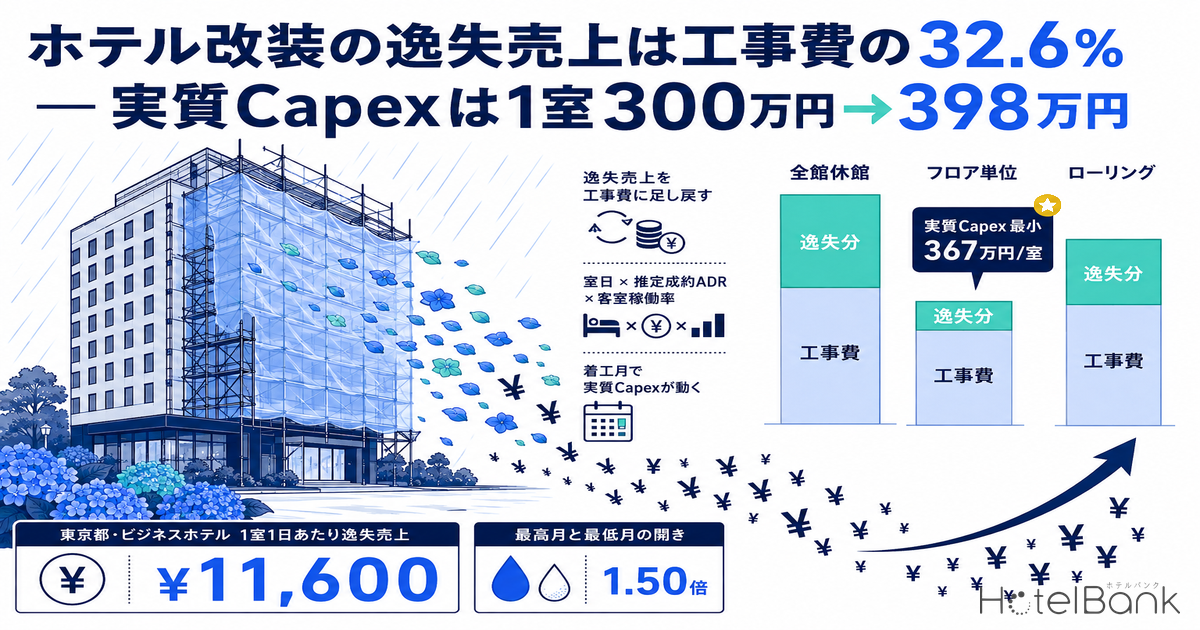
Guest-room renovation decisions usually start with a single number: the construction cost per room. In practice, though, what hits the party actually putting up the money is often not the construction cost itself but the rooms that could not be sold while the work was under way. Run the arithmetic on a 100-room model at ¥3.0m per room and, with a full closure, the lost revenue is equivalent to 32.6% of the construction cost — making the effective investment per room not ¥3.0m but roughly ¥3.98m.
This article counts the “room-nights” taken out of service under three approaches — full closure, floor-by-floor (wing) phasing, and rolling renovation — prices them by multiplying the area × category estimated settled ADR by the room occupancy rate, and adds the result back to the construction cost to recalculate effective capex per room. It then tests how much that figure moves depending on which month you start, and how far the post-renovation ADR uplift has to go before the payback period comes down to a workable number of years.
Metric Definitions Used in This Article
- ADR (average daily rate) = an estimated settled rate (tax-excluded equivalent), calculated by applying a category-specific adjustment factor to the lowest publicly listed plan level each property shows on OTAs (double occupancy, per-room rate, tax included). Cross-checked against property-level actuals disclosed by listed hotel REITs (91 properties, most recent three months), the median error is approximately 7%. These are estimates and differ from each property’s actual transacted rates and accounting figures. Area-level ADR is the median across the target properties (the level of a typical property in that area).
- Room occupancy rate (OCC) = the occupancy used in this article’s model is the prefecture-level, accommodation-type-level room occupancy rate from the Japan Tourism Agency’s Accommodation Travel Statistics Survey, calendar 2025 annual figures (final). The separately calculated estimated OCC we publish elsewhere — the share of sold rooms against total rooms in an area, estimated from OTA sales inventory — is not used here.
- Room-nights = rooms taken out of service × days out of service. Lost revenue = room-nights × (ADR × occupancy rate).
- Effective capex = construction cost + lost revenue. This article counts the loss on a contribution-margin basis (revenue less variable room costs).
- LT (lead time) = days remaining until the check-in date. LT0 = same day.
- Data sources = MetroEngines Research & Consulting / Japan Tourism Agency, Accommodation Travel Statistics Survey
- — 32.6% — In a 100-room model at ¥3.0m per room, lost revenue during a full closure (contribution-margin basis) is equivalent to 32.6% of the construction cost. Effective capex works out at roughly ¥3.98m per room.
- — ¥3.67m/room — Effective capex is minimised not by rolling renovation but by floor/wing phasing. The combination of 11.1% lost revenue and a 10% construction-cost premium is the best of the three.
- — ¥415k/room — The spread produced by the combination of method and start month. On a 120-day full closure the gap between the best and worst month is ¥203,400 per room; on a 300-day rolling programme it narrows to ¥15,700.
- — 3.07x — Lost revenue per room per day varies by a factor of 3.07 across prefectures (Tokyo ¥11,600 to Fukushima ¥3,800). How much effort a schedule deserves scales with that number.
- — DSCR 0.57 — Under a full closure, GOP in the construction year falls to 42% of a normal year; a property running at 1.35 in a normal year drops to 0.57. A principal-repayment holiday and exclusion from covenant testing become preconditions in the loan terms.
What we have covered on renovation cost so far — and the one line this article adds
We have looked at renovation spending from three angles already. One piece read the level of spending out of listed REITs’ IR disclosures, putting hotel capital expenditure at ¥134,000-¥624,000 per room per year. Another covered asbestos pre-surveys — the extra cost that lands before work starts — noting that 64.5% of Japan’s hotel rooms sit in buildings opened before 2006. A third dealt with how quickly rates ramp back up after an opening or a renovation, with new-hotel ADR recovery running at a median of two months.
All three are about construction cost and the effect it buys. What is missing is the gap in between: the rooms that could not be sold while the work was going on. Nothing records it in the accounts, but economically it is capital just as surely invested. This article puts a number on it and adds it back to the construction cost.
The three approaches — duration, cost premium and rooms out of service trade off against each other
In practice, guest-room renovation splits into roughly three approaches. The dividing axis is how many rooms you close at once, and that decides both the duration and the construction-cost premium.
Contractors’ published guidance puts partial guest-room work at a few weeks to a few months, floor-level or all-room work at several months to about half a year, and full renovation at six months to more than a year (EL Kensetsu). More granular benchmarks are also cited: one to one-and-a-half months per 10 rooms, and four to eight months for a whole-property renovation at the 50-room scale (Tenponaiso.com).
Phased work while the hotel keeps trading brings temporary protection and separated circulation routes, time-of-day restrictions on noisy operations, piecemeal material deliveries, and daily clear-down and reinstatement. The same sources put the construction-cost premium from phasing at roughly 10-20%. A full closure, by contrast, gives the highest work efficiency and carries no premium. Those are the figures used as parameters for each approach below.
| Approach | Rooms closed at once | Duration | Cost premium | Impact on trading and where it fits |
|---|---|---|---|---|
| A. Full closure | 100 rooms | 4 months (120 days) | ±0% | Revenue is zero. Work efficiency is highest and the programme is shortest. Makes sense where structural or main building-services upgrades are involved, where public areas are being fully reworked, or in segments where occupancy is low to begin with |
| B. Floor / wing phasing | 25 rooms (1 floor) | 6 months (180 days) | +10% | Closing a whole floor makes it easy to cut circulation at the lift lobby. The remaining 75 rooms keep trading; suits urban properties with guest rooms split across floors |
| C. Rolling | 10 rooms | 10 months (300 days) | +20% | Fewest rooms closed, so revenue holds up best. But the number of set-up changes is high and the programme is longest. Noise management for adjacent rooms is the most demanding |
What stands out is that the total volume of rooms taken out of service differs fourfold by approach. Approach A is 100 rooms × 120 days = 12,000 room-nights; approach B is 25 rooms × 180 days = 4,500 room-nights; approach C is 10 rooms × 300 days = 3,000 room-nights. Under a full closure, rooms stay out of service even during periods when no work is actually happening in them, so room-nights swell structurally. That gap becomes money in the next section.
How to measure lost revenue — room-nights × (estimated settled ADR × occupancy) turns one room-day into money
The procedure is three steps. First, take monthly estimated settled ADR for the target area × category. This article uses Tokyo business hotels (N=910 properties, 12 finalised months from August 2025 to July 2026). Second, take the room occupancy rate for the same area × category. Per the Japan Tourism Agency’s Accommodation Travel Statistics Survey, calendar 2025 annual figures (final), Tokyo business hotels run at 81.5%. The underlying logic of how ADR and occupancy combine into revenue per room is set out, with levels by category, in What Is RevPAR? ADR x Occupancy, and Why GOP Splits 1.81x in 2026. Third, multiply the two to get lost revenue per room per day, then multiply by the room-nights taken out.
The annual average estimated settled ADR for Tokyo business hotels is ¥14,300; multiplied by 81.5%, lost revenue per room per day comes to ¥11,600. That figure swings widely by month, however.
On a monthly basis, April is the highest at ¥435,300 per room and June the lowest at ¥290,700 — a spread of 1.50x. Across all 100 rooms, that difference is worth roughly ¥14.46m a month. Shifting the programme by a single month moves more than ¥14m.
One further distinction matters in practice: lost revenue is not lost profit. When a room goes out of service, the variable room costs disappear with it — cleaning, linen, amenities, channel commissions, payment fees. What should be added back for an investment decision is therefore the contribution margin (revenue less variable room costs), and this article assumes a contribution margin of 70%. All effective capex figures below are on that basis, with revenue-basis figures shown alongside.
How much it hurts to close a room varies more than twofold by category
Lost revenue per room per day is not set by ADR alone. Categories with low occupancy are closing rooms that were not selling anyway, so the pain is smaller. Lining up four area × category combinations makes the structure clear.
| Area × category | Annual avg. estimated settled ADR | Occupancy | Lost revenue per room-day | Per room, annual | N (properties) |
|---|---|---|---|---|---|
| Tokyo, city hotels | ¥27,900 | 74.1% | ¥20,700 | ¥7,547,000 | 107 |
| Tokyo, business hotels | ¥14,300 | 81.5% | ¥11,600 | ¥4,246,000 | 910 |
| Hokkaido, resort hotels | ¥16,800 | 51.1% | ¥8,600 | ¥3,133,000 | 141 |
| Shizuoka, ryokan | ¥18,900 | 42.4% | ¥8,000 | ¥2,924,000 | 449 |
A Tokyo city hotel piles up 2.6x the lost revenue of a Shizuoka ryokan for every room-day closed. The ranking inverts despite the ryokan’s higher ADR because its occupancy, at 42.4%, is about half. This structure changes the conclusion on scheduling. Where occupancy is low, the relative disadvantage of a full closure shrinks, and the benefits — a shorter programme and no cost premium — are more likely to win out. Where occupancy runs in the 80s (Japan Tourism Agency, Accommodation Travel Statistics Survey, full-year 2025, final figures published July 2026), as in urban properties, the weight of the closed rooms drives the choice of method.
By prefecture — lost revenue per room-day spans a 3.07x range
Applying the same procedure to business hotels in all 47 prefectures, lost revenue per room per day runs from a high of ¥11,600 in Tokyo down to ¥3,800 in Fukushima, a 3.07x spread. The national median is ¥5,100 (Kumamoto). How much effort a renovation schedule deserves can reasonably be taken as proportional to this figure.
| Rank | Prefecture | ADR | Occupancy | Lost/room-day | N |
|---|---|---|---|---|---|
| 1 | Tokyo | ¥14,273 | 81.5% | ¥11,632 | 910 |
| 2 | Kyoto | ¥14,046 | 77.4% | ¥10,872 | 319 |
| 3 | Osaka | ¥10,386 | 82.9% | ¥8,610 | 497 |
| 4 | Fukuoka | ¥10,880 | 77.8% | ¥8,465 | 338 |
| 5 | Kanagawa | ¥9,261 | 80.5% | ¥7,455 | 210 |
| 6 | Okinawa | ¥8,839 | 77.2% | ¥6,824 | 194 |
| 7 | Hokkaido | ¥8,857 | 76.1% | ¥6,740 | 429 |
| 8 | Hyogo | ¥7,654 | 79.3% | ¥6,070 | 167 |
| 9 | Nara | ¥8,646 | 69.3% | ¥5,992 | 32 |
| 10 | Chiba | ¥8,094 | 73.5% | ¥5,949 | 162 |
| Rank | Prefecture | ADR | Occupancy | Lost/room-day | N |
|---|---|---|---|---|---|
| 43 | Ehime | ¥5,980 | 68.4% | ¥4,090 | 101 |
| 44 | Miyazaki | ¥6,331 | 63.8% | ¥4,039 | 86 |
| 45 | Wakayama | ¥6,238 | 62.7% | ¥3,911 | 71 |
| 46 | Tokushima | ¥5,746 | 66.4% | ¥3,815 | 74 |
| 47 | Fukushima | ¥6,187 | 61.3% | ¥3,793 | 155 |
A 100-room model — ¥3.0m per room in construction cost becomes ¥3.67m-¥4.06m in reality
Now combine the figures. The model is 100 rooms at a construction cost of ¥3.0m per room (¥300m in total), assuming a guest-room renovation that includes the bathroom. Contractors’ material puts business hotel guest-room work at ¥1.2m-¥2.0m per room for surface finishes only and ¥2.5m-¥4.0m where the bathroom is included, so ¥3.0m sits in the middle of that range. The area × category used is Tokyo business hotels (annual average estimated settled ADR ¥14,300; room occupancy 81.5%, Japan Tourism Agency, Accommodation Travel Statistics Survey, full-year 2025, final figures published July 2026).
| Approach | Room-nights | Construction cost | Lost revenue | Lost (contribution margin) | Effective capex | Per room | Lost / construction cost |
|---|---|---|---|---|---|---|---|
| A. Full closure | 12,000 | ¥300m | ¥139.7m | ¥97.8m | ¥397.8m | ¥3,977,700 | 32.6% |
| B. Floor / wing phasing lowest | 4,500 | ¥330m | ¥52.4m | ¥36.6m | ¥366.6m | ¥3,666,500 | 11.1% |
| C. Rolling | 3,000 | ¥360m | ¥34.9m | ¥24.4m | ¥384.4m | ¥3,844,300 | 6.8% |
Three conclusions follow. First, the lost revenue ranges from 6.8% to 32.6% of construction cost — a near fivefold difference by approach. Under a full closure, ¥97.8m on a contribution-margin basis (¥139.7m on a revenue basis) is added to the investment in a form that never appears in the books.
Second, effective capex is minimised by floor phasing, not rolling renovation. Rolling closes the fewest rooms and carries the smallest loss (6.8% of construction cost), but the 20% cost premium more than offsets it. Pile on too much construction cost in order to cut the loss and the total goes up instead. Floor phasing strikes the best balance between a 10% premium and an 11.1% loss, coming in about ¥310,000 per room below a full closure and about ¥180,000 below rolling.
Third, the spread produced by the combination of method and start month reaches ¥415,500 per room. The best case is floor phasing starting in May at ¥3,642,300; the worst is a full closure starting in February at ¥4,057,700 — a gap equal to 14% of the ¥3.0m construction cost. Across 100 rooms, that is ¥41.55m.
There are situations that call for approach A. The comparison above rests on the premise that only guest-room interiors are being updated and that the total volume of work is identical across the three approaches. Where structural reinforcement, renewal of electrical or water main services, or a simultaneous refresh of public areas and restaurants is involved, working around trading operations stretches the programme beyond expectations and the premium will not stay inside 10-20%. On top of that, at ryokan and resorts running in the 40s for occupancy (Japan Tourism Agency, Accommodation Travel Statistics Survey, full-year 2025, final figures published July 2026), the absolute lost revenue is less than half that of an urban property, so the disadvantage of a full closure shrinks markedly. Approach A is not an option to avoid; it is an option whose viable range is set by the level of lost revenue and the scope of work.
Payback sensitivity — stop at a 10% ADR uplift and the payback period runs into double digits
Now the effect side. Pre-renovation annual room revenue is 100 rooms × 365 days × 81.5% occupancy (full-year 2025, final figures published July 2026) × annual average estimated settled ADR, or ¥424.6m. Incremental revenue was calculated across nine combinations — ADR up 10%, 20% or 30%, and occupancy down 2pt, flat, or up 2pt — with a 70% profit flow-through on rate-led revenue growth to arrive at incremental GOP, against which effective capex was divided.
| Post-renovation change | Incremental GOP | Payback on construction cost only | Payback on effective capex (approach B) | Difference |
|---|---|---|---|---|
| ADR +10% / occupancy −2pt | ¥21.7m | 15.2 yrs | 16.9 yrs | +1.7 yrs |
| ADR +10% / occupancy flat | ¥29.7m | 11.1 yrs | 12.3 yrs | +1.2 yrs |
| ADR +10% / occupancy +2pt | ¥37.7m | 8.7 yrs | 9.7 yrs | +1.0 yrs |
| ADR +20% / occupancy −2pt | ¥50.7m | 6.5 yrs | 7.2 yrs | +0.7 yrs |
| ADR +20% / occupancy flat | ¥59.4m | 5.6 yrs | 6.2 yrs | +0.6 yrs |
| ADR +20% / occupancy +2pt | ¥68.2m | 4.8 yrs | 5.4 yrs | +0.5 yrs |
| ADR +30% / occupancy −2pt | ¥79.7m | 4.1 yrs | 4.6 yrs | +0.5 yrs |
| ADR +30% / occupancy flat | ¥89.2m | 3.7 yrs | 4.1 yrs | +0.4 yrs |
| ADR +30% / occupancy +2pt | ¥98.7m | 3.3 yrs | 3.7 yrs | +0.4 yrs |
Two things read out of this. One is that counting the loss extends the payback period by 0.4 to 1.7 years. The larger the effect, the smaller the difference; the weaker the effect, the wider it opens. In the scenario where ADR stops at +10%, payback runs into double digits and the loss adds another 1.0-1.7 years on top. In that territory, the question of whether to renovate at all comes second to verifying how many percent of ADR uplift the renovation can actually deliver.
The other is that once the ADR uplift passes +20%, the payback period drops sharply into the low single digits. At +10% it is 12.3 years, at +20% 6.2 years, at +30% 4.1 years. The value of a renovation is not linear in the uplift. The pivot is whether the room rate can cross a threshold into a different price band.
Scheduling — choosing which months to close moves ¥200,000 per room on its own
Once the approach is fixed, the next question is the start month. Running a full closure (100 rooms × 120 days) across 12 possible start months, effective capex moves from ¥3,854,400 per room (June start) to ¥4,057,700 (February start). That is a gap of ¥203,400, or ¥20.34m across 100 rooms.
For Tokyo business hotels, the best four-month consecutive window is a June start (June-September) and the worst a February start (February-May). Monthly lost revenue per room exceeds ¥370,000 in six months — March, April, May, October, November and December — and overlapping a four-month window with that band is costly. Conversely, June, July, September, January and February all come in below ¥320,000, making them candidates to schedule around.
How much the choice of start month matters, though, differs sharply by approach. On a 120-day full closure the best and worst months are ¥203,400 apart; on a 300-day rolling programme the gap is just ¥15,700. The longer the programme, the less possible it is to dodge the peak months, and the benefit of clustering work into the low season disappears. Optimising the start month is worth the effort only for the shorter approaches.
By what lead time does the decision to close have to be locked?
Settling the programme is pointless if it means moving bookings already on the books. Rebooking, covering rate differences and handling cancellations are all out-of-pocket costs that never appear in the construction budget. So how many days ahead does the decision have to be final? You can work backwards from how fast inventory sells down in the area.
Indexing remaining rooms at LT90 (90 days before check-in) to 100, the figure falls to 86 at LT60, 76 at LT45, 63 at LT30, 42 at LT14, 32 at LT7 and 17 on the day itself. In other words, by 30 days before check-in, roughly 40% of the inventory that existed 90 days out has already been taken. If a whole floor is to be closed, the programme has to be fixed and those 25 rooms taken off sale well before LT90 — in practice four to six months before work starts — so that no rebooking is triggered.
Before LT90, by contrast, inventory barely moves at all. Whether the renovation schedule can be locked six months ahead is precisely what determines whether extra out-of-pocket costs arise. Allowing for design, tendering and permitting lead times, deciding the approach and the month a year before the start of work is the realistic timeline.
Funding and accounting — DSCR in the construction year, and the repair-versus-capital-expenditure split
GOP in the construction year falls to 42-86% of normal
Revenue is not the only thing that drops during a renovation. DSCR (debt service coverage ratio — annual net income divided by annual principal and interest payments) is generally treated as needing 1.25-1.3 or above to clear loan underwriting, with anything below 1.0 meaning earnings cannot cover repayments (DSCR benchmark guide). Fall below that level in the construction year and the question of a covenant breach arises even where no actual default has occurred.
Setting the model’s annual GOP at 40% of room revenue (¥169.9m), GOP in the construction year moves as follows.
| Approach | Construction-year GOP | vs. normal year | Construction-year DSCR if normal-year DSCR is 1.35 | Implications for the funding plan |
|---|---|---|---|---|
| A. Full closure (4 months) | ¥72.1m | 42% | 0.57 | Because the whole hit lands in a single year, the level falls far below the line. A principal-repayment holiday, exclusion from covenant testing during the works, and a pre-agreed working-capital facility become preconditions in the loan terms |
| B. Floor / wing phasing (6 months) | ¥133.2m | 78% | 1.06 | Clears 1.0 but stays below the underwriting line. Designing the programme to straddle the fiscal year-end spreads it across two years and softens the single-year dip further |
| C. Rolling (10 months) | ¥145.4m | 86% | 1.16 | The shallowest single-year dip. But because the programme spans two fiscal years, the fact that both are affected needs explaining |
What is easily overlooked here is the fixed costs that do not stop when the hotel closes. Property and city planning taxes, fire insurance, loan interest, lease payments and permanent staff costs all continue through the works. The calculation above covers what shows up as a decline in GOP, but the actual dip can be deeper depending on how staff are handled during a closure — redeployment, leave allowances, or a temporary reduction in headcount. Anyone choosing a full closure needs to settle the treatment of payroll at the same time as the programme.
Repair expense versus capital expenditure — do not start from the formal tests
The tax treatment of renovation costs affects both cash flow and yield. Booked as a repair expense, the whole amount is deductible in the year of payment; treated as capital expenditure, it is depreciated over the useful life. Under National Tax Agency circulars, the determination runs in the following order.
| Stage | Test | Outcome |
|---|---|---|
| 1. Substance test | Does the outlay raise the value of the fixed asset or increase its durability? | If so, capital expenditure. This is the primary test |
| 2. Small-amount test | The amount for a single repair or improvement is under ¥200,000 | May be treated as a repair expense |
| 3. Cycle test | Work clearly carried out on a cycle of roughly three years or less, as evidenced by past practice | May be treated as a repair expense |
| 4. Formal test | Under ¥600,000, or no more than roughly 10% of the asset’s acquisition cost at the end of the prior period | May be treated as a repair expense |
| 5. Split election | Where the substance test is difficult to apply, the lesser of 30% of the outlay and 10% of the prior period-end acquisition cost may be treated as repair expense and the remainder as capital expenditure (subject to consistent application) | The 7:3 rule |
The practical trap is starting from the ¥200,000 and ¥600,000 formal tests. Unless the substance — increased value or durability — is assessed first and the formal tests applied afterwards, the treatment falls into a pattern commonly flagged as vulnerable to challenge. A full ¥3.0m-per-room guest-room renovation typically goes beyond refreshing the interior to renewing equipment, and as a rule tips towards capital expenditure. From there, the practical negotiation is over whether the portion equivalent to restoring the original condition can be carved out and allocated to repair expense.
Lost revenue, note, is not a tax-deductible cost. What went unsold during the renovation simply shows up as revenue that never materialised; it is neither capitalised as capex nor deducted. It should nonetheless go into the denominator of the investment decision — that is this article’s argument.
As construction costs rise, scheduling carries relatively more weight
The construction-cost environment cannot be ignored either. Based on the Ministry of Land, Infrastructure, Transport and Tourism’s construction starts statistics, hotel construction costs in 2025 averaged ¥1.952m per tsubo across all structural types — ¥2.405m for steel-frame and ¥2.026m for reinforced concrete — sharply up from ¥1.38m in 2022. Behind this are stubbornly high material prices and rising labour costs: the public works design labour unit price rose for a 13th consecutive year in fiscal 2025, up roughly 28% on 2020. The construction cost deflator stood at 130.9 as of August 2025, around 30% higher over ten years.
When construction costs rise, lost revenue carries relatively less weight. Re-run the same 100-room model at ¥4.0m per room and the loss under a full closure (¥97.8m on a contribution-margin basis) falls from 32.6% to 24.5% of construction cost. That said, a lower ratio does not mean a smaller absolute loss. The higher the construction cost, the longer the payback period, and the loss still sits on top of that extended horizon. If anything, this is the moment to ask how much of the increase in construction cost can be won back through scheduling. The ¥415,500 per room that moves with the optimisation of approach and start month is equal to 40% of the ¥1.0m increase from a ¥3.0m to a ¥4.0m per-room construction cost.
In summary — put “what went unsold during the works” into the denominator
The loss runs 6.8-32.6% of construction cost
In a 100-room model at ¥3.0m per room, counting the loss on a contribution-margin basis puts effective capex at ¥3.67m-¥3.98m per room — ¥3.82m-¥4.40m on a revenue basis. An investment decision that looks only at construction cost ignores that band.
The minimum is floor phasing, not rolling
The fewer rooms you close, the bigger the construction-cost premium. Floor phasing at 11.1% loss and a 10% premium comes in about ¥180,000 per room below rolling at 6.8% loss and a 20% premium. Look at only one side and you miss the optimum.
Start month matters most on short programmes
On a full closure, best and worst months are ¥203,400 per room apart. On rolling, the gap narrows to ¥15,700. The longer the programme, the less the peak months can be avoided. The order in which scheduling deserves effort is set by the approach.
For anyone reviewing a renovation plan, the checks come down to three. First, have room-nights been calculated from the duration and the number of rooms closed simultaneously? The name of an approach alone does not produce a figure. Second, are the ADR and occupancy used to price the loss the real levels for that area × category? Company-wide or annual averages miss the downside when the works land in a peak month. Third, is the construction-year DSCR presented on its own? A full-year plan figure alone leaves the covenant risk in the construction year invisible.
Seen from the side preparing the plan, filling in these three points up front shortens the negotiation with the funders. The starting point is to stop living with a situation where construction costs are tendered to several contractors while nobody prices the rooms taken out of service.
Related reading
- Japan’s Pre-1981 Hotel Stock: 236k Rooms, 19.1% — Retrofit or Rebuild
- What Is RevPAR? ADR x Occupancy, and Why GOP Splits 1.81x in 2026
References and Sources
■ Data sources
Estimated settled ADR is the monthly median at prefecture × accommodation-type level (12 finalised months, August 2025-July 2026; Tokyo business hotels N=910 properties). Room occupancy rates are prefecture-level, accommodation-type-level actuals from the Japan Tourism Agency’s Accommodation Travel Statistics Survey, calendar 2025 annual figures (final). Remaining inventory by lead time covers Tokyo business hotels for June 2026 check-ins (861 properties, 125,265 rooms in total). Benchmarks for duration, construction-cost premium and per-room renovation cost come from contractors’ published material.
■ Model assumptions
100 rooms, construction cost ¥3.0m per room (¥300m in total), assuming a guest-room renovation including the bathroom. Total volume of work is held identical across the three approaches, with only the difference in rooms worked on simultaneously flowing through to duration and construction-cost premium (approach B +10%, approach C +20%). The loss is counted on a contribution-margin basis (70% contribution margin), with revenue-basis figures shown alongside. Start month is the average of 12 possibilities. Annual GOP is 40% of room revenue, incremental GOP is incremental revenue × 70% flow-through, and the normal-year DSCR is assumed at 1.35.
■ Limitations and caveats
This is a simplified model calculation and does not indicate the profitability of any specific property or transaction. ADR is an estimate derived from publicly listed prices and differs from each property’s actual transacted rates and accounting figures. Construction-year DSCR is a simplified calculation applying the rate of GOP decline to a normal-year DSCR, and does not account for fixed costs and payroll that continue during a closure. Durations and premium rates are published benchmarks, and may be exceeded where structural reinforcement, renewal of main building services, or a simultaneous refresh of public areas is involved. Tax treatment varies with individual circumstances.
■ Market data
- MetroEngines Research & Consulting — estimated settled ADR (prefecture × accommodation type, 12 finalised months August 2025-July 2026); remaining inventory by lead time (Tokyo business hotels, June 2026 check-ins, 861 properties, 125,265 rooms)
■ Government statistics and public data
- Japan Tourism Agency, Accommodation Travel Statistics Survey, calendar 2025 annual figures (final) — prefecture-level and accommodation-type-level room occupancy rates (published 6 July 2026)
- Japan Tourism Agency, Accommodation Travel Statistics Survey (statistics index)
- National Tax Agency, “Capital Expenditure and Repair Expenses” (basic circular)
- Ministry of Land, Infrastructure, Transport and Tourism, Construction Starts Statistics Survey — hotel construction cost per tsubo
■ Benchmarks for construction, duration and cost
- EL Kensetsu, “Hotel renovation costs and durations explained” — duration benchmarks for partial, floor-level and full renovation
- Tenponaiso.com, “Interior fit-out cost benchmarks for hotels and ryokan” — renovation cost per room, duration per 10 rooms, 10-20% premium for phased work
- BuildApp News, “What is the construction cost deflator?” — 130.9 as of August 2025
- Causes of rising construction costs and the outlook — trend in public works design labour unit prices
■ Finance and lending
* The calculations in this article are simplified model estimates and do not guarantee the profitability of any specific property or transaction. Actual investment decisions require a property-specific feasibility study. Tax treatment varies with individual circumstances.