

When an owner weighs operating structures, the first question is what it costs to rent nothing but a brand and its reservation network. A franchise (FC) agreement lets the owner keep running the hotel while sourcing the flag, the loyalty program and the booking system from outside, capturing a brand’s demand-generating power without surrendering as much control as a management contract (MC) requires. The price, however, leaves the building every month as an ongoing percentage of room revenue. This article places the published ranges for initial fees and royalties alongside our own measurement of the ADR gap between chain-affiliated and independent hotels across 404 business hotels in 12 regional trade areas, and calculates the breakeven ADR lift at which those fees are earned back.
How this differs from our earlier coverage
Within our series on hotel operating structures, “A scoring framework for three management-contract proposals — breakeven GOP of 34.3% after fees” compared management contract (MC) proposals; “Three upfront levers that move hotel development IRR” covered upfront capital at the development stage; and “How much does a brand lift ADR in the same trade area” examined the brand rate effect in the urban full-service segment. This article takes as its subject the cost structure of the franchise model — keep operating the hotel yourself, rent only the brand and the reservation network — and what is new here is that it sets the brand’s rate effect and its cost side by side in the same table for business hotels in regional core cities.
Metric Definitions Used in This Article
- ADR (average daily rate) = an estimated settled rate (tax-exclusive equivalent) calculated by applying a category-specific adjustment coefficient to the lowest published plan level each property lists on OTAs and similar channels (double occupancy, per room, tax included). It is estimated from an ensemble of two major Japanese OTAs; cross-checked against property-level results disclosed by listed hotel REITs (91 properties, most recent three months), the median error is about 7%. These are estimates and differ from each property’s actual transacted prices and accounting figures. Area-level ADR is the median of the properties covered, that is, the level of a typical property in that area.
- Chain-affiliated hotels / independent hotels = properties for which membership of some chain or group could be confirmed are treated as chain-affiliated, and those for which it could not as independent. This classification rests on chain membership alone and does not distinguish contractual form, such as directly operated, franchised or management-contracted.
- ADR lift = median estimated settled ADR of chain-affiliated hotels divided by the median estimated settled ADR of independent hotels in the same trade area and category, minus one. It is an observed difference, not the causal effect of brand affiliation on its own (see “Assumptions and limits” below).
- Total fee load = the sum of recurring charges such as royalties, marketing contributions, reservation system fees and loyalty program contributions, expressed as a percentage of room revenue.
- Occupancy (OCC) = rooms sold as a share of total rooms in the area (an estimate based on OTA sales inventory). This article does not calculate occupancy for individual properties; the occupancy used in the modelling is the published figure from the Japan Tourism Agency’s Overnight Travel Statistics Survey.
- Data source = MetroEngines Research & Consulting. REIT results are from each company’s IR disclosures. Settled ADR disclosed by listed REITs is stated excluding consumption tax, and the estimated settled ADR in this article is likewise on a tax-exclusive-equivalent basis.
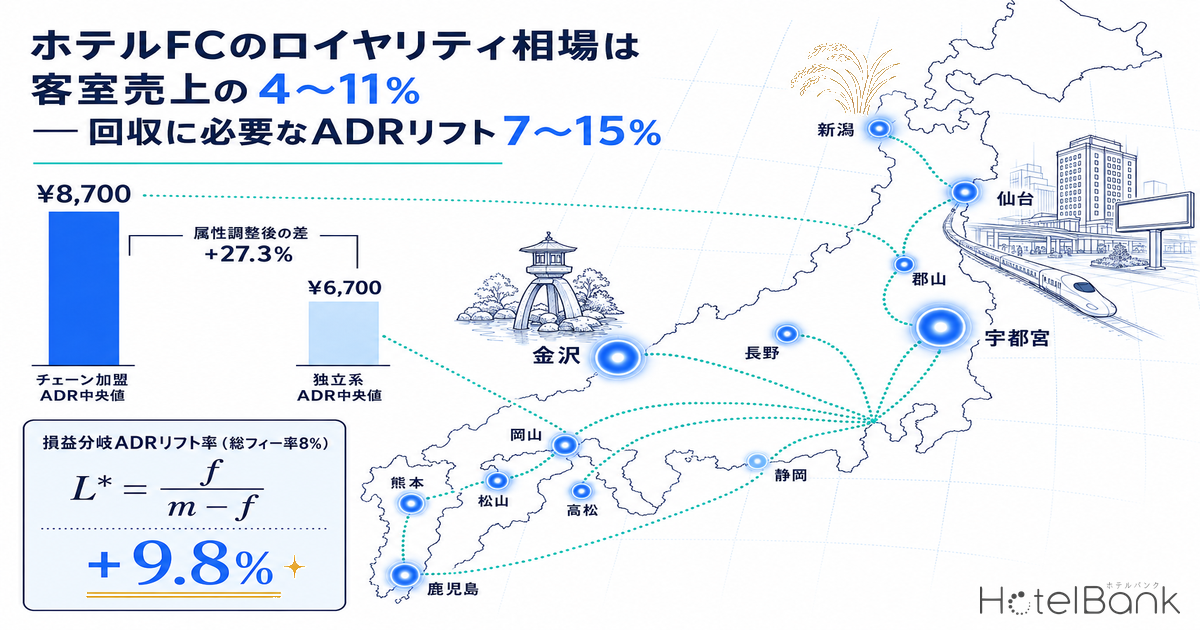
- — A total fee load of 4-11% in Japanese practice; for major U.S. brands it averages 10.8% over the first ten years after opening. On top of a 4-7% royalty, contributions for the loyalty program, advertising and the reservation system stack up.
- — The breakeven ADR lift is L* = f / (m – f). At an 8% total fee load and a 90% marginal margin, +9.8% is required; at 12%, +15.4%.
- — Across 404 properties in 12 regional trade areas, the measured gap in estimated settled ADR between chain-affiliated and independent hotels is +29.7% at the median and +27.3% after controls (95% CI +19.0 to +36.1%, N=403).
- — But the gap ranges from +2.3% (Shizuoka) to +46.3% (Utsunomiya). In trade areas where independents already command high rates, a standard fee schedule may never reach breakeven.
- — In a 120-room model, an ADR lift of +15% adds ¥9.5 million to annual GOP and recovers ¥72 million of upfront cost in 7.6 years. Initial affiliation fees are treated as deferred assets and amortized over five years in principle (National Tax Agency).
Conclusion — at 8% fees the breakeven is an ADR lift of +9.8%, and the measured gap is more than double that
The conclusion first. Recurring charges under a hotel franchise run, in Japanese practice, to 4-11% of revenue for royalties and marketing contributions combined; across major U.S. brands, aggregated by HVS, they average 10.8% of room revenue over the first ten years after opening. Call that total fee load f, and call m the marginal margin retained on the incremental room revenue (0.90 as this article’s base assumption). The ADR lift L* required to absorb the fees without reducing gross operating profit (GOP) is then L* = f / (m – f). At f=8% and m=0.90, L*=9.8%. If the load builds to f=12%, 15.4% is needed.
Against that, our measurement of estimated settled ADR for 404 business hotels across 12 regional core-city trade areas puts the median for chain-affiliated hotels at ¥8,700 and for independents at ¥6,700 — an observed gap of +29.7%. A regression controlling for room count, review score and trade area still leaves +27.3% (95% confidence interval +19.0 to +36.1%, N=403). In the regional business-hotel segment, in other words, the observed rate gap sits well above the breakeven point for a standard fee load of roughly 10%.
It would nevertheless be dangerous to drop that +27.3% into a business plan as the rate increase affiliation will deliver. Chain-affiliated hotels also differ systematically from independents in building age, fine-grained locational advantage and product specification, and the observed gap mixes in those contributions. Read the measured figure as a ceiling and put a conservative scenario in the plan — that is this article’s position. What follows breaks the fees into their components and then works through a 120-room model to the breakeven point and the payback period on upfront costs.
Cost side — recurring charges are a stack, not a line
The royalty alone may be 4-7%, but marketing contributions, loyalty program contributions and reservation system fees build on top of it, and the effective total fee load reaches double digits. Do not compare offers on the contract’s stated royalty percentage alone.
Revenue side — the measured gap of +27.3% is a ceiling
Measured across 404 properties in 12 regional trade areas. By trade area it ranges from +2.3% to +46.3%, and the gap narrows where chains are already dense. It is unusable without a check against the actual rates in your own trade area.
Review side — go as far as the payback period on upfront costs
Put the affiliation fee, system installation and brand-conformance renovation (PIP) at ¥600,000 per room, and an ADR lift of +15% takes 7.6 years to pay back, +20% takes 3.9 years. Clearing the breakeven on recurring fees is not yet the start of investment recovery.
What a franchise costs — the royalty percentage alone does not show the total
Start with the cost side. Payments under a hotel franchise divide into upfront amounts at signing and recurring charges during operation. Japanese practitioner guidance puts royalties plus marketing contributions at 4-11% of revenue. Compared with a management contract, where a base fee (3-5% of revenue) and an incentive fee (around 5% of GOP) combine to 8-15%, the franchise rate is the lighter of the two. That stands to reason: a management contract takes on the operation itself, whereas a franchise supplies a brand and a reservation network while the affiliate continues to run the floor.
The practical trap is that the “royalty of X%” written into the contract is not the total. HVS’s cross-brand survey of major U.S. brands finds that franchise-related costs average 10.8% of room revenue over the first ten years after opening, composed — in descending order — of royalties, loyalty program costs, marketing costs, sales and reservation costs, other items, and the initial affiliation fee. Looking at individual brands’ published levels, the royalty alone is roughly 4-7% of room revenue, and the remaining 3-5 points stack up separately as contributions to the loyalty program, advertising and the reservation system.
| Category | Item | Indicative level | Nature | Basis |
|---|---|---|---|---|
| Upfront | Affiliation fee (initial fee) | Scaled to room count, or a fixed amount | Lump sum at signing | Limited disclosure |
| Deposit and training fees | Quoted case by case | Lump sum at signing, partly refundable | Not disclosed | |
| Brand-conformance renovation (PIP), signage, system installation | Several hundred thousand yen per room | Capital expenditure | Our estimate | |
| Recurring | Royalty | 4-7% of room revenue | Percentage of revenue | Disclosed |
| Marketing / advertising contribution | 1-3.5% of room revenue | Percentage of revenue | Disclosed | |
| Loyalty program contribution | 1-3% of room revenue | Percentage of revenue, or of revenue booked through members | Disclosed | |
| Reservation system and IT fees | Fixed plus usage-based | Largely a fixed cost | Quoted case by case | |
| Total recurring charges (total fee load) | 4-11% (Japanese practice) 10.8% (U.S. 10-year average) | — | Disclosed | |
Source: MetroEngines Research & Consulting (compiled from company disclosures and the HVS U.S. Hotel Franchise Fee Guide)
One further point that review teams easily miss is the accounting and tax treatment of the upfront amount. In the National Tax Agency’s published Q&A, an initial affiliation fee paid to join a hotel chain has an effect extending beyond one year and therefore qualifies as a deferred asset, amortized over five years in principle. The affiliation fee is not, in other words, expensed in full in year one; it sits on the income statement for five years. When reviewing the fee assumptions in a business plan, it is necessary to look past the recurring percentage to how much this amortization subtracts from GOP over the five years after opening.
Measuring the revenue side — the rate gap between chain-affiliated and independent hotels across 404 properties in 12 regional trade areas
With the cost side established, we measure the revenue side. The population is business-hotel-category properties with 30 rooms or more, within a 2 km radius of the main station in each of 12 regional core-city trade areas: Sendai, Niigata, Kanazawa, Shizuoka, Okayama, Takamatsu, Kumamoto, Kagoshima, Nagano, Matsuyama, Utsunomiya and Koriyama. For each property we took monthly estimated settled ADR over the 12 months from September 2025 to August 2026, and analyzed the 404 properties with at least nine months of data. Of these, 284 are chain-affiliated (spanning 84 chains and groups) and 120 are independent. Nationally, 76.8% of lodging properties are independent yet they account for only 42.5% of rooms, so the larger the property the more likely it belongs to a chain.
The result: the median estimated settled ADR is ¥8,700 for chain-affiliated hotels and ¥6,700 for independents, an observed gap of +29.7%. As a sanity check on the level, Ichigo Hotel REIT Investment Corporation — whose portfolio is weighted toward regional business hotels — reported a July 2026 portfolio-wide ADR of ¥9,684 (occupancy 84.4%, RevPAR ¥8,175), so our estimated median for chain-affiliated hotels sits in a consistent range.
Source: MetroEngines Research & Consulting (N=404 properties)
| Trade area | Chain-affiliated N | Median ADR | Independent N | Median ADR | Observed gap |
|---|---|---|---|---|---|
| Utsunomiya | 19 | ¥7,710 | 11 | ¥5,271 | +46.3% |
| Kanazawa | 40 | ¥10,151 | 8 | ¥7,069 | +43.6% |
| Niigata | 19 | ¥7,198 | 15 | ¥5,383 | +33.7% |
| Takamatsu | 19 | ¥9,288 | 12 | ¥7,053 | +31.7% |
| Matsuyama | 13 | ¥7,699 | 11 | ¥6,301 | +22.2% |
| Okayama | 24 | ¥8,482 | 14 | ¥7,138 | +18.8% |
| Sendai | 60 | ¥9,801 | 6 | ¥8,376 | +17.0% |
| Kagoshima | 27 | ¥6,964 | 18 | ¥6,179 | +12.7% |
| Nagano | 17 | ¥9,698 | 7 | ¥8,706 | +11.4% |
| Shizuoka | 15 | ¥7,368 | 13 | ¥7,201 | +2.3% |
Source: MetroEngines Research & Consulting
By trade area the gap is wide, running from +2.3% in Shizuoka to +46.3% in Utsunomiya. Two regularities are visible. First, the gap widens where chain supply is relatively thin against lodging demand. Second, it narrows where independents themselves are well represented in the higher rate band — Shizuoka (independent median ¥7,201) and Nagano (¥8,706). In Shizuoka the independent median is almost level with chain-affiliated hotels (¥7,368), which tells us independents there are fully competitive on rate. The most practical implication of this table is that the premise “rent a brand and your rate goes up” does not necessarily hold in your own trade area.
Source: MetroEngines Research & Consulting
In an ordinary least squares estimation with the log of estimated settled ADR as the dependent variable and a chain-affiliation dummy, room count (log), overall review score and trade-area fixed effects as explanatory variables (N=403, R-squared 0.446), the coefficient on chain affiliation is +27.3% (95% confidence interval +19.0 to +36.1%, t-value +7.07). Room count and review score are each significantly positive as well, so rate is explained by a structure of three elements: brand, size and score.
| Room-count band | Chain-affiliated N | Median ADR | Independent N | Median ADR | Observed gap |
|---|---|---|---|---|---|
| 30-59 rooms | 21 | ¥7,532 | 35 | ¥6,190 | +21.7% |
| 60-99 rooms | 51 | ¥8,015 | 39 | ¥7,050 | +13.7% |
| 100-149 rooms | 58 | ¥9,459 | 26 | ¥6,898 | +37.1% |
| 150 rooms or more | 153 | ¥8,836 | 20 | ¥7,163 | +23.4% |
Source: MetroEngines Research & Consulting
Cutting by size band does not make the gap disappear. It is +21.7% in the small 30-59 room band, +37.1% in the 100-149 room band and +23.4% above 150 rooms — double digits in every band. The explanation that chain-affiliated hotels charge more simply because they are larger therefore fails to account for what we observe. Conversely, a gap that survives holding size constant is not in itself evidence of causation; that point is taken up under “Assumptions and limits” below.
The breakeven ADR lift — at an 8% total fee load the line sits at +9.8%
Now put the cost side and the revenue side on the same footing. Let R be room revenue before affiliation, f the total fee load, L the ADR lift, and assume occupancy is unchanged before and after. Room revenue after affiliation is R(1+L) and the fee payment is f·R(1+L). Of the incremental room revenue R·L, what remains is that amount multiplied by m, the marginal margin — the costs that vary are essentially OTA commissions, linen and amenities, so this article takes m=0.90 as its base assumption. The change in gross operating profit is then:
Setting ΔGOP = 0 gives
Breakeven ADR lift L* = f / (m − f)
What the formula shows is that the required lift is structurally a little larger than the total fee load. Because the fee is charged on the whole of revenue, not only on the increment, a lift equal to the fee percentage does not reach breakeven. At f=8% and m=0.90, L*=9.8%. If the load builds to f=12%, 15.4% is required.
A franchise does, however, bring an offsetting factor that never appears in the rate schedule: a higher direct-booking share through the brand’s loyalty program and its own reservation network. Suppose affiliation lowers the share of revenue coming through OTAs so that the commission burden on room revenue falls by 1.5 points — that much effectively offsets part of the fee. Writing this offset as c, breakeven becomes L* = (f − c) / (m + c − f). At f=8% and c=1.5 points, L* falls to 7.8%.
Source: MetroEngines Research & Consulting (calculation)
| Total fee load | No commission offset | Offset of 1.5 points | Offset of 3.0 points |
|---|---|---|---|
| 4% | 4.7% | 2.9% | 1.1% |
| 5% | 5.9% | 4.0% | 2.3% |
| 6% | 7.1% | 5.3% | 3.4% |
| 7% | 8.4% | 6.5% | 4.7% |
| 8% | 9.8% | 7.8% | 5.9% |
| 9% | 11.1% | 9.1% | 7.1% |
| 10% | 12.5% | 10.4% | 8.4% |
| 11% | 13.9% | 11.8% | 9.8% |
| 12% | 15.4% | 13.2% | 11.1% |
Source: MetroEngines Research & Consulting (calculation)
A 120-room model — at 8% fees and ADR +15%, GOP rises ¥9.5 million a year and upfront costs take 7.6 years to recover
Now turn the formula into a specific profit and loss. The model property matches the standard picture of an independent regional business hotel from the analysis above: 120 rooms, a pre-affiliation estimated settled ADR of ¥6,700 (our measured independent median), and occupancy of 75.3% (the Japan Tourism Agency’s Overnight Travel Statistics Survey, annual figure for January to December 2025, business hotels). Annual rooms sold come to 32,981, room revenue to about ¥221 million, and room revenue per room to about ¥1.84 million a year. The total fee load is set at 8% in the base case (the middle of the range in Table 1).
| ADR lift | ADR after affiliation | Room revenue | Revenue gain | Fees paid | Change in GOP | Years to recover upfront costs |
|---|---|---|---|---|---|---|
| +0.0% | ¥6,700 | 221.0 | +0.0 | 17.7 | -17.7 | — |
| +5.0% | ¥7,035 | 232.0 | +11.0 | 18.6 | -8.6 | — |
| +10.0% | ¥7,370 | 243.1 | +22.1 | 19.4 | +0.4 | 180.0 years |
| +15.0% | ¥7,705 | 254.1 | +33.1 | 20.3 | +9.5 | 7.6 years |
| +20.0% | ¥8,040 | 265.2 | +44.2 | 21.2 | +18.6 | 3.9 years |
| +27.3% | ¥8,529 | 281.3 | +60.3 | 22.5 | +31.8 | 2.3 years |
Source: MetroEngines Research & Consulting (calculation)
What this shows is unambiguous. Until the ADR lift reaches +10%, GOP barely moves. Stop at +5% and the year is ¥8.6 million in the red; with no lift at all, ¥17.7 million of fees comes straight out of profit. Secure +15%, on the other hand, and GOP rises ¥9.5 million a year, +20% gives ¥18.6 million, and the ¥72 million of upfront cost is recovered in 7.6 and 3.9 years respectively. At the measured ceiling of +27.3%, the gain is ¥31.8 million a year and payback takes 2.3 years.
The success of a franchise, then, turns not on whether to affiliate but on what lift you can capture in your own trade area. And as Table 2 shows, that lift swings from +2.3% to +46.3% depending on the trade area. Where independents already price close to chain-affiliated hotels, as in Shizuoka, a franchise on standard terms may not reach breakeven. Where the gap exceeds 40%, as in Utsunomiya or Kanazawa, substantial surplus remains after the fees are paid. How an individual property’s rate actually moves after a change of flag is a separate, property-level question, and one worth testing against comparable rebranding cases in your own market.
| ADR lift \ Total fee load | 4% | 6% | 8% | 10% | 12% |
|---|---|---|---|---|---|
| +5% | +0.7 | -4.0 | -8.6 | -13.3 | -17.9 |
| +10% | +10.2 | +5.3 | +0.4 | -4.4 | -9.3 |
| +15% | +19.7 | +14.6 | +9.5 | +4.4 | -0.7 |
| +20% | +29.2 | +23.9 | +18.6 | +13.3 | +8.0 |
| +27% | +42.5 | +36.9 | +31.2 | +25.6 | +20.0 |
Source: MetroEngines Research & Consulting (calculation)
Market context — when rate growth stalls, the fixed-cost side of the fees starts to bite
The calculations above rest on a static premise: that affiliation lifts ADR by one step and that the new level holds. In practice the market’s rate trend moves up and down. What matters here is the structure whereby the royalty is a percentage of revenue while reservation system fees and loyalty program contributions contain a strongly fixed-cost element.
In the monthly disclosures of listed hotel REITs, Ichigo Hotel REIT Investment Corporation, whose portfolio is weighted toward regional business hotels, reported July 2026 results of 84.4% occupancy (down 0.7 points year on year), ADR of ¥9,684 (down 0.8%) and RevPAR of ¥8,175 (down 1.6%) across the portfolio. Invincible Investment Corporation, which operates 101 domestic hotels, reported for the same month (as of July 2026) occupancy of 86.3% (up 1.9 points) against ADR of ¥15,100 (down 1.0%), with RevPAR growth held to +1.2%. Both sets of published figures point to a market where the upward phase in rate has paused and occupancy is doing the supporting work.
In that phase, a franchise breakeven premised on an ADR lift becomes relatively harder to clear. If market-wide rates are flat, the lift has to be earned purely as a brand-attributable difference. Put the other way round, for anyone reviewing the fee assumptions in a business plan, the point to check is whether market ADR growth has been folded into the lift. If a plan showing “ADR +15% from affiliation” in fact embeds an expectation of market-wide price increases, the fees will remain but the lift will not.
Assumptions and limits — do not carry the measured +27.3% straight into a plan
1. The observed gap is not a causal effect
Chain-affiliated hotels may also differ systematically from independents in building age, distance from the station and product specification. The regression controls for room count, review score and trade area, but not for building age or fine-grained locational conditions. Read +27.3% as the upper bound of what is attainable.
2. Contractual form is not identified
The classification here rests on whether a property belongs to a chain, without separating directly operated, franchised and management-contracted properties. The gap measured is therefore not “the effect of franchising” but the rate difference between properties that belong to a chain and those that do not, including the contribution of chains with a high share of directly operated hotels.
3. Part of the fee schedule is estimated
Royalties and marketing contributions use disclosed ranges, but affiliation fees, deposits and system fees are quoted case by case and not disclosed. The ¥600,000 per room of upfront cost in Tables 1 and 5 is our estimate and needs to be replaced with the terms actually offered.
4. Occupancy is held constant
Any occupancy gain from the brand’s reservation network is excluded from the calculations. Including it would shorten the payback, so the figures here lean conservative. Equally, the risk of losing existing customers on affiliation is not factored in either.
5. Contract term and territory
Where payback runs beyond seven years, the contract term (commonly 10 to 20 years), the early-termination provisions and the presence or absence of a territory clause restricting other affiliates in the same trade area all govern whether recovery is achievable. These deserve the same weight in review as the fee percentages.
6. The burden of five-year amortization
The initial affiliation fee is treated as a deferred asset and amortized over five years in principle (National Tax Agency Q&A). Because that amortization weighs on earnings for five years after opening, the cash-flow payback period and the accounting breakeven do not coincide.
Summary — whether the brand is worth renting can be checked against your own trade area
The price of renting a brand is 4-11% of room revenue in the Japanese practitioner range, and 10.8% as the ten-year average for major U.S. brands. Taking that as the total fee load f, the ADR lift at which the arrangement breaks even under a 90% marginal margin is f / (0.90 – f): +9.8% at 8% fees, +15.4% at 12%. If a higher direct-booking share lightens commissions by 1.5 points, the breakeven at 8% fees falls to +7.8%.
Against that, our measurement of 404 business hotels across 12 regional core-city trade areas puts the difference in estimated settled ADR between chain-affiliated and independent hotels at +29.7% on a median basis and +27.3% after controls — well above the breakeven point for a standard fee load. But the gap spans a wide range across trade areas, from +2.3% to +46.3%, and where independents already achieve high rates it may fall short of the breakeven point.
For an owner of a single property or a handful, the practical procedure comes down to three steps. First, restate the quoted percentages as the sum of all recurring charges (the total fee load), not the royalty alone. Second, measure the actual rate gap between chain-affiliated and independent hotels in your own trade area, in the same category and size band — Tables 2 and 3 above are a template for how to do that. Third, check whether that gap exceeds f / (0.90 – f), and if it does, set the payback period on the upfront cost against the contract term. The brand is available to rent. The question is whether your trade area will pay a rate that covers the rent.
References and sources
Data sources
Population = business-hotel-category properties with 30 rooms or more, within a 2 km radius of the main station, across 12 regional core-city trade areas (Sendai, Niigata, Kanazawa, Shizuoka, Okayama, Takamatsu, Kumamoto, Kagoshima, Nagano, Matsuyama, Utsunomiya and Koriyama). The analysis covers the 404 properties (284 chain-affiliated, 120 independent) with at least nine months of monthly estimated settled ADR between September 2025 and August 2026. Occupancy is the Japan Tourism Agency’s Overnight Travel Statistics Survey annual figure for 2025, REIT results are from each company’s monthly IR disclosures, and fee percentages are from company Form 10-K filings and HVS research.
Calculation assumptions
Breakeven ADR lift L* = f / (m – f), where f is the total fee load and m the marginal margin (m=0.90 here). Where a commission offset c is included, L* = (f – c) / (m + c – f). The 120-room model assumes occupancy of 75.3% (Japan Tourism Agency, Overnight Travel Statistics Survey, annual figure for January to December 2025, business hotels), a pre-affiliation ADR of ¥6,700, and occupancy unchanged before and after affiliation, with upfront costs set at ¥600,000 per room (¥50,000 affiliation fee plus ¥150,000 for systems and signage plus ¥400,000 for brand-conformance renovation). The gap after controls comes from an ordinary least squares estimation with the log of estimated settled ADR as the dependent variable and a chain-affiliation dummy, room count (log), overall review score and trade-area fixed effects as explanatory variables (N=403, R-squared 0.446).
Limitations and caveats
Estimated settled ADR is an estimate derived by applying category-specific adjustments to the lowest published plan level on OTAs, and differs from each property’s actual transacted prices and accounting figures. The +27.3% for chain affiliation is an observed difference, not a causal effect, and building age and fine-grained locational conditions are not controlled for (read it as an upper bound). The classification rests on chain membership alone and does not separate directly operated, franchised and management-contracted properties. Affiliation fees, deposits and system fees are quoted case by case and not disclosed, so the ¥600,000 per room of upfront cost is our estimate. Neither the occupancy gain from a brand’s reservation network nor the risk of losing existing customers on affiliation is included in the calculations.
Market data
- MetroEngines Research & Consulting — estimated settled ADR (404 business hotels across 12 regional trade areas, September 2025 to August 2026), chain master data, property attribute data
Government statistics and public documents
- Japan Tourism Agency, Overnight Travel Statistics Survey (2025 annual figures, final) — business hotel room occupancy 75.3% (January to December 2025)
- Japan Tourism Agency, Overnight Travel Statistics Survey
- National Tax Agency Q&A, “Initial affiliation fees paid on joining a hotel chain” — deferred asset, five-year amortization period
REIT monthly disclosures
- Ichigo Hotel REIT Investment Corporation, monthly operating results, July 2026 — portfolio-wide occupancy 84.4% / ADR ¥9,684 / RevPAR ¥8,175
- Invincible Investment Corporation, monthly operating results, July 2026 — 101 domestic hotels, occupancy 86.3% / ADR ¥15,100 / RevPAR ¥13,039
Industry material and fee levels
- HVS, U.S. Hotel Franchise Fee Guide — franchise-related costs average 10.8% of room revenue over the first ten years after opening
- Marriott International, Annual Report on Form 10-K (fiscal year ended December 2025) — ongoing royalties of 4-7% of room revenue, contract terms of 10 to 25 years
- Choice Hotels International, Annual Report on Form 10-K (fiscal year ended December 2025) — average U.S. franchise royalty rate of 5.14% (2025)
- Hilton Worldwide Holdings, Annual Report on Form 10-K (fiscal year ended December 2025) — discloses a charging structure in which royalties are proportional to room revenue and program fees are billed separately (the rates themselves are not disclosed)
- AQA, “What is a management contract (MC)?” — fee structures for management contracts, franchises and leases
- HOTEL SMART, “The four hotel operating models” — fee levels by operating structure in Japan
- Hotel and Ryokan Profit Improvement Project, “What is franchised hotel operation?”