

Some hotel and ryokan fire insurance policies will renew on different terms from October onward. In May 2026, one of Japan’s major non-life insurers was reported to be raising commercial fire insurance premiums by an average of about 1.2%, and personal-lines premiums by an average of about 3%, for policies starting on or after October 1. This article first checks in the primary sources which revision the frequently cited “+10.9% national average” actually refers to, then explains how revision rates diverge by building construction and building age. We then lay out the age profile of 22,555 properties and 1.31 million rooms in Japan by hotel type, and convert the premium increase into “yen per room-night sold” using room counts and occupancy. Finally, we summarize the steps that properties with renewals falling in or after October can take now.
Metric Definitions Used in This Article
- Advisory pure premium rate (参考純率): A reference value calculated by the General Insurance Rating Organization of Japan (GIROJ) and provided to member insurers for the part of the premium used to pay claims (the pure premium rate). All revision rates cited in this article relate to comprehensive homeowners’ insurance; they are not figures that apply as-is to the commercial (“general property”) fire insurance that hotels and ryokan buy. The rates insurers actually use are set by each insurer.
- Building-age bands (based on opening year): Years elapsed as of 2026 are calculated from the opening year recorded in the dataset and grouped into ≤10 years (opened 2016 or later) / 11–25 years (2001–2015) / 26–40 years (1986–2000) / 41+ years (1985 or earlier). This is not the building’s completion year. For ryokan, the founding year is sometimes recorded, which biases ages upward relative to the actual building age.
- OCC (room occupancy rate): Room occupancy rate by property type (national) from the Japan Tourism Agency’s Overnight Travel Statistics Survey, 2025 (January–December total, final figures). Our estimates use the published statistics as-is rather than MetroEngines estimates.
- Increase per room-night sold: Annual premium increase ÷ (rooms × 365 days × OCC). The premium increase spread over each room-night actually sold.
- Data sources: MetroEngines Research & Consulting / General Insurance Rating Organization of Japan / Japan Tourism Agency / Ichigo Hotel REIT Investment Corporation annual securities report
- — The “+10.9% national average” is the June 2021 advisory pure premium rate revision, which flowed into insurers’ premiums from October 2022. The October 2026 changes are individual insurers’ product revisions; according to press reports, commercial lines rise by an average of about 1.2% (ranging from up to +12% to −10% depending on the industry).
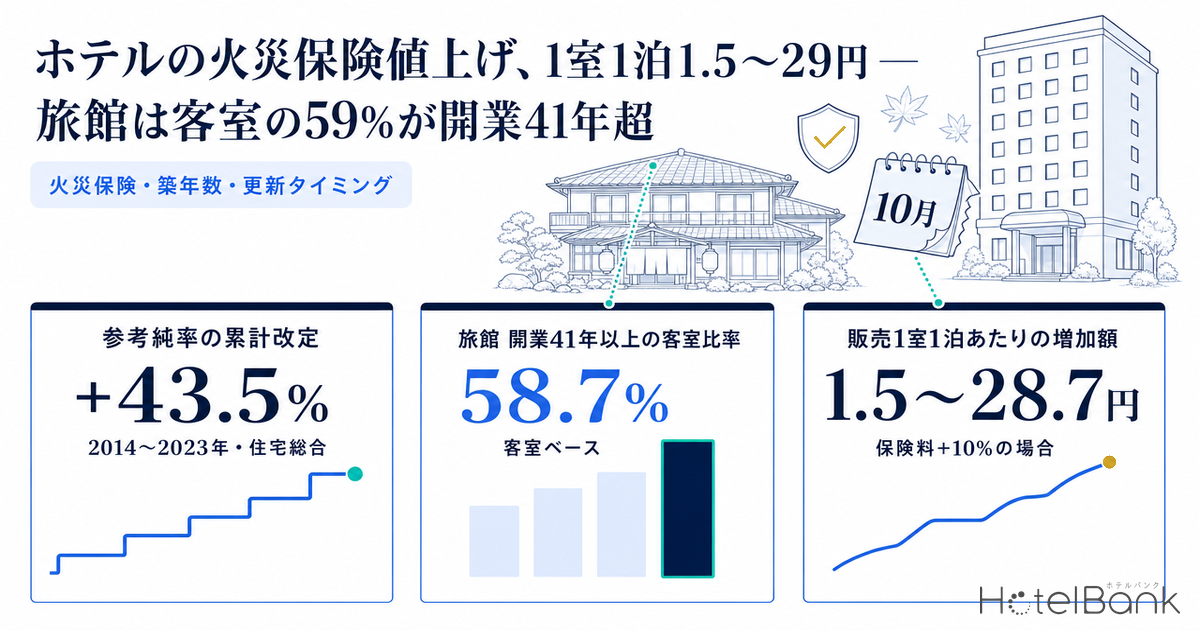
- — Compounding the five revisions to the homeowners’ advisory pure premium rate between 2014 and 2023 gives a cumulative +43.5% (our calculation). In the 2021 revision, the rate for buildings aged 10+ years in the three major metropolitan areas was 2.6–6.8pt higher than for buildings under 5 years old.
- — The share of rooms in properties opened 41+ years ago is 58.7% for ryokan, 30.2% for city hotels and 9.0% for business hotels. The age profile differs sharply by hotel type.
- — If premiums rise 10%, the increase per room-night sold is ¥1.5–28.7 (estimated at four levels of annual premium per room, ¥4,000–40,000). Because ryokan occupancy is low, the same premium costs a ryokan about twice as much per night as a business hotel.
- — Rate revisions apply to new and renewal policies starting on or after the revision date. Three months before renewal, check the sum insured, deductible, scope of cover and the documents that prove your construction class.
Conclusion — The Per-Night Cost of Rate Revisions Is Small; the Gap Widens with Building Age and Occupancy
The conclusion first. Spread over each room-night sold, a premium revision is a matter of a few yen to a few tens of yen. In the actual figures of a listed hotel REIT, the building insurance premium borne by the owner came to about ¥4,000 per room per year. Even if that rose 10%, it would amount to only ¥1.8 per night at the national average occupancy rate (61.6%).
The gap, however, widens along two axes. The first is building age. GIROJ’s advisory pure premium rates have given discounts to newer buildings and set higher revision rates for buildings aged 10 years or more. The second is occupancy. Premiums are incurred annually regardless of occupancy, so the lower a hotel type’s occupancy, the heavier the burden per night. Ryokan have 58.7% of their rooms in properties opened 41+ years ago, and their 2025 room occupancy rate was 38.2%. Both axes swing to the unfavorable side for this hotel type — which also means reviewing insurance terms is likely to pay off more.
One more point: revisions apply to policies starting on or after the revision date. In other words, “when the price goes up” differs by property and is determined by the renewal month. The second half of this article lays out steps starting from that renewal timing.
What Is Changing — “+10.9% National Average” Is the 2021 Advisory Rate; October 2026 Is Insurers’ Own Product Revisions
First, let’s confirm where the numbers come from. The “+10.9% national average” is the revision rate of the advisory pure premium rate for comprehensive homeowners’ insurance, which GIROJ filed with the Commissioner of the Financial Services Agency on May 21, 2021 and for which it received notice of the conformity review result on June 16 of the same year. The same revision shortened the maximum policy term to which the advisory rate can be applied from 10 years to 5 years. Insurers began reflecting it in premiums from October 2022.
GIROJ then filed the next revision on June 21, 2023 (notice received on the 28th of that month). It raised the homeowners’ advisory pure premium rate by 13.0% on the national average and split the flood rate, previously uniform nationwide, into five grades by municipality (Grade 1 to Grade 5, with a spread of about 1.2x); insurers reflected it in premiums from October 2024. As of September 2026, this June 2023 filing is the most recent fire insurance advisory rate revision filing that can be found on GIROJ’s website.
The October 2026 revision is a separate matter: individual insurers’ product revisions. According to press reports, Sompo Japan Insurance will raise personal fire insurance premiums by an average of about 3% and commercial premiums by an average of about 1.2% for new and renewal policies starting on or after October 1. Commercial lines are finely segmented by industry and facility risk, with increases of up to 12% for industries with high claim payouts and 10% cuts for low-risk facilities such as hospitals and offices. The cited background is inflation-driven increases in the cost of repairing buildings and equipment. MS&AD Holdings was also reported to be considering raising fire insurance premiums by about 5% in April 2027, in step with the merger of two of its subsidiaries.
| Filing / announcement | Entity | Details | Reflected in premiums |
|---|---|---|---|
| Oct 2019 | General Insurance Rating Organization of Japan | Advisory rate avg. +4.9%; discounts introduced for newer homes (under 5 years avg. 28%, 5 to under 10 years avg. 20%; building only) | At each insurer’s discretion |
| Jun 2021 | General Insurance Rating Organization of Japan | Advisory rate avg. +10.9%; maximum applicable policy term cut from 10 years to 5 years | From Oct 2022 |
| Jun 2023 | General Insurance Rating Organization of Japan | Advisory rate avg. +13.0%; flood rate split into 5 grades by municipality (spread about 1.2x) | From Oct 2024 |
| May 2026 (press reports) | Sompo Japan Insurance | Personal lines avg. about 3%, commercial avg. about 1.2% (by industry, from up to +12% to −10%) | Policies starting on or after Oct 1, 2026 |
| May 2026 (press reports) | MS&AD Holdings | Considering a fire insurance premium increase of about 5% | Apr 2027 (under consideration) |
The key point here is that the advisory pure premium rate is a reference value that insurers are not obliged to use. GIROJ itself states that whether to use it as-is, modify it, or not use it and calculate their own is up to each insurer. The loading rate covering business expenses is also set by each insurer. The commercial fire insurance that most hotels and ryokan buy is a separate product line from homeowners’ insurance in the first place, and its rate tables are not published. This article therefore uses the advisory rate as a benchmark for reading the direction of revisions and how differences arise by building age and construction, and does not forecast how much any individual property’s premium will rise.
How Revision Rates Diverge by Building Age — Discounts for Newer Buildings and a Premium for “10+ Years”
The advisory pure premium rate began differentiating by building age with the 2019 revision. Citing the fact that losses such as water damage are affected by building deterioration, so newer homes carry lower risk, GIROJ introduced discounts of an average 28% for buildings under 5 years old and an average 20% for those 5 to under 10 years old (building only). The 2021 revision also reflected this trend in the rates, stating that older homes generally carry higher risk of fire and water damage from aging electrical and plumbing systems, as well as damage from typhoons and heavy snow.
As a result, revision rates varied by building age even within the same prefecture and construction type. Comparing the three major metropolitan areas in the published 2021 examples (sum insured: ¥20M building, ¥10M contents), the revision rate for buildings aged 10+ years was 2.6–6.8pt higher than for buildings under 5 years. For H-structure (wooden, etc.) in Osaka, it was +24.6% for under 5 years versus +30.9% for 10+ years; for T-structure (steel-frame, etc.) in Tokyo, −0.6% versus +3.2%. Differences by construction are also large: even for 10+ year-old buildings in Osaka, the rate ranges from M-structure +21.5% and T-structure +22.4% to H-structure +30.9%.
The 2023 revision added differences by flood-risk grade on top of this. In the example for 10+ year-old T-structure buildings, the revision ranged from +5.2% to +26.8% in Tokyo and from +14.9% to +32.6% in Osaka — a spread of around 20pt by grade even within the same prefecture. Location-driven differences, such as how a hotel’s flood-risk grade can change its annual premium and feed through probable maximum loss (PML) into LTV and yields, are a separate subject; this article takes a different angle and focuses on building age and renewal timing.
For commercial properties such as hotels and ryokan, construction and building condition are likewise used to classify rates. In a construction-class scheme widely used for general properties, concrete and fire-resistant buildings are Class 1, steel-frame and quasi-fire-resistant buildings are Class 2 and all others are Class 3, with Class 1 carrying the lowest premium. And even a building that qualifies as Class 1 or 2 is treated as Class 3 if there are no documents proving it. The older the building, the more likely its as-built documents have been lost — a point that leads into the steps discussed later.
Age Profile of Japan’s Lodging Stock — 58.7% of Ryokan Rooms Opened 41+ Years Ago vs. 9.0% for Business Hotels
So how are Japan’s lodging properties distributed across age bands? From the properties tracked by MetroEngines Research, we took as the population the 27,000 properties and 1,387,604 rooms with observable selling prices in at least 10 of the last 12 months (September 2025 to August 2026), and aggregated the 22,555 properties and 1,314,711 rooms with a recorded opening year and room count (94.7% coverage on a room basis).
| Hotel type | Properties | Rooms | ≤10 yrs | 11–25 yrs | 26–40 yrs | 41+ yrs | Median opening year |
|---|---|---|---|---|---|---|---|
| Business hotels | 6,318 | 761,538 | 42.5% | 33.9% | 14.6% | 9.0% | 2010 |
| (property-count basis) | 40.8% | 30.5% | 17.3% | 11.3% | |||
| Resort hotels | 1,377 | 115,160 | 30.8% | 12.9% | 33.2% | 23.1% | 2009 |
| (property-count basis) | 41.0% | 18.2% | 23.2% | 17.6% | |||
| City hotels | 1,057 | 191,775 | 21.1% | 13.3% | 35.3% | 30.2% | 1993 |
| (property-count basis) | 19.1% | 14.9% | 35.3% | 30.7% | |||
| Ryokan | 4,885 | 132,430 | 10.5% | 14.8% | 16.0% | 58.7% | 1988 |
| (property-count basis) | 14.5% | 21.9% | 15.7% | 47.9% | |||
| Total (all types) | 22,555 | 1,314,711 | 35.7% | 25.6% | 19.8% | 18.8% | 2014 |
The differences by hotel type are clear. Business hotels have 42.5% of their rooms in properties opened within the last 10 years, and only 9.0% in properties opened 41+ years ago — the result of the wave of openings since the late 2010s rejuvenating the stock. Ryokan, by contrast, have 58.7% of their rooms in properties opened 41+ years ago, with a median opening year of 1988. City hotels are thickest in the 26–40 year band at 35.3%, with large hotels opened around 1990 forming their core.
Adding up rooms in properties opened 26+ years ago gives 74.7% for ryokan, 65.5% for city hotels, 56.3% for resort hotels and 23.6% for business hotels. Overall the figure is 38.7%, meaning roughly 2 in 5 rooms sit in buildings more than a quarter-century old. Given that the advisory rate uses “10+ years” as a key threshold, rooms exposed to age-based rate differences are concentrated in ryokan and city hotels.
One caveat. For some ryokan, the founding year rather than the building’s completion year is recorded as the opening year. Of the 4,885 ryokan in this dataset, 552 had an opening year of 1925 or earlier. Most of these have likely been rebuilt or extended, so the 41+ year band may be overstated relative to actual building age. Even so, buildings that have undergone repeated renovations and extensions have different ages in different parts, and still require case-by-case checks in insurance valuation. Note also that the data aggregated here does not include building construction type (RC, steel-frame, wooden, etc.), so no breakdown by construction was made.
Age Profile by Prefecture — Close to 60% of Rooms in Yamagata, Tottori, Niigata and Nagano Opened 26+ Years Ago
The age profile also varies by region. Looking at the share of rooms in properties opened 26+ years ago by prefecture, the top entries are Yamagata at 60.0%, Tottori at 58.8%, Niigata and Nagano at 58.0%, and Yamanashi at 57.1% — all prefectures with dense clusters of onsen ryokan or ski and highland resorts. At the other end, Kyoto (24.0%), Osaka (25.4%) and Okinawa (25.9%) are low: regions where new hotel supply continued alongside the growth in inbound demand after 2015.
| Prefecture | Properties | Rooms | 26+ yrs | 41+ yrs |
|---|---|---|---|---|
| Yamagata | 242 | 11,222 | 60.0% | 32.2% |
| Tottori | 169 | 8,371 | 58.8% | 33.2% |
| Niigata | 435 | 23,221 | 58.0% | 36.0% |
| Nagano | 1,101 | 33,610 | 58.0% | 31.0% |
| Yamanashi | 616 | 14,875 | 57.1% | 31.7% |
| … (see the map for mid-ranked prefectures) | ||||
| Gifu | 451 | 16,601 | 30.1% | 12.4% |
| Aichi | 543 | 54,528 | 29.4% | 12.6% |
| Okinawa | 1,296 | 51,184 | 25.9% | 10.2% |
| Osaka | 761 | 110,393 | 25.4% | 11.6% |
| Kyoto | 1,247 | 54,892 | 24.0% | 13.2% |
Prefectures shown in dark colors on the map hold many rooms that are exposed to age-based rate differences. They are also the regions with the most room to improve building condition through renovation and equipment upgrades. Considering insurance reviews together with equipment-upgrade plans can create situations where investment in disaster-prevention and fire-protection equipment is reflected in insurance terms.
Converting to Cost per Room-Night — Sensitivity Table of Revision Rate × Room Count
From here, we convert the premium increase into the units of a property’s P&L. First, let’s check a baseline premium level against published actual figures. According to the income statement notes for Ichigo Hotel REIT Investment Corporation (いちごホテルリート投資法人, 3463) for its 21st fiscal period (August 1, 2025 – January 31, 2026), insurance premiums within real estate leasing expenses were ¥9,210 thousand. The 30 properties held at period end had 4,626 rooms in total, which annualizes to about ¥4,000 per room per year.
This, however, is the premium borne by a REIT that owns the building. Hotel operators and ryokan that own their buildings typically insure equipment and fixtures, business interruption and premises liability in addition to the building, so their premium per room is higher. We therefore estimated at four levels of annual premium per room: ¥4,000, ¥10,000, ¥20,000 and ¥40,000.
■ Estimation Assumptions
Formula: Increase per room-night sold = annual premium per room × revision rate ÷ (365 days × OCC)Annual premium per room: ¥4,000 (Ichigo Hotel REIT’s 21st-period insurance premiums of ¥9,210 thousand, annualized and divided by 4,626 rooms across 30 properties at period end; building only) / ¥10,000, ¥20,000 and ¥40,000 (assumed values reflecting total coverage including equipment and fixtures, business interruption and liability)
Revision rate: 5%, 10% and 15% (a sensitivity range, not forecasts)
OCC: Japan Tourism Agency, Overnight Travel Statistics Survey, 2025 January–December total (final figures), national room occupancy — overall 61.6%, ryokan 38.2%, resort hotels 56.9%, business hotels 75.3%, city hotels 74.1%
Not assumed: Each insurer’s actual rates, discounts and phase-in measures; changes to the sum insured; whether earthquake insurance or earthquake extension cover is included. Actual premiums vary widely by policy terms.
Table 4 presents the “revision rate × room count” layout often requested for this topic, with an annual premium of ¥10,000 per room and occupancy at the national average of 61.6%.
| Revision rate | 100 rooms: annual increase | 200 rooms: annual increase | 300 rooms: annual increase | Per room-night sold |
|---|---|---|---|---|
| +5% | ¥50,000 | ¥100,000 | ¥150,000 | ¥2.2 |
| +10% | ¥100,000 | ¥200,000 | ¥300,000 | ¥4.4 |
| +15% | ¥150,000 | ¥300,000 | ¥450,000 | ¥6.7 |
Doubling or tripling the room count doubles or triples the annual increase, but the value per room-night sold stays the same regardless of room count. As long as premiums are roughly proportional to the sum insured, and the sum insured is roughly proportional to room count, what determines the per-night burden is not scale but two factors: the premium level per room and the occupancy rate.
Table 5 therefore fixes the revision rate at 10% and varies the annual premium per room and the occupancy rate by hotel type.
| Annual premium per room | Ryokan (OCC 38.2%) | Resort (56.9%) | City (74.1%) | Business (75.3%) | Overall (61.6%) |
|---|---|---|---|---|---|
| ¥4,000 (REIT building-insurance level) | 2.9 | 1.9 | 1.5 | 1.5 | 1.8 |
| ¥10,000 | 7.2 | 4.8 | 3.7 | 3.6 | 4.4 |
| ¥20,000 | 14.3 | 9.6 | 7.4 | 7.3 | 8.9 |
| ¥40,000 | 28.7 | 19.3 | 14.8 | 14.6 | 17.8 |
The range is ¥1.5 to ¥28.7. For the same premium, a ryokan at 38.2% occupancy (2025 January–December total) bears about twice the burden of a business hotel at 75.3%. For a ryokan with a 15% revision rate and a ¥40,000 annual premium per room, the figure rises to about ¥43. On the other hand, at a building-only premium level (¥4,000 per room per year), every hotel type stays below ¥3 per night.
The important way to read these numbers is that the design of the sum insured and coverage moves the per-night burden far more than the rate revision itself. The vertical range in Table 5 (premium level per room) spans 10x, the horizontal range (occupancy by hotel type) about 2x, and the gap between a 5% and a 15% revision rate is 3x. Getting the sum insured, the deductible and the choice of covers right can have an effect that more than outweighs differences in revision rates.
It is also worth watching for increases coming from the sum-insured side. According to MLIT’s Building Construction Starts Statistics, hotel construction costs (average across all structures) rose from about ¥1.38 million per tsubo (3.3㎡) in 2022 to about ¥1.95 million in 2024 — about 41% in two years. Under policies that value the building at replacement cost, premiums move with revaluation even if rates are unchanged. Leaving the valuation low keeps premiums down, but the claim payout in an incident may fall short of the rebuilding cost. It is sensible to check rate revisions and revaluation together at the same renewal.
Working Back from the Renewal Month — A Checklist for Properties Renewing from October
Rate revisions apply to new and renewal policies whose term starts on or after the revision date; policies already in force continue at the existing premium until expiry. The first task, therefore, is to confirm your policy’s renewal month and policy term. Then, checking the following items about three months before renewal widens your options in negotiating terms.
| Renewal timing | Likely applicable rates | Actions available now |
|---|---|---|
| By end of Sep 2026 | Each insurer’s pre-revision rates | Ahead of the next renewal, take stock of the sum insured (replacement cost) valuation and covered perils. Discuss with your agent, including the length of the policy term |
| Oct 2026 – Mar 2027 | Some policies will be on revised rates (varies by insurer) | Get quotes early, prepare documents on deductibles, scope of cover and construction class, then compare terms |
| Apr 2027 onward | Some insurers are considering further revisions (per press reports) | Consider multi-year policy terms and consolidating policies across multiple properties |
1. Align the sum insured and valuation method
Rising construction costs are moving replacement cost. After bringing the valuation in line with current conditions, check that the amounts insured for the building, equipment and fixtures, and business interruption each match reality. Over-insurance pushes up premiums; under-insurance erodes the payout in an incident.
2. Choose the deductible and scope of cover
If you have the cash on hand to absorb small losses yourself, raising the deductible is one way to hold down premiums. For covers such as flood, wind and accidental damage, design the policy to keep what is needed in light of the site’s hazards and past claims history.
3. Document construction and fire-protection equipment
Without supporting documents, a fire-resistant or quasi-fire-resistant building may be placed in a lower class. Gather and present the building confirmation certificate, completion inspection certificate, design drawings and the installation status of sprinklers and automatic fire alarm systems, and confirm that the appropriate class and discounts are being applied.
In addition, the total premium can vary with the payment method (lump sum or installments) and the length of the policy term. Treatment differs by insurer, so line up the differences in terms side by side at the quotation stage. Operators with multiple properties may also have room to revisit terms by consolidating policies. The floor-area thresholds that trigger mandatory sprinkler installation and the typical cost of statutory building inspections are also worth checking alongside the fire-protection documentation above.
Summary — Know Your Building Age and Occupancy, and an Insurance Review Becomes a Profit-Improvement Lever
The “+10.9% national average” is the 2021 advisory pure premium rate revision; what is scheduled for October 2026 is individual insurers’ product revisions. Per press reports, the average commercial revision rate is about 1.2%, but it ranges from up to +12% to −10% depending on industry and facility risk. Under this article’s assumptions, the increase per room-night sold if premiums rise 10% is ¥1.5–28.7.
What creates the gap in burden is building age and occupancy. Ryokan have 58.7% of their rooms in properties opened 41+ years ago and an occupancy rate of 38.2%, both of which push up the per-night burden. Conversely, this is also the hotel type where steps such as revaluation, deductible and cover design, and documentation of construction and fire-protection equipment are most likely to show results. Business hotels, with younger buildings and higher occupancy, are relatively less affected by the revisions.
Insurance premiums are a fixed cost incurred every year, and their terms can be revisited at every renewal. Starting from the renewal month and getting the three elements — valuation, cover and documentation — in order is the most reliable way to manage costs during a period of revisions. On the renovation-investment side of building age, see also our analysis of Japan’s pre-1981 hotel stock of 236,000 rooms and the retrofit-vs-rebuild decision, and how hotels fare at year 10 and when renovation pays off.
Frequently Asked Questions
Q. Will the fire insurance advisory pure premium rate rise by 10.9% on the national average in October 2026?
A. The +10.9% national average is the revision rate of the advisory pure premium rate for comprehensive homeowners’ insurance, for which the General Insurance Rating Organization of Japan received notice of the conformity review result in June 2021; insurers reflected it in premiums from October 2022. October 2026 brings individual insurers’ product revisions; press reports say Sompo Japan Insurance will raise commercial fire insurance premiums by an average of about 1.2%. GIROJ’s most recent fire insurance advisory rate revision filing was in June 2023 (+13.0% national average).
Q. Does the advisory pure premium rate apply directly to hotel and ryokan fire insurance?
A. No. The advisory rates cited in this article relate to homeowners’ insurance; rates for the commercial (“general property”) fire insurance that hotels and ryokan buy are set independently by each insurer. The advisory rate is best used as a guide to the direction of revisions and how differences arise by building age and construction.
Q. How much will a premium increase cost per night?
A. The increase per room-night sold is calculated as “annual premium per room × revision rate ÷ (365 days × occupancy rate).” Under this article’s assumptions (annual premium per room of ¥4,000–40,000, a 10% revision rate and JTA 2025 occupancy rates by hotel type), it came to ¥1.5–28.7. Room count does not affect the result; it is determined by the premium level per room and the occupancy rate.
Q. What can be done before renewal?
A. About three months before the renewal month, working on the sum insured (replacement cost) valuation, the design of deductibles and scope of cover, and the documents proving construction class and fire-protection equipment makes quotes easier to compare. Because rate revisions apply to policies starting on or after the revision date, the starting point is to confirm your own renewal month and policy term.
Related Articles
- Pre-1981 Seismic-Code Hotels: 236,000 Rooms, 19.1% of All Rooms — Retrofit or Rebuild?
- Hotels at Year 10 — Measuring When Renovation Pays Off with the 2016 Cohort
References and Sources
■ Data Sources
The age profile is based on MetroEngines Research & Consulting lodging data (of the 27,000 properties and 1,387,604 rooms with observable selling prices in at least 10 of the last 12 months, the 22,555 properties and 1,314,711 rooms with a recorded opening year and room count). Rate revisions are from GIROJ filing documents; room occupancy rates from the Japan Tourism Agency’s Overnight Travel Statistics Survey, 2025 January–December total (final figures); the per-room premium baseline from Ichigo Hotel REIT Investment Corporation’s annual securities report (21st period); and insurers’ revisions from October 2026 onward from press reports.
■ Estimation Assumptions
Increase per room-night sold = annual premium per room × revision rate ÷ (365 days × OCC). Annual premium per room is set at four levels — ¥4,000 (REIT actual, building only) and ¥10,000, ¥20,000 and ¥40,000 (assumed values reflecting total coverage) — and the revision rate at a sensitivity range of 5%, 10% and 15%; none are forecasts. Building-age bands are based on years elapsed from the opening year as of 2026.
■ Limitations and Notes
The advisory pure premium rate is a reference value for homeowners’ insurance; rates for hotels and ryokan (general property) are set independently by each insurer, so no revision rate for individual premiums is given. The opening year is not the building’s completion year, and for some ryokan the founding year is recorded, so the 41+ year band may be overstated. No breakdown by construction type was made. Insurers’ discounts and phase-in measures, earthquake insurance and changes to the sum insured are not included in the estimates.
■ Market Data
- MetroEngines Research & Consulting — Opening year, room count and type of lodging properties (N=22,555 properties, 1,314,711 rooms, opening-year basis)
■ Rates and Regulations (Primary Sources)
- General Insurance Rating Organization of Japan, “Fire Insurance Advisory Pure Premium Rates” (Japanese)
- GIROJ, “Notice of Revision of Fire Insurance Advisory Pure Premium Rates” (June 16, 2021; Japanese)
- GIROJ, “Notice of Revision of Fire Insurance Advisory Pure Premium Rates” (June 28, 2023; Japanese)
- GIROJ, “Notice of Revision of Fire Insurance Advisory Pure Premium Rates” (October 2019; Japanese)
- The General Insurance Association of Japan, “Non-Life Insurance Q&A No. 58: Fire Insurance (Construction Class)” (Japanese)
- Hoken Ichiba, “Do Fire Insurance Premiums Change by Construction Class?” (Japanese)
■ Government Statistics and Public Data
- Japan Tourism Agency, “Overnight Travel Statistics Survey,” 2025 January–December (annual final figures), Table 8 (Japanese)
- Ministry of Land, Infrastructure, Transport and Tourism, “Building Construction Starts Statistics” (estimated construction cost and floor area of lodging buildings)
■ REIT Disclosures
■ News Reports
- Sompo Japan to raise personal fire insurance premiums 3% in October on rising costs, first increase in two years (Nikkei, May 2026; Japanese)
- Sompo Japan raises fire insurance premiums to address inflation; MS&AD also considering (Jiji Press, May 28, 2026; Japanese)
- MS&AD considering premium increases, auto insurance up 6% in April 2027 (Kyodo News, May 2026; Japanese)
- Tokio Marine & Nichido, Mitsui Sumitomo Insurance and two others to raise fire insurance premiums by around 10% from October (Nikkei, May 2024; Japanese)