

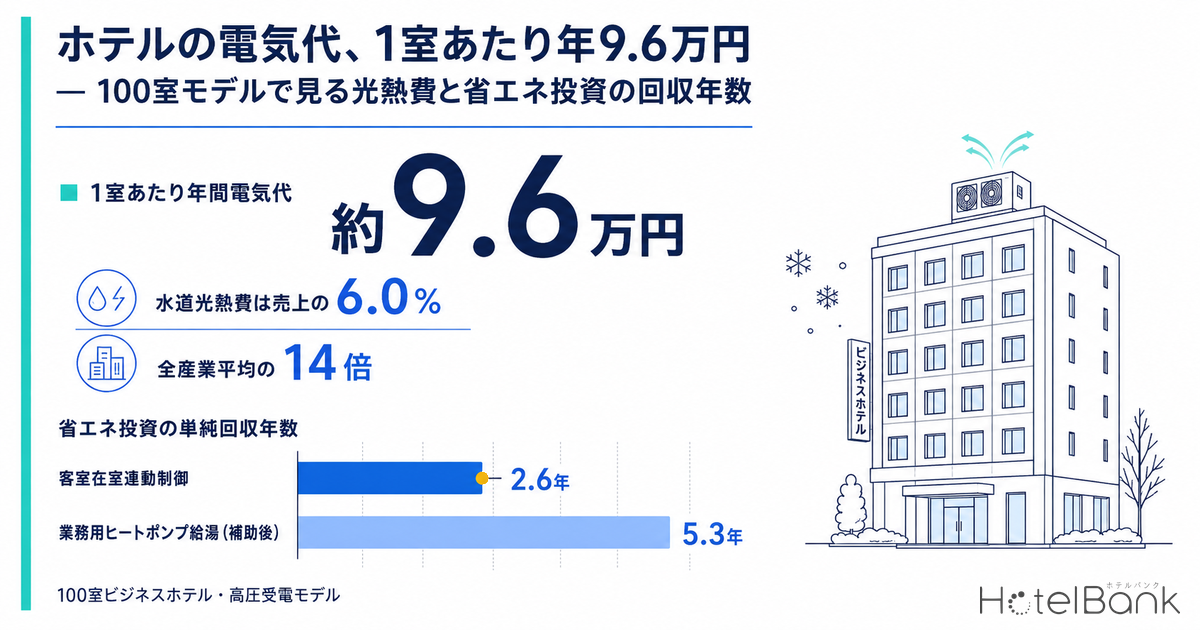
Among the cost lines in hotel operations, energy is second only to labor in weight, and it is also the one where an operator’s own efforts can most change the underlying structure. Utilities (water, electricity and fuel) account for 6.0% of sales in the accommodation industry, roughly 14 times the all-industry average (Small and Medium Enterprise Agency, “Basic Survey of Small and Medium Enterprises”). This article focuses on electricity, city gas, LPG and heavy oil. Using a 100-room model property, it builds up the annual bill from primary sources, then works through seasonality, government rate-relief programs, room for passing costs on to room rates, and the payback period of energy-efficiency investments.
Metric Definitions Used in This Article
- ADR (Average Daily Rate): An estimated settled rate (tax-exclusive equivalent), calculated by applying segment-specific adjustment factors to the lowest-priced plan each property publishes on OTAs and other channels (per room, two guests, tax-inclusive). Checked against property-level results disclosed by listed hotel REITs (91 properties, most recent three months), the median error is about 7%. These are estimates and differ from each property’s actual settled rates and accounting figures. Area-level ADR is the median of the properties covered (the level of a typical property in the area).
- Occupancy (OCC): This article uses the room occupancy rates published in the Japan Tourism Agency’s “Overnight Travel Statistics Survey.” These are not MetroEngines estimates.
- Energy conversion: Electricity is converted to heat value using the Energy Conservation Act factor of 9.76 GJ per 1,000 kWh, and city gas (13A) at 45 MJ per cubic meter.
- Data sources: MetroEngines Research (ADR) and the public statistics cited in the text.
- — ¥96,000 per room per year: the annual electricity bill of a 100-room business hotel (high-voltage supply, no large communal bath). Adding city gas brings utilities to ¥159,000 per room, or ¥15.87 million for the whole property.
- — 6.0% of sales goes to utilities, about 14 times the all-industry average of 0.41%. This is not because hotels use unusually much energy per square meter, but because of the business structure: large floor areas are temperature- and hot-water-controlled around the clock, while the sales they generate are relatively small.
- — 30.3% of the annual bill falls in December–February, more than 20% heavier than an even 25.0% split, and in the months when occupancy is lowest. When costs swell, the fewest rooms are sold to absorb them.
- — High-voltage relief is about half of low-voltage. The electricity and gas rate-relief discount is ¥4.5/kWh for low-voltage but ¥2.3/kWh for high-voltage. Nearly all 100-room-class hotels take high-voltage supply, and LPG, heavy oil and kerosene are not covered at all.
- — Payback of 2.6–5.3 years. Occupancy-linked guestroom controls 2.6 years, LED retrofit 3.0 years, high-efficiency HVAC (incremental cost at replacement, after subsidy) 3.1 years, commercial heat-pump water heating (after subsidy) 5.3 years. Against the 4.6% annual difference made by rate relief, the impact of structural measures is an order of magnitude larger.
Utilities Are 6.0% of Hotel Sales — 14 Times the All-Industry Average
As a starting point, let us establish from public statistics how energy-intensive the accommodation industry is. In the Small and Medium Enterprise Agency’s “Basic Survey of Small and Medium Enterprises” (incorporated businesses), utilities within SG&A as a share of sales were 6.68% in FY2014, 6.57% in FY2015 and 6.02% in FY2016 for accommodation. In the same survey, the all-industry total was 0.41–0.47%, restaurants 4.19–4.69%, and laundry, barber, beauty and bathhouse businesses 2.45–3.46%. Accommodation sits at roughly 14 times the all-industry average. By contrast, among fixed costs, water and sewer charges differ by as much as 2.1x between municipalities, so regional variation shows up differently than it does for energy.
Energy alone shows the same pattern. According to the Agency for Natural Resources and Energy’s “Energy Consumption Statistics Survey” (FY2016), the accommodation industry’s energy intensity per sales was 18.34 GJ per ¥1 million, about seven times the cross-industry average of 2.61 GJ per ¥1 million. Per establishment it was 2,962 GJ a year, and per floor area 1.18 GJ per square meter per year. The telling point is that while intensity per sales is exceptionally high, intensity per floor area is almost identical to the cross-industry average (1.17 GJ). In other words, the heavy energy burden in hospitality stems less from “using too much” than from a business structure in which large floor areas are temperature- and hot-water-controlled 24 hours a day, while the sales they can generate are relatively small.
| Industry | Utilities / sales FY2016 |
Energy intensity GJ per ¥1 million |
Energy intensity GJ per m² |
|---|---|---|---|
| Accommodation | 6.02% | 18.34 | 1.18 |
| Restaurants | 4.19% | 9.51 | 2.95 |
| Laundry, barber, beauty & bathhouses | 2.45% | 4.49 | 1.57 |
| Medical services | — | 3.86 | 1.12 |
| General merchandise retail | — | 0.90 | 1.60 |
| All industries (average) | 0.41% | 2.61 | 1.17 |
Source: Compiled by HotelBank Editorial Team from Small and Medium Enterprise Agency, “Basic Survey of Small and Medium Enterprises” (FY2016 final, incorporated businesses), and Agency for Natural Resources and Energy, “Energy Consumption Statistics Survey” (FY2016)
The breakdown by end use is also worth noting. Energy-saving materials by industry published by the Ministry of the Environment put the annual energy consumption of hotels at 31.0% hot water, 24.9% HVAC fans and pumps, 21.2% heating and cooling, 13.5% lighting and plug loads, and 9.4% other (source: Housing and Building Energy Conservation Handbook 2002, Institute for Building Environment and Energy Conservation). The same material states explicitly that “at resort hotels and onsen ryokan, hot-water consumption for large communal baths and pools is higher,” which underpins the difference between property types discussed below. The fact that hot water and HVAC together account for about 80% of the total points clearly to where intervention will pay off.
Annual Utility Bill of a 100-Room Model: ¥9.6M Electricity + ¥6.3M City Gas
Ratios alone are hard to relate to, so we set up a 100-room business hotel (no large communal bath, breakfast room only, high-voltage supply) as a model property and build up its annual electricity and city gas costs. The assumptions are shown in the table below: electricity intensity of 131 kWh per square meter of floor area per year, and total energy intensity, converted to heat value, of 1.87 GJ per square meter per year. This falls between the accommodation-industry average in ANRE’s “Energy Consumption Statistics Survey” (1.18 GJ) and the median primary energy intensity compiled by the Energy Conservation Center, Japan for 41 urban hotels (2,915–3,753 MJ per square meter per year depending on size), a reasonable setting for a limited-service hotel without banquet facilities or a large bath.
| Item | Model A 100-room business hotel |
Model B 100-room ryokan / resort with large bath |
|---|---|---|
| Gross floor area | 3,200 m² | 5,500 m² |
| Annual electricity use | 420,000 kWh (4,200 kWh per room) | 600,000 kWh (6,000 kWh per room) |
| Annual fuel use | City gas 42,000 m³ | 5,000 GJ (heat value) (incl. LPG, heavy oil, etc.) |
| Total energy | approx. 5,990 GJ/year (59.9 GJ per room) | approx. 10,860 GJ/year (108.6 GJ per room) |
| Annual electricity cost | approx. ¥9.57M approx. ¥96,000 per room | approx. ¥13.67M approx. ¥137,000 per room |
| Annual gas / fuel cost | approx. ¥6.30M | approx. ¥16.50M |
| Total | approx. ¥15.87M (approx. ¥159,000 per room) | approx. ¥30.17M (approx. ¥302,000 per room) |
| Occupancy (2025, Japan Tourism Agency) | 75.3% | 38.4% (ryokan) |
| Estimated settled ADR | ¥8,700 | ¥14,800 |
| Utilities per occupied room-night | approx. ¥577 | approx. ¥2,152 |
| Share of rooms revenue | 6.6% | 14.5% |
Source: MetroEngines Research (ADR); Japan Tourism Agency, “Overnight Travel Statistics Survey” (2025 annual, preliminary). Electricity rate uses the high-voltage average of ¥22.78/kWh (as of May 2026) published by Shin-Denryoku Net (Energy Information Center). Estimates by HotelBank Editorial Team
Electricity comes to about ¥9.57 million a year, or about ¥96,000 per room. Including city gas, utilities total about ¥15.87 million a year, or about ¥159,000 per room. The electricity rate is the average high-voltage rate of ¥22.78/kWh (as of May 2026, published by Shin-Denryoku Net), and city gas is set at a commercial rate of ¥150 per cubic meter. ADR uses our nationally weighted average of estimated settled ADR (business hotels ¥8,697, sum of monthly medians of properties covered N=7,380; ryokan ¥14,817, N=6,698 on the same basis; both August 2025–July 2026).
The resulting 6.6% ratio of utilities to rooms revenue is consistent with the FY2016 figure of 6.02% from the Basic Survey of Small and Medium Enterprises. Factoring in the rise in energy prices since FY2016, it is reasonable to assume the current reality is at this level or slightly above.
30% of Annual Utility Costs Fall in the Three Winter Months
More consequential for management than the annual total is the monthly skew. Building up Model A’s utility costs by month, December, January and February account for 30.3% of the year. An even split would be 25.0%, so the three winter months run more than 20% heavier than the average pace. January and February are also the months with the lowest occupancy of the year. According to the Japan Tourism Agency’s “Overnight Travel Statistics Survey,” overall occupancy in January 2026 was 53.1%, well below the 2025 annual average of 61.8%. In the months when costs swell the most, the fewest rooms are sold to absorb them, which is why energy costs weigh so readily on hotel profitability.
Source: HotelBank Editorial Team estimates (100-room business hotel, high-voltage supply model)
Let us also check seasonality against actual data. Monthly electricity consumption in the Ministry of Internal Affairs and Communications’ “Family Income and Expenditure Survey” (two-or-more-person households, national, meter-reading month basis) ranged in 2025 from a low of 314 kWh in June to a high of 525 kWh in March, a 1.67x spread. Kerosene is even more extreme: in 2025, 1 liter in August and September versus 27 liters in February, a spread of more than 20x. This is household-sector data, but the “shape” of how heating and hot-water demand spikes in winter is shared by the commercial sector, and hotel heat loads follow the same seasonal wave. Materials from the Energy Conservation Center, Japan analyzing hotel energy consumption also note that hot-water load peaks around 10 p.m. and characteristically follows a twin-peak pattern of evening and morning.
Source: Compiled by HotelBank Editorial Team from Ministry of Internal Affairs and Communications, “Family Income and Expenditure Survey” (two-or-more-person households, national, electricity consumption)
A Large Bath Makes a 3.5x Difference per Occupied Room-Night
The gap between property types is even larger. For Model B (a 100-room ryokan or resort with a large communal bath), annual energy per room is 108.6 GJ, 1.81 times Model A’s 59.9 GJ. However, recalculated per occupied room-night, the gap widens to 3.55 times. That is because, on the Japan Tourism Agency’s 2025 annual figures, ryokan occupancy was 38.4% against 75.3% for business hotels, nearly a twofold difference. Much of the load, such as heating and circulating bath water, heating the building and running the kitchen, occurs regardless of guest numbers, so the lower the occupancy, the heavier the unit cost per occupied room-night. In yen terms, Model A’s utilities per occupied room-night are about ¥577, compared with about ¥2,152 for Model B.
| Property type | Occupancy 2025 |
2024 | YoY change |
|---|---|---|---|
| All | 61.8% | 59.6% | +2.2pt |
| Business hotels | 75.3% | 73.7% | +1.6pt |
| City hotels | 74.2% | 72.3% | +1.9pt |
| Resort hotels | 56.9% | 54.1% | +2.8pt |
| Ryokan | 38.4% | 36.1% | +2.3pt |
| Simple lodging (hostels etc.) | 29.6% | 29.0% | +0.6pt |
Source: Japan Tourism Agency, “Overnight Travel Statistics Survey,” January–December 2025 (annual, preliminary)
The hot-water load of a large bath can be estimated physically. If baths with a total volume of 20 cubic meters are fully refilled every day and heated to 42°C, each refill requires about 1,842 MJ with a 20°C supply-water temperature (summer assumption) and about 2,846 MJ at 8°C (winter assumption). The same volume of water needs 1.55 times more heat in winter than in summer. Over a year, refills alone come to about 856 GJ, or about 1,007 GJ assuming 85% boiler efficiency, equivalent to roughly 10% of Model B’s total energy. On top of that come heat losses from 24-hour circulation heating and shower use. A bath is central to attracting guests, and the point is not to scale it back. Rather, the practical takeaway is that because this is the largest heat demand, improving the efficiency of the heat source here has the largest effect.
Electricity and Gas Rate Relief: High-Voltage Gets About Half, October Onward Not Yet Announced
Now to the policy side. Based on the “Comprehensive Economic Measures to Realize a ‘Strong Economy'” approved by the Cabinet on November 21, 2025, the Ministry of Economy, Trade and Industry (METI) provided electricity and gas rate relief for usage from January to March 2026 (total supplementary budget of ¥529.6 billion). Under special authorizations and approvals dated June 12, 2026, relief is also being provided for usage from July to September. The discount rates are shown below.
| Applicable period (usage) | Electricity (low-voltage) | Electricity (high-voltage) | City gas |
|---|---|---|---|
| January 2026 | ¥4.5/kWh | ¥2.3/kWh | ¥18.0/m³ |
| February 2026 | ¥4.5/kWh | ¥2.3/kWh | ¥18.0/m³ |
| March 2026 | ¥1.5/kWh | ¥0.8/kWh | ¥6.0/m³ |
| July 2026 | ¥3.5/kWh | ¥1.8/kWh | ¥14.0/m³ |
| August 2026 | ¥4.5/kWh | ¥2.3/kWh | ¥18.0/m³ |
| September 2026 | ¥3.5/kWh | ¥1.8/kWh | ¥14.0/m³ |
| October 2026 onward | Not announced as of writing (September 7, 2026) | ||
Source: METI, “Special authorizations and approvals allowing discounts on electricity and city gas rates in connection with rate relief for January, February and March 2026 usage” (December 16, 2025); same for “July, August and September 2026 usage” (June 12, 2026)
What hotel operators need to keep in mind is that 100-room-class hotels almost all take high-voltage supply, and their discount rate is only about half the low-voltage rate. The “¥4.5/kWh” figure seen in news reports and consumer explainers is the low-voltage rate (households and small businesses); high-voltage is ¥2.3/kWh. Applied to Model A’s 420,000 kWh a year, six months of electricity discounts would be about ¥830,000 at the low-voltage rate but only about ¥430,000 at the high-voltage rate, a 1.95x difference.
Scope is the other key point. The relief covers only electricity and city gas; LPG, heavy oil and kerosene are excluded. Ryokan and resort hotels in onsen areas not reached by city gas pipelines rely on LPG or heavy oil for most of their heat, so they receive almost no benefit. For Model B, the discount works out to only about 2.0% of utility costs, from electricity alone. Even under a program called “relief,” how much reaches a property varies widely by type and location.
Treatment from October 2026 onward had not been announced at the time of writing. We therefore estimated Model A’s utility costs for the 12 months from October 2026 to September 2027 under two scenarios.
| Scenario | Annual utility cost electricity + city gas |
Per room | Difference |
|---|---|---|---|
| 1. No relief No relief is provided from October 2026 onward | ¥15.87M | ¥159,000 | — |
| 2. Relief continues The same terms as Jan–Mar and Jul–Sep 2026 are repeated | ¥15.13M | ¥151,000 | −¥730,000 (−4.6%) |
Source: HotelBank Editorial Team estimates based on discount rates published by METI (100 rooms, high-voltage supply, 420,000 kWh electricity / 42,000 m³ city gas per year)
The difference is ¥730,000 a year, or ¥7,300 per room. That is by no means a trivial amount, but it is only 4.6% of total utility costs. The implication of the estimate is that rather than reacting to whether relief continues, using the relief period to change the cost structure has an impact that is an order of magnitude larger. This is covered in the sections that follow.
Passing Costs to Room Rates: Hotel Prices Have Outpaced Electricity — Kerosene Is the Exception
Let us put the growth of costs and prices side by side. Rebasing annual averages of the Ministry of Internal Affairs and Communications’ “Consumer Price Index (2025 base)” to 2019 = 100, as of 2026 (January–July average) hotel accommodation charges stand at 137.5, electricity 111.6, city gas 112.0, propane gas 119.9 and kerosene 149.8. Accommodation charges have risen far faster than electricity and city gas, suggesting that, at least for grid energy, the industry as a whole has passed costs through to room rates.
Source: Compiled by HotelBank Editorial Team from Ministry of Internal Affairs and Communications, “Consumer Price Index (2025 base),” national, annual averages (2026 is the January–July average)
Two caveats apply to this reading. First, kerosene, at 149.8, exceeds accommodation charges at 137.5. Propane, at 119.9, has also risen faster than electricity and city gas. The more a property depends on oil- or LPG-based heat, the less room-rate increases have kept pace. Importantly, these are the same properties identified in the previous section as poorly served by relief: properties in locations without city gas pipelines must design their rates under a double condition of faster cost increases and thinner support.
Second, the electricity CPI fell sharply from 101.7 to 88.5 in 2023. This was not because the underlying cost of power fell, but because the index reflects prices after the electricity and gas rate-relief discounts implemented intermittently since 2023. If relief is scaled back or ended, the index will step up again. In addition, the CPI for electricity covers residential (low-voltage) supply, which differs in both rate level and revision timing from the high-voltage supply typical of hotels. The index should be treated as an indicator of “direction” only.
Payback on Energy-Efficiency Investment: 2.6 Years for Occupancy-Linked Controls, 5.3 for Heat-Pump Water Heating
Now for the upside. First, the benchmark set by policy. Under the Energy Conservation Act benchmark system administered by the Agency for Natural Resources and Energy, the hotel business is designated as one of 19 covered industries and sectors. The indicator is “the hotel’s energy use divided by the average energy use of hotels of the same size, services and operating conditions,” and the target level is 0.723 or below, meaning operation with about 28% less energy than a typical comparable hotel is set as a medium- to long-term goal. In the FY2021 periodic reports, 35 of 165 businesses (21.2%) met the target, so the level already reached by the top 20% is explicitly set as the policy target. Put the other way, the remaining 80% have the kind of headroom the system envisages.
Actual reduction cases have also been published. Materials from the Energy Conservation Center, Japan describe a resort hotel that mapped where every lighting and HVAC switch was located and had staff agree who would operate them and when; compared with FY2004 before the initiative, it cut electricity use by 15% in FY2005 and by 30% in FY2007. A 30% cut from operational improvements alone, with no capital investment, sets the benchmark to check before making any investment decision. The same materials include a large hotel with 138,000 square meters of floor area that combined heat-shielding window film, downlight replacement and limits on outdoor-air intake for banquet-hall HVAC to reduce the building’s total energy use by 5% year on year.
On that basis, we estimated simple payback periods for the main capital investments using Model A. Reduction rates are planning-stage assumptions; actual results vary with the age of existing equipment, operating hours and location.
Source: HotelBank Editorial Team estimates (100-room business hotel, high-voltage supply model; electricity ¥22.78/kWh, city gas ¥150/m³)
| Measure | Assumptions | Investment | Annual savings | Payback |
|---|---|---|---|---|
| Occupancy-linked guestroom controls | Key-card and motion-sensor interlocks curb HVAC and lighting while guests are out. 15% cut in guestroom electricity; ¥15,000 × 100 rooms | ¥1.5M | ¥570,000 | 2.6 years |
| LED retrofit | Mainly lamp replacement. 50% cut in lighting electricity (22% of total) | ¥3.2M | ¥1.05M | 3.0 years |
| High-efficiency HVAC | Evaluated on the “incremental cost” of replacing end-of-life units with high-efficiency rather than standard models. 30% cut in HVAC electricity. After 1/3 subsidy | ¥5.0M → ¥3.33M after subsidy | ¥1.09M | 3.1 years 4.6 years without subsidy |
| Commercial heat-pump water heating | 70% of gas water heating converted to heat pumps with COP 3.5, including storage tanks. After 1/2 subsidy | ¥25M → ¥12.5M after subsidy | ¥2.38M | 5.3 years 10.5 years without subsidy |
Source: HotelBank Editorial Team estimates. Subsidy rates are based on the application guidelines for the Sustainable open Innovation Initiative (SII) “FY2025 Supplementary Budget Energy Conservation and Non-Fossil Transition Subsidy (Equipment-Unit Type)”
How high-efficiency HVAC is treated matters especially in practice. If individual guestroom air conditioners are booked as a full investment, the payback from electricity savings alone exceeds 20 years, making it hard to justify. But air conditioners are equipment that inevitably reaches its replacement date, and if at that point the “incremental cost” between a standard and a high-efficiency unit is treated as the investment, payback shrinks to 3.1 years after subsidy. Rather than drawing up replacement plans and energy-saving plans separately, attaching energy-efficiency decisions to the replacement calendar is the shortest route to a realistic payback period.
Heat-pump water heating requires a large investment, but given that hot water is the largest end use at 31.0% of hotel energy consumption, it has the biggest impact. Payback of 10.5 years without subsidy and 5.3 years with a 1/2 subsidy falls within the expected service life of the equipment. At properties like Model B with a large bath, heat demand itself is greater, so absolute savings have room to grow further.
Sensitivity Analysis: How Far Payback Moves When Energy Prices Change
The estimates so far rest on a single pair of assumptions: electricity at ¥22.78/kWh and city gas at ¥150 per cubic meter. Since energy prices move with policy and fuel markets, it is worth checking how well the conclusions hold when those assumptions vary. The three tables below keep Model A’s consumption fixed as in the main text (420,000 kWh of electricity / 42,000 cubic meters of city gas) and vary only the unit prices. Shaded cells are the base cases used in the main text.
| Electricity \ gas rate | ¥120/m³ | ¥135/m³ | ¥150/m³ | ¥165/m³ | ¥180/m³ |
|---|---|---|---|---|---|
| ¥18 | 12.60 | 13.23 | 13.86 | 14.49 | 15.12 |
| ¥20 | 13.44 | 14.07 | 14.70 | 15.33 | 15.96 |
| ¥22.78 Base | 14.61 | 15.24 | 15.87 | 16.50 | 17.13 |
| ¥25 | 15.54 | 16.17 | 16.80 | 17.43 | 18.06 |
| ¥28 | 16.80 | 17.43 | 18.06 | 18.69 | 19.32 |
Source: HotelBank Editorial Team estimates (100-room, high-voltage supply model)
Across electricity rates of ¥18–28/kWh and gas rates of ¥120–180 per cubic meter, annual utility costs range from ¥12.60 million to ¥19.32 million, or ¥126,000 to ¥193,000 per room. The range is roughly ±20% around the base case, larger than the difference made by rate relief discussed earlier (4.6%).
| Measure | ¥18/kWh | ¥20/kWh | ¥22.78/kWh Base | ¥25/kWh | ¥28/kWh |
|---|---|---|---|---|---|
| Occupancy-linked guestroom controls Investment ¥1.5M | 3.3 yrs | 3.0 yrs | 2.6 yrs | 2.4 yrs | 2.1 yrs |
| LED retrofit Investment ¥3.2M | 3.8 yrs | 3.5 yrs | 3.0 yrs | 2.8 yrs | 2.5 yrs |
| High-efficiency HVAC (incremental cost, after subsidy) Investment ¥3.33M | 3.9 yrs | 3.5 yrs | 3.1 yrs | 2.8 yrs | 2.5 yrs |
Source: HotelBank Editorial Team estimates. Electricity savings are fixed at each measure’s assumption in the main text (15% cut in guestroom electricity / 50% cut in lighting / 30% cut in HVAC), and only the unit price is varied
The three electricity-only measures pay back within 2.1–3.9 years across the entire plausible price range. Payback lengthens as electricity prices fall, but never exceeds four years. Varying the reduction rate does not change the picture either: occupancy-linked guestroom controls pay back in 3.9 years at a 10% reduction and 2.0 years at 20%. For these three measures, the choice of price assumption does not overturn the investment decision.
| Electricity \ gas rate | ¥120/m³ | ¥135/m³ | ¥150/m³ | ¥165/m³ | ¥180/m³ |
|---|---|---|---|---|---|
| ¥18 | 6.5 yrs | 5.3 yrs | 4.5 yrs | 3.9 yrs | 3.4 yrs |
| ¥20 | 7.2 yrs | 5.7 yrs | 4.8 yrs | 4.1 yrs | 3.6 yrs |
| ¥22.78 Base | 8.4 yrs | 6.5 yrs | 5.3 yrs | 4.4 yrs | 3.8 yrs |
| ¥25 | 9.6 yrs | 7.2 yrs | 5.7 yrs | 4.8 yrs | 4.1 yrs |
| ¥28 | 12.1 yrs | 8.5 yrs | 6.5 yrs | 5.3 yrs | 4.5 yrs |
Source: HotelBank Editorial Team estimates. Assumes 70% of gas water heating is converted to heat pumps with COP 3.5 (city gas reduced by 29,400 m³ / electricity increased by 89,250 kWh; boiler efficiency 85%), varying only unit prices. Subsidy rate is the 1/2 Electrification & Decarbonized Fuel Conversion Type of the Sustainable open Innovation Initiative (SII) “FY2025 Supplementary Budget Energy Conservation and Non-Fossil Transition Subsidy”
Heat-pump water heating alone behaves differently. Payback ranges from 3.4 to 12.1 years, a 3.5x spread. Because this measure pays back through the difference between gas savings and added electricity costs, whether it works depends not on the absolute level of electricity and gas prices but on their relative price. In the upper-right area, where gas is expensive and electricity cheap, payback is under four years; in the lower-left area where electricity is expensive and gas cheap (¥28/kWh electricity, ¥120 per cubic meter gas), it is 12.1 years, a level at which the expected service life of the equipment becomes a real concern.
The practical sequence is therefore clear. The three electricity measures can be decided first regardless of price assumptions. For heat-pump water heating, plug your property’s electricity and gas rates over the past 12 months into Table 3 before deciding. Properties dependent on heavy oil or LPG usually sit on the right side of Table 3 to begin with (where fuel is expensive on a city-gas-equivalent basis), so the same equipment tends to show a shorter payback than under city-gas assumptions.
FY2026 Energy-Efficiency Subsidy Framework for Accommodation Properties
We also summarize the subsidy programs that underpin investment decisions. The core program is the “Energy Conservation and Non-Fossil Transition Subsidy,” overseen by METI and the Agency for Natural Resources and Energy and administered by the Sustainable open Innovation Initiative (SII). The categories most usable for hotels and ryokan are as follows.
| Program category | Subsidy rate | Maximum / minimum | Main eligible equipment |
|---|---|---|---|
| Equipment-Unit Type [Standard Track] | Up to 1/3 | ¥100M / ¥300,000 | Designated equipment in 10 categories, including high-efficiency HVAC, commercial water heaters, high-performance boilers, industrial heat pumps, transformers and LED lighting with controls |
| GX Equipment-Unit Type | Up to 1/3 | ¥300M / ¥300,000 | Designated equipment from manufacturers meeting GX requirements; equipment meeting top-runner performance standards |
| Electrification & Decarbonized Fuel Conversion Type | Up to 1/2 | ¥300M (¥500M for electrification projects) / ¥300,000 | Industrial heat pumps, commercial heat-pump water heaters, etc. Replacements involving a switch from fossil fuels to electricity or to lower-carbon fuels |
Source: Sustainable open Innovation Initiative (SII), “FY2025 Supplementary Budget Energy Conservation and Non-Fossil Transition Subsidy (Equipment-Unit Type)” application guidelines (published March 30, 2026)
To qualify, a project must meet one of the following on a crude-oil-equivalent basis: a planned energy saving rate of 10% or more, planned energy savings of 1 kL or more, or planned energy savings per expense of 1 kL per ¥10 million or more. In addition to equipment costs, construction costs are also eligible for SMEs and similar businesses. Replacing boilers or oil-fired water heating with heat pumps may qualify for the 1/2 Electrification & Decarbonized Fuel Conversion Type, which makes it especially worth considering for LPG- and heavy-oil-dependent properties that benefit little from rate relief. Several application rounds are held each fiscal year; the first round for the FY2025 supplementary budget ran from March 30 to April 27, 2026, with grant decisions in June.
Conclusion: Where the Room for Savings Lies
Pulling together the figures in this article, the room for savings comes down to four areas.
First, operational improvement. As the Energy Conservation Center, Japan case shows, electricity use has been cut by 30% with zero capital investment. Basic practices such as metering and recording consumption, setting management standards and shutting off HVAC in unused rooms are an area where the concept of payback does not even apply. The fact that only 35 of 165 businesses (21.2%) meet the benchmark target of 0.723 shows that the industry as a whole still has the headroom the system envisages.
Second, tying energy efficiency to the replacement calendar. Evaluated as a standalone investment, high-efficiency HVAC pays back in more than 20 years, but evaluated as the incremental cost at replacement and combined with subsidies, payback shrinks to 3.1 years. Same equipment, same effect, yet the investment decision changes purely with the evaluation framework.
Third, converting heat sources. Hot water is the largest end use at 31.0% of hotel energy consumption, and its share is even higher at properties with a large bath. Commercial heat-pump water heating may qualify for a 1/2 subsidy, bringing payback down to 5.3 years. For properties dependent on LPG or heavy oil in particular, the economic case for conversion is relatively strong for two reasons: the kerosene CPI has risen to 149.8 (2019 = 100), outpacing accommodation charges at 137.5, and these fuels are excluded from electricity and gas rate relief.
Fourth, design tailored to season and property type. 30.3% of annual utility costs fall in December–February, when occupancy is also lowest. Properties with bathing facilities bear 3.55 times the energy per occupied room-night, and about 3.7 times the utility cost in yen. Winter heat-source efficiency and building operating plans for low-occupancy periods are areas with a higher return on investment than any other time of year.
Treatment of electricity and gas rate relief from October 2026 onward had not been announced at the time of writing, but as the estimate shows, the difference relief makes is 4.6% of total utility costs. Policy is a variable that changes every fiscal year, while energy intensity is a constant the operator can move. Unlike holding costs set by tax rates, such as property tax, energy costs can be moved through operations and equipment. The conclusion is that working on the latter pays off whichever way policy turns.
Note on the estimates in this article: Model property consumption, unit prices and reduction rates are assumptions based on public statistics and published rates available at the time of research; actual figures vary with each property’s age, operating hours, location and contract terms. The details of electricity and gas rate relief from October 2026 onward had not been announced as of writing (September 7, 2026), and Scenario 2 is a hypothetical calculation assuming the same terms as January–March and July–September 2026 are repeated. Subsidy rates, caps and application periods are revised each fiscal year, so please check the latest application guidelines when considering an actual project.
Related Articles
References and Sources
■ Data Sources
Energy consumption and cost ratios are from the Agency for Natural Resources and Energy’s “Energy Consumption Statistics Survey” (FY2016) and the Small and Medium Enterprise Agency’s “Basic Survey of Small and Medium Enterprises” (FY2014–FY2016 final, incorporated businesses); occupancy from the Japan Tourism Agency’s “Overnight Travel Statistics Survey,” 2025 annual (preliminary); and prices from the Ministry of Internal Affairs and Communications’ “Consumer Price Index (2025 base)” and “Family Income and Expenditure Survey” (two-or-more-person households, quantities). Rate-relief discounts are from METI’s special authorizations and approvals (published December 16, 2025 / June 12, 2026), and subsidy rates and caps from the Sustainable open Innovation Initiative (SII) “FY2025 Supplementary Budget Energy Conservation and Non-Fossil Transition Subsidy (Equipment-Unit Type)” application guidelines (published March 30, 2026). Estimated settled ADR is aggregated by MetroEngines Research (business hotels: by all 47 prefectures, sum of monthly medians of properties covered N=7,380; ryokan: N=6,698 on the same basis; both August 2025–July 2026). The electricity rate is the high-voltage average of ¥22.78/kWh (as of May 2026) published by Shin-Denryoku Net (Energy Information Center).
■ Estimation Assumptions
Model A is a 100-room limited-service hotel with 3,200 m² of floor area, high-voltage supply and no large bath, using 420,000 kWh of electricity (4,200 kWh per room) and 42,000 m³ of city gas a year. Model B is a 100-room property with 5,500 m² of floor area and a large bath, using 600,000 kWh of electricity and 5,000 GJ of fuel a year. Heat-value conversion uses Energy Conservation Act factors (electricity 9.76 GJ per 1,000 kWh; city gas 13A 45 MJ per m³), boiler efficiency of 85% and heat-pump COP of 3.5. Unit prices are ¥22.78/kWh for electricity and ¥150/m³ for city gas. Reduction rates for energy-saving measures are 15% of guestroom electricity (occupancy-linked controls), 50% of lighting electricity (LED retrofit), 30% of HVAC electricity (high-efficiency HVAC) and conversion of 70% of gas water heating (heat-pump water heating), all planning-stage assumptions. Payback is simple payback, calculated as post-subsidy investment divided by annual savings, excluding interest, maintenance and equipment renewal costs. The sensitivity analysis (Tables 1–3) holds consumption and reduction rates fixed and varies only unit prices, over ¥18–28/kWh for electricity and ¥120–180/m³ for city gas.
■ Limitations and Caveats
Model property consumption, unit prices and reduction rates are assumptions; actual figures vary with each property’s age, operating hours, location and supply contract. The latest final results of the Energy Consumption Statistics Survey are for FY2016, so price increases since then are not reflected in the ratios in this article. The Family Income and Expenditure Survey used to support seasonality is household-sector data and does not demonstrate that the commercial sector follows an identical pattern. The CPI for electricity covers residential (low-voltage) supply, which differs in rate level and revision timing from the high-voltage supply typical of hotels, and the electricity index since 2023 reflects prices after rate-relief discounts. Electricity and gas rate relief from October 2026 onward had not been announced as of writing (September 7, 2026), and Scenario 2 is a hypothetical calculation assuming the same terms as January–March and July–September 2026 are repeated. Subsidy rates, caps and application periods are revised each fiscal year, so please check the latest application guidelines when considering an actual project. Estimated settled ADR is an estimate and differs from each property’s actual settled rates and accounting figures.
■ Government Statistics and Public Data
- Small and Medium Enterprise Agency, “Basic Survey of Small and Medium Enterprises,” Statistical Table 3: Sales and Operating Expenses by Industry Subdivision (incorporated businesses), FY2014–FY2016 final (e-Stat table ID: 0003317768)
- Agency for Natural Resources and Energy, “Energy Consumption Statistics Survey,” B Heat-Unit Tables, Energy Intensity Table, FY2016 (e-Stat table ID: 0003241065), survey page
- Statistics Bureau, Ministry of Internal Affairs and Communications, “Consumer Price Index (2025 base),” national, by item (e-Stat table ID: 0004052037)
- Statistics Bureau, Ministry of Internal Affairs and Communications, “Family Income and Expenditure Survey,” Income and Expenditure, two-or-more-person households, item classification (2025 revision, quantities, monthly) (e-Stat table ID: 0004023602)
- Japan Tourism Agency, “Overnight Travel Statistics Survey,” January–December 2025 (annual, preliminary)
- Japan Tourism Agency press release, “Overnight Travel Statistics Survey (December 2025 second preliminary, January 2026 first preliminary) and (2025 annual, preliminary)”
■ Policy and Subsidies
- METI, “Special authorizations and approvals allowing discounts on electricity and city gas rates in connection with rate relief for January, February and March 2026 usage” (December 16, 2025)
- METI, “Special authorizations and approvals allowing discounts on electricity and city gas rates in connection with rate relief for July, August and September 2026 usage” (June 12, 2026)
- Agency for Natural Resources and Energy, “Electricity and gas rate relief this winter as heating costs mount: ANRE answers frequently asked questions” (December 22, 2025)
- Agency for Natural Resources and Energy, “Overview of the Benchmark System for the Hotel Business” (April 2021)
- Agency for Natural Resources and Energy, “Periodic Reports and Medium- to Long-Term Plans” (Energy Conservation Portal)
- Agency for Natural Resources and Energy, Energy Conservation Division, “On Energy Conservation Policy” (January 13, 2023) / list of benchmark industries and number of businesses meeting targets
- Sustainable open Innovation Initiative (SII), “FY2025 Supplementary Budget Energy Conservation and Non-Fossil Transition Subsidy (Equipment-Unit Type)” application information / Application guidelines (PDF)
■ Industry and Technical Materials
- Energy Conservation Center, Japan, “Energy Conservation in Hotels” (commissioned by ANRE under the Commercial Building Energy Conservation Promotion Project) / primary energy intensity of 41 urban hotels and reduction cases from operational improvements
- Ministry of the Environment, “2.4 Hotels and Ryokan” (industry-specific energy conservation materials) / breakdown of annual energy consumption in hotels (original source: Housing and Building Energy Conservation Handbook 2002, Institute for Building Environment and Energy Conservation)
- Shin-Denryoku Net (Energy Information Center), “Trends in Average Electricity Rates for Businesses and Households (Extra-High, High and Low Voltage)” / high-voltage average rate ¥22.78/kWh (as of May 2026)
■ Market Data
- MetroEngines Research — estimated settled ADR (business hotels: aggregated by all 47 prefectures, sum of monthly medians of properties covered N=7,380; ryokan: N=6,698 on the same basis; both August 2025–July 2026)