

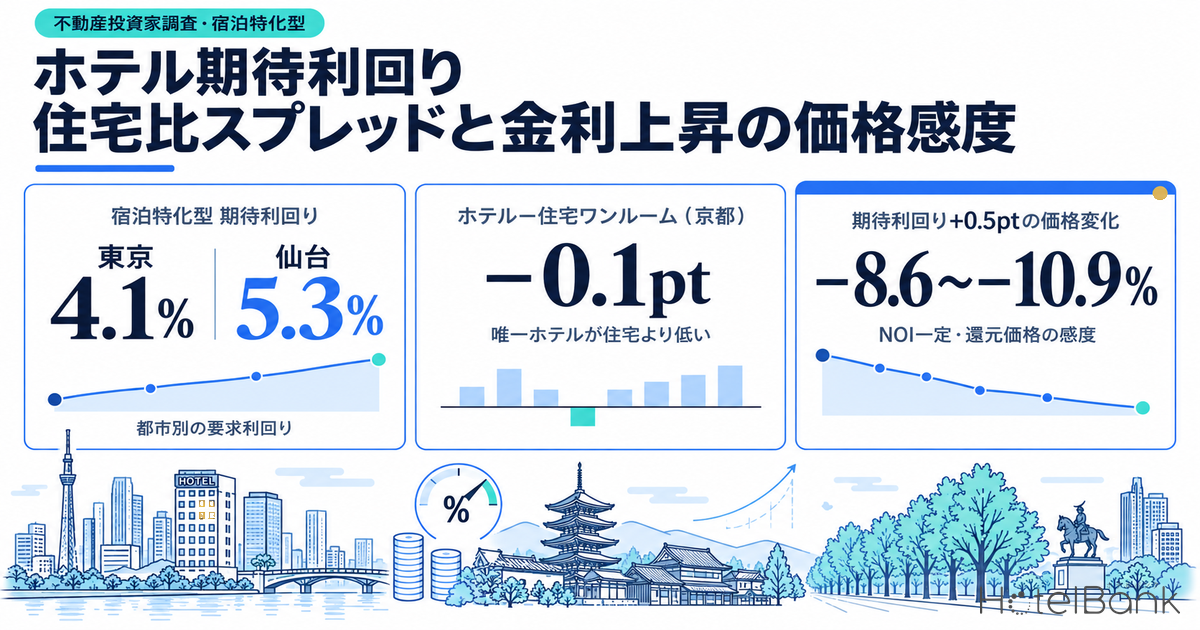
Only two things set the price of a hotel: its NOI (net operating income) and the yield used to capitalize it. According to the 54th Japanese Real Estate Investor Survey (as of April 2026), published by the Japan Real Estate Institute (JREI) on May 27, 2026, the expected yield for limited-service hotels is 4.1% in Tokyo and 5.3% in Sendai. Of the eight cities surveyed, four — Tokyo, Nagoya, Kyoto and Fukuoka — fell 0.1 points from the previous survey (October 2025). This article takes the survey’s city-level required yields as its starting point and brings together, in one set of tables, the spreads over studio (one-room) rental apartments and Class A offices, MetroEngines Research’s estimated settled ADR, and the price sensitivity if long-term interest rates settle in the 2–3% range. The conclusions first: the hotel-over-residential spread is +0.5 points in Tokyo, but −0.1 points in Kyoto, where hotels trade at the lower yield. And a 0.5-point rise in the expected yield cuts the value of a 100-room model hotel with unchanged NOI by 8.6–10.9%.
Metric Definitions Used in This Article
- Expected yield: The median of the yields that investors report they would require for a new investment in JREI’s Japanese Real Estate Investor Survey (the survey uses the median as its representative value). It is an aggregate of survey responses, not an actual transaction yield or the appraisal yield of any individual property. 142 companies responded (83.0% response rate); survey date April 1, 2026.
- Spread: The limited-service hotel expected yield minus the expected yield for another asset class in the same city (studio rental apartments / Class A office buildings), in percentage points.
- ADR (Average Daily Rate): An estimated settled rate (tax-exclusive equivalent) derived by applying category-specific adjustment factors to the lowest-priced plan level each property publishes on OTAs (per room, two guests per room, tax included). Checked against property-level results disclosed by listed hotel REITs (91 properties, latest 3 months), the median error is about 7%. These are estimates and differ from each property’s actual settled prices and accounting figures. Area-level ADR is the median of the properties covered (the level of a typical property in the area). In this article, monthly business-hotel values by ward/city are weighted by the number of properties covered to produce a city-level figure, then simply averaged over the 12 closed months from September 2025 to August 2026.
- OCC (Occupancy Rate): Rooms sold as a share of total rooms in the area (an estimate based on OTA sales inventory). The 80% used in this article’s model is an assumption (occupancy (assumed), full-year), not an estimate or actual result.
- NOI (as defined in this article): GOP (gross operating profit) less management fees, property taxes, insurance premiums and the FF&E reserve. Capitalized value = NOI ÷ expected yield.
- Data sources: Japan Real Estate Institute, 54th Japanese Real Estate Investor Survey; Ministry of Finance (JGB auction results); MetroEngines Research (ADR; of the roughly 168,000 properties tracked in Japan, the roughly 27,000 with confirmed operations are analyzed); investment corporations’ IR materials
Key Takeaways
— Expected yields across the 8 cities range from 4.1% to 5.3%. Tokyo, Nagoya, Kyoto and Fukuoka fell 0.1 points and the other four were unchanged. None rose.
— The hotel-over-studio-apartment spread is +0.5pt in Tokyo and −0.1pt in Kyoto. Kyoto is the only city where limited-service hotels are valued at a lower yield than residential.
— Cities with higher estimated settled ADR have lower expected yields (correlation coefficient −0.68 across the 8 cities). But Tokyo and Osaka sit about 0.4 points below what their rate levels imply, while Sapporo and Sendai sit about 0.3 points above.
— A +0.25pt rise in expected yield lowers value by 4.5–5.7%; +0.5pt by 8.6–10.9%. The lower a city’s yield, the more its value moves for the same rise.
— In five cities (Sapporo, Sendai, Nagoya, Fukuoka, Naha), ADR growth over the last 12 months is enough to absorb a +0.25pt rise. Naha’s growth covers as much as +0.5pt.
Expected Yields in 8 Cities — Tokyo at 4.1%, Four Cities Down 0.1 Points
First, the survey figures. Expected yields for limited-service hotels are 4.1% in Tokyo, 4.5% in Kyoto and Osaka, 4.7% in Fukuoka, 4.9% in Nagoya, 5.0% in Sapporo and Naha, and 5.3% in Sendai. Compared with the previous 53rd survey (as of October 1, 2025), Tokyo fell from 4.2% to 4.1%, and Nagoya, Kyoto and Fukuoka each fell 0.1 points. Sapporo, Sendai, Osaka and Naha were unchanged, and no city rose.
In the same survey, Class A offices in Tokyo’s Marunouchi/Otemachi were flat at 3.2% for the seventh consecutive survey, while rental apartments in Tokyo’s Jonan district fell 0.1 points for both studio (3.6%) and family (3.7%) units. In other words, over the past six months the force pushing yields down acted on hotels and residential alike but did not reach offices. 93% of investors said they would “actively pursue” new investment, and the survey summarizes that “real estate investors’ very active investment stance is being maintained.”
| City | 53rd survey (Oct 2025) | 54th survey (Apr 2026) | Change | Spread over 10-yr JGB (2.995%) |
|---|---|---|---|---|
| Tokyo | 4.2% | 4.1% | −0.1pt | +1.1pt |
| Sapporo | 5.0% | 5.0% | 0.0pt | +2.0pt |
| Sendai | 5.3% | 5.3% | 0.0pt | +2.3pt |
| Nagoya | 5.0% | 4.9% | −0.1pt | +1.9pt |
| Kyoto | 4.6% | 4.5% | −0.1pt | +1.5pt |
| Osaka | 4.5% | 4.5% | 0.0pt | +1.5pt |
| Fukuoka | 4.8% | 4.7% | −0.1pt | +1.7pt |
| Naha | 5.0% | 5.0% | 0.0pt | +2.0pt |
The expected yield is the median of the “I would buy at this level” requirements collected by questionnaire. It is neither the yield of a completed transaction nor the yield used in the appraisal of a particular property. It is best read as the center of market participants’ views, bundling the opinions of the 142 responding companies. Later in this article we set it alongside listed REITs’ appraisal yields to check the distance between investor views and practice.
Spreads over Other Assets — +0.5pt over Residential in Tokyo, Negative Only in Kyoto
A hotel expected yield on its own is hard to judge as high or low. Set it against the yields the same investors require for other assets in the same city, and the premium specific to hotels comes into view. As comparators we use studio rental apartments, which, like hotels, are located in both residential and commercial districts, and Class A offices, the benchmark asset of city centers.
| City | Hotel | Studio apartment | Hotel − residential | Class A office | Hotel − office |
|---|---|---|---|---|---|
| Tokyo | 4.1% | 3.6% | +0.5pt | 3.2% (Marunouchi/Otemachi) | +0.9pt |
| Sapporo | 5.0% | 4.9% | +0.1pt | 4.8% | +0.2pt |
| Sendai | 5.3% | 5.0% | +0.3pt | 5.0% | +0.3pt |
| Nagoya | 4.9% | 4.5% | +0.4pt | 4.3% | +0.6pt |
| Kyoto | 4.5% | 4.6% | −0.1pt | 4.7% | −0.2pt |
| Osaka | 4.5% | 4.2% | +0.3pt | 4.1% (Midosuji) | +0.4pt |
| Fukuoka | 4.7% | 4.5% | +0.2pt | 4.5% | +0.2pt |
| Naha | 5.0% | — | — | — | — |
The spread over studio apartments is widest in Tokyo at +0.5 points, followed by Nagoya (+0.4), Sendai and Osaka (+0.3), Fukuoka (+0.2) and Sapporo (+0.1). Only Kyoto is negative at −0.1 points, with limited-service hotels at 4.5% below studio apartments at 4.6%. In Kyoto, landscape and height controls overlap with location restrictions on lodging facilities, so the room for new supply is likely more limited than in other cities. Meanwhile, residential is priced in line with other regional cities, so only the hotel yield sits a notch lower. One reading is that investors grant Kyoto hotels the kind of stability premium that in other cities they give only to residential.
The office comparison shows the same pattern. In Kyoto, hotels at 4.5% are 0.2 points below Class A offices at 4.7%; Sapporo and Fukuoka are +0.2 points and Sendai +0.3 points, nearly level with offices. Tokyo is +0.9 points above Marunouchi/Otemachi’s 3.2%. Tokyo’s hotel yield is the lowest of the eight cities, yet its premium over the same city’s offices and housing is the largest. The difference this reveals: in regional cities hotels are treated almost on a par with other assets, whereas in Tokyo the price still builds in volatility specific to hotels.
Distance from Interest Rates — 10-Year JGB at 2.995%, 60% of Investors Expect 2–3%
The other benchmark for spreads is the risk-free rate. At the Ministry of Finance’s auction of 10-year JGBs (No. 383) on September 1, 2026, the yield corresponding to the average accepted price was 2.995% and the yield corresponding to the lowest accepted price was 3.011%. On the same yardstick, the right-hand column of Table 1 shows Tokyo’s 4.1% hotel expected yield about 1.1 points above the 10-year JGB, Kyoto and Osaka about 1.5 points above, and Sendai about 2.3 points above.
Investors at the survey date already had this level in view. In the 54th survey’s special questionnaire, the most common forecast for the long-term interest rate at end-March 2027 was “above 2% to 3% or below,” chosen by 61.7% (133 valid responses), followed by “1% to 1.5% or below” at 15.8% and “above 1.5% to 2% or below” at 14.3%. Among future risk factors (two choices allowed), “rising interest rates” ranked first with 122 companies, far ahead of second-place “soaring construction costs and rising running costs such as management fees” with 73. On the other hand, regarding the impact of the Bank of Japan’s series of monetary policy moves on the real estate investment market, the most common answer, at 68.2%, was “no impact; nothing has changed.” The average investor at the survey date had priced in rising rates, and so far this had not led to a pullback in transactions. How far rate levels push up the break-even line on the development side is examined in detail in Policy Rate 1.00%: Break-Even ADR Across Japan’s 8 Hotel Markets.
However, with long-term rates approaching the top of the expected range, the gap between hotel expected yields and JGB yields has narrowed to just over 1 point in Tokyo. How much of a gap is tolerable depends on income growth, which we turn to next.
Estimated Settled ADR and Expected Yield — Higher-Rate Cities Have Lower Yields
A low expected yield means the same NOI commands a higher price. So how closely do differences in expected yield track differences in each city’s hotel earning power? We aggregated MetroEngines Research’s estimated settled ADR (business hotel category) for each of the eight cities over the 12 closed months from September 2025 to August 2026 and compared it with the prior-year period (September 2024 to August 2025).
| City | Coverage | Prior-year period (Sep 2024–Aug 2025) | Last 12 months (Sep 2025–Aug 2026) | YoY | Properties covered (per month) | Expected yield |
|---|---|---|---|---|---|---|
| Tokyo | Tokyo 23 wards | ¥14,421 | ¥15,180 | +5.3% | 814–842 | 4.1% |
| Sapporo | Sapporo City | ¥12,194 | ¥13,379 | +9.7% | 123–131 | 5.0% |
| Sendai | Sendai City | ¥8,809 | ¥9,292 | +5.5% | 77–78 | 5.3% |
| Nagoya | Nagoya City | ¥8,995 | ¥9,621 | +7.0% | 158–162 | 4.9% |
| Kyoto | Kyoto City | ¥14,618 | ¥15,008 | +2.7% | 277–290 | 4.5% |
| Osaka | Osaka City | ¥11,426 | ¥10,620 | −7.1% | 400–413 | 4.5% |
| Fukuoka | Fukuoka City | ¥13,227 | ¥14,485 | +9.5% | 207–213 | 4.7% |
| Naha | Naha City | ¥8,111 | ¥9,448 | +16.5% | 103–106 | 5.0% |
Over the last 12 months, estimated settled ADR was highest in Tokyo’s 23 wards (¥15,200), Kyoto City (¥15,000) and Fukuoka City (¥14,500), followed by Sapporo City (¥13,400), Osaka City (¥10,600), Nagoya City (¥9,600), Naha City (¥9,400) and Sendai City (¥9,300). Year on year, Naha City grew the most at +16.5%, followed by Sapporo City +9.7%, Fukuoka City +9.5%, Nagoya City +7.0%, Sendai City +5.5%, Tokyo’s 23 wards +5.3% and Kyoto City +2.7%. Osaka City was −7.1%, but most of its prior-year period overlapped with Expo 2025 Osaka, Kansai (April 13 – October 13, 2025), so the figure is measured against that high base.
Lining up the eight cities reveals a downward-sloping relationship: the higher a city’s estimated settled ADR, the lower its expected yield. The correlation coefficient is −0.68, and a simple straight-line fit puts the expected yield about 0.1 points lower for every ¥1,000 of ADR. Rate levels, in other words, explain investor views up to a point.
The more telling part is the deviation from the line. Tokyo’s 4.1% is 0.35 points below the 4.45% its rate level implies, and Osaka’s 4.5% is 0.40 points below its implied 4.90%; both carry yields lower than their rates alone would justify. As discussed below, these are the two cities where listed REIT holdings concentrate, and the depth of buying and selling — liquidity — is likely pushing their yields down. Conversely, Sapporo is at 5.0% against an implied 4.63% (+0.37 points) and Sendai at 5.3% against 5.03% (+0.27 points), leaving a premium above what rates suggest. Sapporo’s rates swing widely by season (monthly values over the last 12 months ranged from ¥8,200 to ¥19,400), and Sendai is the only one of the eight cities with no listed hotel REIT holdings. Both premiums come from factors other than rate level, and could narrow if demand stability or a deeper buyer base come to be reflected in valuations.
Price Sensitivity of a 100-Room Model — +0.5pt in Expected Yield Cuts Value by 8.6–10.9%
Next, suppose long-term rates hold at 2–3% and hotel expected yields rise by +0.25 or +0.5 points. If NOI does not change, value falls to NOI capitalized at the new yield. We placed a 100-room limited-service hotel in each city, derived NOI from Table 3’s estimated settled ADR under the assumptions below, and capitalized it at the expected yield.
The assumptions are occupancy (assumed) of 80% (full-year), rooms revenue at 92% of total revenue, and an NOI margin (on total revenue) of 29.9%. The NOI margin is taken as-is from the 100-room model in our previous article on hotel acquisition debt capacity (LTV of 57–63% on a ¥3.0 billion, 100-room hotel), where it was built up from a 42% GOP margin by deducting management fees, property taxes, insurance premiums and the FF&E reserve. Because the same ratio is applied to all eight cities, differences in ADR translate directly into differences in NOI.
| City | ADR (assumed) | NOI (¥ million) | Expected yield | Capitalized value | +0.25pt | +0.5pt | % change at +0.5pt | Value change at +0.5pt |
|---|---|---|---|---|---|---|---|---|
| Tokyo | ¥15,180 | 144.1 | 4.1% | ¥3.514bn | ¥3.312bn | ¥3.132bn | −10.9% | −¥382m |
| Sapporo | ¥13,379 | 127.0 | 5.0% | ¥2.539bn | ¥2.418bn | ¥2.308bn | −9.1% | −¥231m |
| Sendai | ¥9,292 | 88.2 | 5.3% | ¥1.664bn | ¥1.589bn | ¥1.520bn | −8.6% | −¥143m |
| Nagoya | ¥9,621 | 91.3 | 4.9% | ¥1.863bn | ¥1.773bn | ¥1.691bn | −9.3% | −¥173m |
| Kyoto | ¥15,008 | 142.4 | 4.5% | ¥3.165bn | ¥2.998bn | ¥2.849bn | −10.0% | −¥317m |
| Osaka | ¥10,620 | 100.8 | 4.5% | ¥2.240bn | ¥2.122bn | ¥2.016bn | −10.0% | −¥224m |
| Fukuoka | ¥14,485 | 137.5 | 4.7% | ¥2.925bn | ¥2.777bn | ¥2.644bn | −9.6% | −¥281m |
| Naha | ¥9,448 | 89.7 | 5.0% | ¥1.793bn | ¥1.708bn | ¥1.630bn | −9.1% | −¥163m |
In Tokyo, NOI of about ¥144 million capitalized at 4.1% gives about ¥3.51 billion (about ¥35.1 million per room). At an expected yield of 4.35% the value is about ¥3.31 billion (−5.7%); at 4.6% it is about ¥3.13 billion (−10.9%). A +0.5-point rise equals a price difference of about ¥380 million on a single building. In Sendai, the same +0.5-point rise costs only −8.6%. The percentage change in value is set by “original yield ÷ new yield − 1,” so the lower a city’s yield, the more its value moves for the same rise. Kyoto and Osaka (4.5%) come in at −10.0%, Fukuoka (4.7%) at −9.6%, Nagoya (4.9%) at −9.3%, and Sapporo and Naha (5.0%) at −9.1%.
Per room, values range from about ¥35.1 million in Tokyo to about ¥16.6 million in Sendai, a gap of about 2.1x. Because the difference in expected yield (4.1% vs 5.3%) and the difference in ADR (¥15,200 vs ¥9,300) push in the same direction, the per-room value gap is wider than the ADR gap (about 1.6x).
Can ADR Growth Absorb It? — Five Cities Exceed the +0.25pt Threshold
A rise in yields can be offset by NOI growth. The NOI increase needed to hold value is “new yield ÷ original yield − 1”: for +0.25 points, +6.1% in Tokyo and +4.7% in Sendai; for +0.5 points, +12.2% in Tokyo and +9.4% in Sendai. Because NOI is proportional to ADR in this model, these are also the required ADR increases. In reality, fixed costs mean ADR growth lifts NOI by a larger percentage, so the ADR growth actually required is somewhat smaller. Table 5 shows the conservative values.
| City | ADR YoY | NOI growth needed for +0.25pt | NOI growth needed for +0.5pt | Rise offset by last 12 months’ ADR growth |
|---|---|---|---|---|
| Tokyo | +5.3% | +6.1% | +12.2% | — |
| Sapporo | +9.7% | +5.0% | +10.0% | Up to +0.25pt |
| Sendai | +5.5% | +4.7% | +9.4% | Up to +0.25pt |
| Nagoya | +7.0% | +5.1% | +10.2% | Up to +0.25pt |
| Kyoto | +2.7% | +5.6% | +11.1% | — |
| Osaka | −7.1% | +5.6% | +11.1% | — |
| Fukuoka | +9.5% | +5.3% | +10.6% | Up to +0.25pt |
| Naha | +16.5% | +5.0% | +10.0% | Up to +0.5pt |
ADR growth over the last 12 months exceeded this threshold in five cities: Sapporo (+9.7%), Sendai (+5.5%), Nagoya (+7.0%), Fukuoka (+9.5%) and Naha (+16.5%). Naha even clears the +10.0% needed for +0.5 points. In these cities, if rates keep growing at the pace of the past year, value can be held even if expected yields rise 0.25 points. Tokyo, at +5.3%, falls just short of the +6.1% needed for +0.25 points. Kyoto (+2.7%) can be positioned, as noted earlier, as a city whose low yield, underpinned by supply constraints, rests more on a stability premium than on rate growth. Osaka’s figure is measured against a prior year that included the Expo period, so rather than judging from this table alone, it is better to confirm with growth rates from October 2026 onward, once the comparison base returns to normal months.
ADR growth is a past-year result, and there is no guarantee it continues at the same pace next year. Equally, expected yields do not necessarily rise by the same amount whenever interest rates rise. At the time of the 54th survey, even though most investors expected long-term rates of 2–3%, hotel expected yields fell in four cities. This suggests investors expected rate growth to outweigh any rise in yields.
Table 5 judged by the past year’s growth rate, but rate growth and rising yields move at the same time. Table 6 takes ADR change and the rise in expected yield as two axes and shows the resulting percentage change in capitalized value for Tokyo (4.1%) and Sendai (5.3%) side by side. Even with ADR up +5%, Tokyo’s value falls −1.0% at +0.25 points and −6.4% at +0.5 points. Under the same conditions Sendai comes in at +0.3% and −4.1%. If ADR falls −5% and a +0.5-point rise coincides, the declines widen to −15.3% in Tokyo and −13.2% in Sendai.
| ADR change | Tokyo ±0pt | Tokyo +0.25pt | Tokyo +0.5pt | Sendai ±0pt | Sendai +0.25pt | Sendai +0.5pt |
|---|---|---|---|---|---|---|
| ADR −5.0% | −5.0% | −10.5% | −15.3% | −5.0% | −9.3% | −13.2% |
| ADR ±0% | +0.0% | −5.7% | −10.9% | +0.0% | −4.5% | −8.6% |
| ADR +5.0% | +5.0% | −1.0% | −6.4% | +5.0% | +0.3% | −4.1% |
| ADR +10.0% | +10.0% | +3.7% | −2.0% | +10.0% | +5.0% | +0.5% |
| ADR +15.0% | +15.0% | +8.4% | +2.5% | +15.0% | +9.8% | +5.1% |
Listed REIT Holdings and Appraisal Yields — 112 Properties in the 8 Cities, None in Sendai
Next we check the survey’s views against how properties actually held are valued. We assigned the domestic holdings of seven listed hotel REITs — Ichigo Hotel REIT Investment Corporation (いちごホテルリート投資法人, 3463), Invincible Investment Corporation (インヴィンシブル投資法人, 8963), Nippon Hotel & Residential Investment Corporation (日本ホテル&レジデンシャル投資法人, 3472), Japan Hotel REIT Investment Corporation (ジャパン・ホテル・リート投資法人, 8985), Hoshino Resorts REIT (星野リゾート・リート投資法人, 3287), Mori Trust REIT (森トラストリート投資法人, 8961) and Kasumigaseki Hotel REIT (霞ヶ関ホテルリート投資法人, 401A) — to the eight cities by property address.
| City | Properties held | Rooms | Total acquisition price (¥ million) | Expected yield |
|---|---|---|---|---|
| Tokyo | 53 | 8,774 | 513,678 | 4.1% |
| Sapporo | 11 | 2,279 | 76,082 | 5.0% |
| Sendai | 0 | 0 | 0 | 5.3% |
| Nagoya | 5 | 1,332 | 30,575 | 4.9% |
| Kyoto | 5 | 774 | 24,428 | 4.5% |
| Osaka | 21 | 5,080 | 207,552 | 4.5% |
| Fukuoka | 14 | 3,418 | 122,176 | 4.7% |
| Naha | 3 | 812 | 28,422 | 5.0% |
| 8-city total | 112 | 22,469 | 1,002,913 | — |
Of the 300 properties held, 112 are in the eight cities. Tokyo’s 23 wards have the most at 53 properties and 8,774 rooms, followed by Osaka City (21 properties, 5,080 rooms), Fukuoka City (14) and Sapporo City (11). Tokyo and Osaka, whose expected yields came out below what their rate levels imply, are the two cities where listed REIT holdings concentrate. Sendai City has no holdings and, at 5.3%, the highest expected yield of the eight. This correspondence between depth of ownership and low yields is consistent with the previous section’s reading that liquidity differences show up in yields.
The direct capitalization rates actually used in appraising held properties were compiled in our previous analysis of hotel REIT appraisals (N=298 properties, of which 138 disclose a direct capitalization rate). By region, the medians are 4.10% for Greater Tokyo (18 disclosures), 4.30% for Greater Osaka (15), 5.00% for Greater Nagoya (14) and 5.20% for regional areas (91). Set against the survey’s expected yields, Tokyo matches at 4.1%, while in Osaka the appraisal median is 0.2 points below the 4.5% expected yield. Nagoya is roughly level, 5.00% against 4.9%, and the four regional cities (Sapporo, Sendai, Fukuoka, Naha) at 4.7–5.3% sit around the regional appraisal median of 5.20%. Regional disclosures are weighted toward one particular investment corporation; excluding it, the regional median is 4.9%. Apart from Osaka, investor views and appraisal practice are broadly at the same level.
How to Use This, by Reader
Asset managers and private funds
Setting the going-in cap rate from the city’s expected yield, adjusted for its position relative to rate levels (its deviation from the line in Figure 2), makes it easier to stay consistent with the exit cap rate at sale. Tokyo and Osaka carry yields lower than their rates would justify, and liquidity will also support them at exit. Sapporo and Sendai still carry a yield premium relative to their rates, offering upside from yield compression if ADR growth continues.
Regional bank real estate lenders
Collateral value sensitivity to a +0.5-point rise in expected yield is −10.9% in Tokyo and −8.6% in Sendai. Building LTV headroom of this size makes interest-rate scenarios easier to explain. Whether ADR YoY exceeds the required NOI growth (Table 5) is also a simple check of whether collateral value holds up when yields rise.
Operating companies considering acquisitions
Kyoto is the only city where hotel expected yields are lower than both residential and office, so sellers’ price expectations tend to be high. Meanwhile, in Naha, Fukuoka and Sapporo, ADR growth well exceeds the increase needed for +0.25 points, making them cities with ample room to absorb rising yields through post-acquisition rate growth.
Summary
In the 54th Japanese Real Estate Investor Survey, expected yields for limited-service hotels across the eight cities range from 4.1% to 5.3%, down 0.1 points in four cities. The spread over studio apartments runs from +0.5 points in Tokyo to −0.1 points in Kyoto, the only city where hotels are valued at a lower yield than residential. Against estimated settled ADR, cities with higher rates tend to have lower yields; within that, Tokyo and Osaka carry yields about 0.4 points below their rate levels thanks to deep liquidity.
With the 10-year JGB yield now close to 3%, a 0.5-point rise in expected yields would cut the value of the 100-room model by 8.6–10.9%. Yet in five cities — Sapporo, Sendai, Nagoya, Fukuoka and Naha — ADR growth over the last 12 months exceeds what is needed to offset a +0.25-point rise. Absorb rising rates through price, or through rate growth? The combination of these figures shows that the balance differs from city to city.
Related Articles
References and Sources
■ Data Sources
Japan Real Estate Institute, 54th Japanese Real Estate Investor Survey (survey date April 1, 2026; 142 respondents; expected yields are response medians); Ministry of Finance, JGB auction results (10-year JGB No. 383, auctioned September 1, 2026); MetroEngines Research estimated settled ADR (business hotel category, monthly values by ward/city for the 8 cities, 24 closed months from September 2024 to August 2026; properties covered per city as shown in Table 3); IR materials of the seven listed hotel REITs and our REIT ownership master (as of September 14, 2026, N=300 properties). Regional direct capitalization rates from appraisals are cited from a previous HotelBank analysis (N=298 properties, 138 with disclosures).
■ Model Assumptions
The model property is a 100-room limited-service hotel placed in each city. ADR is Table 3’s estimated settled ADR (business hotel category, 12 closed months from September 2025 to August 2026, average, tax-exclusive equivalent); occupancy (assumed) 80% (full-year), rooms revenue 92% of total, and NOI margin (on total revenue) 29.9%, applied to all eight cities. Capitalized value = NOI ÷ expected yield (54th survey median); values at expected yields +0.25 and +0.5 points were calculated with NOI held constant. The 10-year JGB yield is the 2.995% average accepted yield at the September 1, 2026 auction (No. 383).
■ Limitations
Expected yields are medians of an investor questionnaire, not transaction or appraisal yields. The survey’s “Tokyo,” “Osaka,” etc. are survey districts and do not match this article’s ADR coverage (business hotel category across Tokyo’s 23 wards and each city as a whole). Because a common NOI margin is used for all eight cities, in practice lower-rate cities tend to show lower NOI margins due to differing fixed-cost ratios. The 80% occupancy (assumed) likewise does not reflect differences between cities. ADR YoY is a past-year result and does not indicate future growth. The scatter-plot correlation covers only eight cities and does not indicate causation. Listed REIT property counts are based on location assignments in our master, and acquisition prices are values at acquisition.
■ Market Data
- MetroEngines Research & Consulting — estimated settled ADR (business hotel category, 8 cities, September 2024 to August 2026); listed REIT ownership master (as of September 14, 2026, N=300 properties)
■ Surveys and Public Data
- Japan Real Estate Institute, “The 54th Japanese Real Estate Investor Survey (as of April 2026)” (published May 27, 2026)
- Ministry of Finance, “Auction Results for 10-Year JGBs (No. 383)” (September 1, 2026)
- Ministry of Finance, “What’s New 2026: JGBs”
■ REITs
- Japan Hotel REIT Investment Corporation, “Portfolio List”
- IR materials (property lists) of Ichigo Hotel REIT, Invincible Investment Corporation, Nippon Hotel & Residential Investment Corporation, Hoshino Resorts REIT, Mori Trust REIT and Kasumigaseki Hotel REIT
- HotelBank, “Hotel REIT Appraisals at 1.25x Acquisition Price — Cap Rate Distribution Across 298 Properties” (regional direct capitalization rates)
- HotelBank, “Hotel Acquisition Debt Capacity: LTV 57–63% on ¥3.0bn for 100 Rooms” (NOI margin for the 100-room model)