

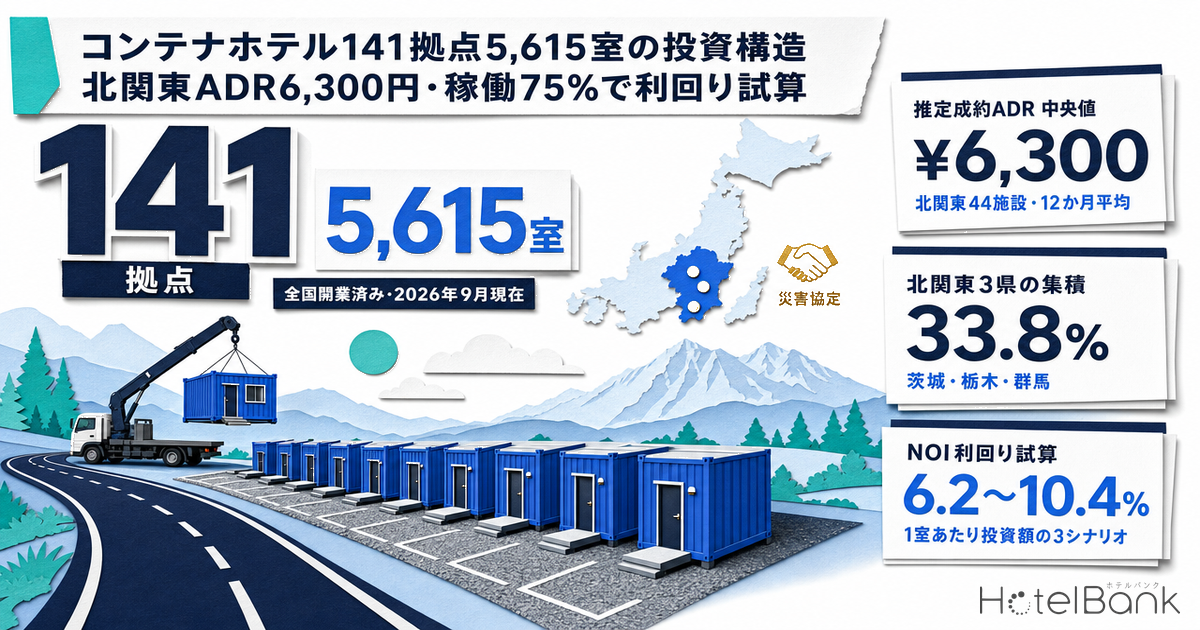
On roadside plots with parking along national and prefectural highways, 13㎡ container modules are lined up, one module per room. These “movable guest rooms” operate as business hotels in normal times; in a disaster, they are trucked to affected areas to serve as temporary lodging or clinic space. According to Develop Co., Ltd. (デベロップ), as of September 2026 the “HOTEL R9 The Yard” chain has 141 sites and 5,615 rooms in operation, and has signed 201 disaster-response agreements with municipalities and other bodies. This article looks at the asset type from three angles: the landowner leasing the site, the buyer of a completed property, and the municipality hosting an industrial park. For the three North Kanto prefectures where the sites cluster, we compiled land prices and zoning at each location, estimated settled ADR and occupancy, and modelled payback periods and yield ranges from per-room investment cost.
Metric Definitions Used in This Article
- ADR (Average Daily Rate): An estimated settled rate (tax-excluded equivalent), calculated by applying segment-specific adjustment factors to each property’s lowest publicly listed plan on OTAs (2 guests per room, per-room price, tax-included). Checked against property-level results disclosed by listed hotel REITs (91 properties, most recent 3 months), the median error is approximately 7%. These are estimates and differ from each property’s actual transaction prices and accounting figures. Area-level ADR is the median of the target properties (the level of a typical property in the area).
- OCC (Occupancy Rate): The ratio of rooms sold to total rooms in the area (an estimate based on OTA sales inventory; consistency checks against REIT monthly disclosures confirm accuracy within roughly a few percentage points). In this article, the same formula is applied to the movable-room property group (target properties in the three North Kanto prefectures), shown as the median and interquartile range of each property’s monthly value. Values for individual properties are not published.
- NOI: Net income after deducting operating costs, ground rent, and property tax, insurance and repair reserves from room revenue (as defined for the modelling in this article).
- Data sources: MetroEngines Research, MLIT Real Estate Information Library, Develop Co., Ltd. published materials
- — Of the 141 sites and 5,615 rooms (as of September 2026, per Develop), 49 sites and 1,897 rooms (33.8%) are concentrated in the three North Kanto prefectures.
- — The estimated settled ADR of 44 North Kanto properties has a median of ¥6,300 (12-month average, September 2025–August 2026), in the same price band as each prefecture’s business hotels (¥6,500–6,700).
- — Occupancy (estimated from OTA-listed inventory) held at a median of around 75% from May to August 2026, after 80.8% in April (47–48 properties).
- — At a total investment of ¥8M per room, the NOI yield is 7.8% with a simple payback of 12.9 years. Even with ADR −10% and occupancy −5pt combined, the yield holds at 6.1% (modelled on this article’s assumptions).
- — The statutory useful life of metal-frame hotel buildings is 17 / 24 / 29 years depending on the frame-member thickness. Being able to relocate the rooms when a fixed-term business land lease expires widens the exit options.
Key Points: One-Third of the 141 Sites Are in North Kanto, Pricing in Line with Prefectural Business Hotels
The sites have a clear centre of gravity. Ibaraki, Tochigi and Gunma together hold 49 sites and 1,897 rooms, or 33.8% of all rooms; adding Chiba brings the total to 2,340 rooms (41.7%). The average site has 39.8 rooms. For the North Kanto target properties (44 properties, 1,646 rooms, with a full 12 months of estimates), the 12-month average estimated settled ADR has a median of ¥6,300 and an interquartile range of ¥5,900–¥6,600. Over the same period, prefecture-level business hotels stood at ¥6,600 in Tochigi, ¥6,700 in Ibaraki and ¥6,500 in Gunma. In other words, a product consisting of a 13㎡ standalone room with parking right outside the door commands the same price band as a typical business hotel in the area.
Occupancy (estimated from OTA-listed inventory) had a median of 80.8% in April 2026 and ran at 74.7–75.0% from May to August. Taking this level as given and setting the per-room investment at three levels between ¥6M and ¥10M, the NOI yield comes to 6.2–10.4% and the simple payback period to 9.6–16.1 years (all assumptions are this article’s own; details below).
The Regulatory Picture for Movable Rooms — Is It a Building, and Over How Many Years Is It Depreciated?
Before any investment decision, it is worth dispelling the common belief that “a container is not a building.” The Ministry of Land, Infrastructure, Transport and Tourism (MLIT) has stated that when a container is used on a continuing basis and installed in a way that does not allow it to be moved at any time and at will, it qualifies as a building under Article 2(1) of the Building Standards Act, judging by its form and actual use (MLIT Housing Bureau notice No. 2174 of December 6, 2004, “Handling of Buildings Using Containers,” and notice No. 5 of December 26, 2014). A structure that qualifies as a building must obtain building confirmation before installation. As long as the modules are fixed to foundations and used as guest rooms, a lodging project should be planned as a building from the outset. Individual determinations are made by the designated administrative agency for the location.
The tax classification can be checked in the National Tax Agency’s “Table of Useful Lives of Major Depreciable Assets.” Metal-frame buildings used as ryokan or hotels fall into three tiers depending on the thickness of the frame members: over 4mm is 29 years, over 3mm up to 4mm is 24 years, and 3mm or less is 17 years. Reinforced-concrete hotels (with wooden interior parts at 30% or less) are 39 years, and wooden ones 17 years. Which tier applies depends on the module specification, so this article does not assume a particular tier. Depending on the tier, annual depreciation on a ¥8M per-room investment ranges from about ¥280k (29 years) to about ¥470k (17 years).
Likewise for fixed-asset (property) tax, whether the rooms are taxed as buildings is decided by the municipality, based on factors such as the installation method and how firmly they are fixed to foundations. The explanation sometimes seen online that “containers are treated as vehicles, so no property tax applies” can change depending on how they are installed, so a business plan should assume prior confirmation with the local municipality. If the rooms are taxed as buildings, the per-room tax burden on hotels is typically in the range of ¥160k–240k a year, which weighs directly on NOI yield.
| Issue | Basis / primary source | Treatment in the investment plan |
|---|---|---|
| Status under the Building Standards Act | Installations used continuously that cannot be moved at any time and at will are buildings (MLIT notice No. 2174) | Schedule the process assuming building confirmation. The designated administrative agency decides |
| Statutory useful life | Metal-frame hotels: 29 / 24 / 17 years by thickness | Confirm the thickness in the module spec sheet before setting the depreciation period |
| Property tax | The municipality decides whether it is a taxable building, based on installation method and other factors | Do not assume “tax-exempt”; consult the local municipality in advance |
| Land rights | A fixed-term business land lease runs from 10 years to less than 50 years (Act on Land and Building Leases, Article 23) | Build the ability to relocate the rooms at lease expiry into the exit design |
The last row captures what is most distinctive about this asset type. With a conventionally built structure, if the lease term is shorter than the depreciation period, the building must be demolished at expiry and the remaining book value is hard to recover. Movable rooms offer the option of hauling them to another site at expiry and continuing to use them. For the landowner, it becomes easier to plan on getting the land back as a cleared lot.
Distribution by Prefecture — 27 Prefectures, with Five Kanto Prefectures Holding 43.9% of Rooms
According to Develop’s published “Rescue Hotel locations and site count” (as of September 2026), the 141 sites in operation span 27 prefectures. By room count, the leaders are Ibaraki (18 sites, 756 rooms), Tochigi (19 sites, 690 rooms), Gunma (12 sites, 451 rooms), Chiba (11 sites, 443 rooms), Fukuoka (8 sites, 355 rooms) and Gifu (8 sites, 290 rooms). The five Kanto prefectures including Saitama total 63 sites and 2,467 rooms, or 43.9% of all rooms. One site each is under development in Fukuoka and Kumamoto; including these, the total is 143 sites and 5,711 rooms.
Openings have continued into 2026: Uozu, Toyama on January 24; Tamba, Hyogo (56 rooms) on February 5; Mobara Mutsuno (67 rooms), the second site in Mobara, Chiba, on March 17; and Motosu, Gifu (43 rooms) on May 13. The Motosu site sits on a prefectural road about 5 minutes by car from Ono-Godo IC on the Tokai-Kanjo Expressway, and a disaster agreement with Motosu City and others was signed the day before it opened. Across the country, the pattern is to choose sites near industrial parks and trunk roads and to pair each opening with an agreement with the local government.
Land Prices and Zoning — Along Trunk Roads in Quasi-Industrial and Residential Zones, Median Land Price ¥33k/㎡
For 50 properties in the three North Kanto prefectures, we matched the zoning district containing each property’s coordinates, and the nearest official land price (chika koji / chika chosa) point, using MLIT’s Real Estate Information Library. The most common zone is the quasi-industrial zone with 12 properties, followed by the quasi-residential, Category 2 residential and Category 1 residential zones with 8 each, commercial zones with 3 and neighbourhood commercial zones with 2. For 9 properties no zoning designation could be confirmed; most of them are in city planning areas without an urbanisation-control boundary (non-delineated city planning areas). Hotels and ryokan can be built in some zones and not in others, and Category 1 residential zones also cap floor area. Even where no zoning is designated, separate limits such as building coverage ratios may apply. Check each candidate site against the city planning map. Opening outside an urbanisation promotion area can also require development permits and farmland-conversion procedures, which lengthen the time to opening.
| Zoning of property site | Properties | Share | How landowners and municipalities should read it |
|---|---|---|---|
| Quasi-industrial zone | 12 | 24% | Along trunk roads mixed with factories and logistics facilities; close to business-travel demand |
| Quasi-residential zone | 8 | 16% | Zones intended for roadside convenience; sits alongside roadside retail |
| Category 2 residential zone | 8 | 16% | Outer edge of residential areas; suits low-rise plans with parking |
| Category 1 residential zone | 8 | 16% | Plans sized to stay within the floor-area limit |
| Commercial / neighbourhood commercial zone | 5 | 10% | Locations closer to town centres |
| No zoning designation confirmed | 9 | 18% | Suburban areas such as non-delineated city planning areas |
We also checked the level of land prices. For the 46 properties with an official land price point within 1km, the median price at the nearest point (2026) was ¥32,700 per ㎡, with an interquartile range of ¥26,500–¥40,200. Of the 45 points with a year-on-year comparison, 26 rose, 10 were flat and 9 fell, for a median of +0.5%. The combination, then, is a low-rise plan pairing rooms with parking in suburbs where land costs around ¥30,000 per ㎡. For example, assuming 70㎡ of site per room, the land value comes to about ¥2.29M. The ground rent of ¥120k a year assumed in the model below is about 5% of that.
Estimated Settled ADR in Host Cities — Utsunomiya ¥7,300, Prefectural Business Hotels ¥6,500–6,700
Next, we look at price levels in the cities that host sites. For the 12 cities in Tochigi with a site, we lined up the 12-month average estimated settled ADR (September 2025–August 2026), for all categories and for business hotels. Across all categories, the figures are Utsunomiya ¥7,300 (N=49–51 properties), Yaita ¥7,300 (N=5–7), Sano ¥7,000 (N=15–17), Kanuma ¥6,600 (N=4–5), Oyama ¥6,300 (N=17–19), Moka ¥5,900 (N=11) and Ashikaga ¥5,800 (N=12–13). Nikko and Nasushiobara include hot-spring and resort properties, so their all-category figures are high; narrowing to business hotels, they come to around ¥10,000 and ¥6,400 respectively. The price tiers across Tochigi’s cities and towns are examined in depth in Tochigi Hotel ADR: 3.6x City Gap.
| City | Sites | ADR, all categories | N | ADR, business hotels | N |
|---|---|---|---|---|---|
| Utsunomiya | 1 | ¥7,300 | 49–51 | ¥7,136 | 40–42 |
| Yaita | 1 | ¥7,257 | 5–7 | ¥6,880 | 4 |
| Sano | 1 | ¥6,991 | 15–17 | ¥7,327 | 9 |
| Tochigi City | 1 | ¥6,854 | 9–10 | ¥6,531 | 4–5 |
| Kanuma | 3 | ¥6,592 | 4–5 | ¥6,586 | 4 |
| Oyama | 3 | ¥6,296 | 17–19 | ¥6,458 | 14–15 |
| Moka | 3 | ¥5,891 | 11 | ¥6,018 | 8 |
| Ashikaga | 2 | ¥5,787 | 12–13 | ¥5,638 | 10–11 |
| Otawara | 1 | ¥5,726 | 8–9 | ¥5,113 | 5 |
| Sakura | 1 | ¥7,780 | 7–9 | ¥6,150 | 3 |
| Nasushiobara | 1 | ¥13,845 | 63–70 | ¥6,386 | 15–16 |
| Nikko | 1 | ¥17,948 | 112–123 | ¥10,036 | 9–11 |
We also checked the pricing of the movable-room property group itself. For the 44 properties (1,646 rooms) in the three North Kanto prefectures with a full 12 months of estimates, the chart below overlays each month’s median on the prefectural business hotels. The group’s monthly median moved in a ¥5,400–¥7,000 range, with a 12-month average of ¥6,300. The seasonal shape — peaks in November 2025, May 2026 and August 2026, and troughs in January and June 2026 — tracks the business hotels of the three prefectures almost exactly. By prefecture, the median is ¥6,200 for the 18 properties in Tochigi, ¥6,400 for the 14 in Ibaraki and ¥6,200 for the 12 in Gunma.
Prefectural business hotels are also rising. The year-on-year change in the 12-month average was +1.8% in Tochigi, +3.3% in Ibaraki and +3.4% in Gunma. When surrounding market rates rise, movable-room properties sitting in the same price band gain room to raise their own rates. That is why the sensitivity analysis below moves ADR both up and down. Develop also publishes its rate for deploying the units as Rescue Hotels: “from ¥7,000 per room per day (tax-excluded, standard specification)” — roughly the same level as the normal-time estimated settled ADR.
Occupancy — 80.8% in April, Steady Around 75% from May to August
Occupancy (estimated from OTA-listed inventory) can be compiled for the North Kanto property group from April 2026 (47–48 properties / 1,774–1,839 rooms, based on listings on major booking sites). The median of each property’s monthly value was 80.8% in April (interquartile range 76.3–84.0%), 74.8% in May, 74.9% in June, 75.0% in July and 74.7% in August (69.4–77.8%). The room-weighted figures, at 73.6–80.4%, differ little from the median. The numbers reflect locations whose floor is supported less by tourism seasonality than by weekday business travel for factories, logistics and construction.
This occupancy rate is an estimate based on how OTA-listed inventory sells through, and differs from the actual property-wide occupancy. At properties with a high share of corporate contracts or direct sales, the estimate can swing depending on how much inventory is released to OTAs. The model sets occupancy at 75% and tests a sensitivity of ±5pt.
Per-Room Payback Model — ¥8M per Room Yields 7.8% with a 12.9-Year Payback
From here on, we model a single room as the unit of investment. Per-room development costs are not published. Develop says its approach cuts development costs by 40% compared with conventional construction, but does not state the baseline amount. This article therefore sets the total investment per room (including the module, foundations, exterior works, equipment and pre-opening costs) at three assumed levels: ¥6M, ¥8M and ¥10M. Figures compiled from MLIT’s Statistics on Building Construction Starts show hotel construction costs per tsubo rising by about 40% between 2022 and 2024, so the appropriate investment figure also depends on when the property is built.
| Assumption (all assumed by this article) | Value used | Basis |
|---|---|---|
| ADR | ¥6,300 | Median estimated settled ADR of 44 North Kanto properties (12-month average) |
| Occupancy | 75% | Property-group median, May–August 2026 (74.7–75.0%) |
| GOP margin | 50% | A conservative level for limited-service hotels (after operating costs; this article’s assumption) |
| Ground rent (fixed-term business land lease) | ¥120k/room/yr | ¥400k a month for 40 rooms. About 5% of 70㎡ per room at a land price of ¥33k/㎡ |
| Property tax, insurance and repair reserves | ¥120k/room/yr | Booked conservatively as a fixed amount, since it varies with whether building tax applies |
| Total investment per room | ¥6M / ¥8M / ¥10M | Not published; three levels used to show the range |
On these assumptions, annual room revenue per room is ¥1.725M, GOP is ¥862k, and NOI after ground rent and fixed costs is ¥622k. Construction cost is examined in two stages: first at the investment amount set at current levels (Stage 1), and then with a year of +5% materials and labour cost inflation during construction built in (Stage 2). Because the modules are factory-built and on-site work is mainly installation, the construction period is assumed to be within one year. The shorter build time compared with conventional construction also shortens the window of exposure to rising construction costs.
| Per room | A. ¥6M | B. ¥8M | C. ¥10M |
|---|---|---|---|
| Annual room revenue | ¥1.725M | ¥1.725M | ¥1.725M |
| GOP (50%) | ¥862k | ¥862k | ¥862k |
| NOI (after ground rent and fixed costs) | ¥622k | ¥622k | ¥622k |
| NOI yield (Stage 1) | 10.4% | 7.8% | 6.2% |
| Simple payback (Stage 1) | 9.6 yrs | 12.9 yrs | 16.1 yrs |
| Investment (Stage 2, +5%) | ¥6.3M | ¥8.4M | ¥10.5M |
| NOI yield (Stage 2) | 9.9% | 7.4% | 5.9% |
| Simple payback (Stage 2) | 10.1 yrs | 13.5 yrs | 16.9 yrs |
| Scenario | Annual NOI/room | A. ¥6M | B. ¥8M | C. ¥10M |
|---|---|---|---|---|
| Base (ADR ¥6,300, occupancy 75% = property-group median, May–August 2026) | ¥622k | 10.4% | 7.8% | 6.2% |
| ADR −10% | ¥536k | 8.9% | 6.7% | 5.4% |
| Occupancy −5pt | ¥565k | 9.4% | 7.1% | 5.6% |
| ADR −10%, occupancy −5pt | ¥484k | 8.1% | 6.1% | 4.8% |
| Occupancy +5pt (80%, close to the April level) | ¥680k | 11.3% | 8.5% | 6.8% |
It is also worth looking at the range when ADR and occupancy move together. For the ¥8M plan (Stage 1), varying ADR by ±10% and occupancy across 65–85% in five steps each, the NOI yield falls between 5.4% and 10.4%. If occupancy reaches 80%, on a par with April 2026, the plan still secures 7.3% even with a 10% drop in ADR. On the other hand, the combination of 65% occupancy and ADR −10% drags the yield down to 5.4%, so at acquisition the depth of business-travel demand should be verified site by site.
| ADR \ Occupancy | 65% | 70% | 75% | 80% | 85% |
|---|---|---|---|---|---|
| ¥5,670 (−10%) | 5.4% | 6.1% | 6.7% | 7.3% | 8.0% |
| ¥5,985 (−5%) | 5.9% | 6.6% | 7.2% | 7.9% | 8.6% |
| ¥6,300 (base) | 6.3% | 7.1% | 7.8% | 8.5% | 9.2% |
| ¥6,615 (+5%) | 6.8% | 7.6% | 8.3% | 9.1% | 9.8% |
| ¥6,930 (+10%) | 7.3% | 8.1% | 8.9% | 9.6% | 10.4% |
Even in the tougher case where ADR falls 10% and occupancy 5pt, the ¥8M plan keeps an NOI yield of 6.1%. Conversely, running at 80% — close to April’s occupancy — lifts it to 8.5%. Setting the payback period against the depreciation period, the 12.9-year payback of the ¥8M plan fits within the 24 years (over 3mm up to 4mm) or 29 years (over 4mm) for metal-frame hotels. If the fixed-term business land lease is set at 20 years, the income from the remaining years after payback, plus the value of relocating the rooms and continuing to use them when the lease expires, become additional sources of return. Transport and foundation costs for relocation are not included in this model, so they should be estimated separately in an actual plan.
Landowners
At a ground rent of ¥120k/room/yr
¥4.8M a year for 40 rooms. At the end of a fixed-term business land lease, the rooms can be planned to be hauled away, making it easier to choose the land’s next use.
Buyers of Completed Properties
NOI yield range of 6–10%
The yield moves sharply with the per-room acquisition price. Confirming the thickness tier and building-tax treatment before acquisition makes the model more accurate.
Municipalities with Industrial Parks
Capacity for weekday business travel + disaster agreements
Lodging infrastructure running at around 75% occupancy (May–August 2026, estimated) gains an added function as temporary shelter in a disaster.
Exit via Sale on Completion — A Capitalised Value Range of ¥7.8M–10.4M per Room
Movable rooms already have real transactions that separate development from ownership. LIFULL Investment (formerly LIFULL Social Funding) acquired “HOTEL R9 The Yard Yaita” (49 rooms) in Yaita, Tochigi in January 2020, and “HOTEL R9 The Yard Yabuki” (46 rooms) in Yabuki, Fukushima on January 31, 2025, both on completion. Develop handled development, and after acquisition the properties are subleased back to and operated by Develop. Neither acquisition price nor yield has been disclosed for either deal.
From the developer’s perspective, selling on completion recovers development capital early so it can be redeployed into the next site. From the buyer’s perspective, it allows investment in local lodging infrastructure while the sublease limits ramp-up risk before the property is operating. For reference, capitalising the NOI above (¥622k per room) gives a per-room value of ¥10.37M at a 6% cap rate, ¥8.89M at 7% and ¥7.78M at 8%. The gap between the sale price and the total investment corresponds to the developer’s profit, and the cap rate to the buyer’s yield. Note that in an actual sublease transaction the buyer receives rent rather than operating NOI, and cap rate levels vary from deal to deal. The figures below are not transaction comparables but indications based on this article’s assumptions.
| Cap rate (assumed) | Value per room | 40-room equivalent | vs. ¥8M/room total investment |
|---|---|---|---|
| 6.0% | ¥10.37M | ¥415M | +¥2.37M/room |
| 7.0% | ¥8.89M | ¥356M | +¥890k/room |
| 8.0% | ¥7.78M | ¥311M | −¥220k/room |
For a plan with a total investment of ¥8M, a sale at a cap rate in the 7% range or lower still leaves a development profit. What drives the cap rate is the depth of business-travel demand at the location, the remaining lease term, and how buyers value the fact that the asset can be relocated. Even as the remaining lease term shortens, if the rooms can keep being used on another site, there is room to assume a slower erosion of building value than for conventional construction.
Disaster Agreements as Non-Financial Value — 201 in Total: Chiba 34, Ibaraki 19, Saitama 17
Develop reports 201 disaster agreements (as of September 2026). By prefecture, the counts are Chiba 34, Ibaraki 19, Saitama 17, Gunma 15, Tochigi 11, Kagoshima 10, Gifu 9 and Fukuoka 9 — concentrated in Kanto, where the sites cluster. The agreement with Gunma Prefecture was signed on March 19, 2025, and the company announced it as its first agreement at the prefectural level. There is also an agreement with MLIT’s Kanto Regional Development Bureau.
Actual deployments have centred on the response to COVID-19. Starting with the cruise ship response in Nagasaki in April 2020, units were deployed for a PCR testing centre in Mitaka, to strengthen PCR testing in Chiyoda Ward, for PCR testing facilities at private hospitals in Tokyo, and as ancillary facilities for temporary medical facilities in Tokyo and Chiba; in January 2022, 126 units were provided to Tochigi Prefecture for a temporary medical facility in response to the Omicron variant. In normal times, rooms are brought to comprehensive disaster drills in various regions.
From an investment perspective, the agreements themselves generate no direct revenue. On the other hand, the relationships with municipalities built through them can become touchpoints that lead to information on sites and consultations on using public land. Becoming a lodging facility positioned within a local disaster-prevention plan can also support the asset’s value as a long-term holding. While rooms are deployed in a disaster, normal-time room revenue stops, so the economics should be checked together with the deployment rate (published as from ¥7,000 per room per day, tax-excluded).
Summary
Movable rooms, built by lining up container modules one per room, numbered 141 sites and 5,615 rooms in operation as of September 2026, with one-third of the rooms concentrated in the three North Kanto prefectures. The sites sit mainly along trunk roads in quasi-industrial and residential zones, and the median nearest land price is ¥32,700 per ㎡. The North Kanto property group has a median estimated settled ADR of ¥6,300, in the same price band as prefectural business hotels (¥6,500–6,700). Estimated occupancy ran at around 75% from May to August 2026.
On this rate and occupancy, a plan with a total investment of ¥8M per room yields 7.8% NOI with a 12.9-year payback, and holds 6.1% even with ADR −10% and occupancy −5pt. Combined with a fixed-term business land lease, the ability to relocate the rooms at lease expiry widens the landowner’s options, and there are real transactions that separate development from ownership through a sale on completion. When evaluating a project, settling three points early — the useful-life tier set by frame-member thickness, the building-tax treatment, and relocation costs — will sharpen the accuracy of the model.
Note on the model: The investment model in this article is a simplified calculation based on estimated settled ADR and occupancy observed up to the time of research (September 2026) and on assumptions set by this article. Development costs, ground rent, fixed costs and cap rates are not published figures. Borrowing terms, tax effects, relocation costs and the economics during disaster deployments are not included. Actual investment decisions require a detailed feasibility study based on the specific site and specifications.
Related Articles
References and Sources
■ Data Sources
Estimated settled ADR and occupancy are estimates calculated by MetroEngines Research & Consulting by observing listed prices and inventory on major booking sites. The target is the movable-room property group in the three North Kanto prefectures (Tochigi, Ibaraki, Gunma): ADR covers the 44 properties / 1,646 rooms with a full 12 months of estimates (September 2025–August 2026), and occupancy covers the 47–48 properties with observation coverage of 80% or more (April–August 2026). Site counts, room counts and the number of disaster agreements are Develop’s published figures (as of September 2026); zoning and land prices are from MLIT’s Real Estate Information Library (50 properties; land prices for the 46 properties with a point within 1km).
■ Modelling Assumptions
Per room, we set ADR at ¥6,300, occupancy at 75% (property-group median, May–August 2026), GOP margin at 50%, ground rent at ¥120k a year and property tax etc. at ¥120k a year, with total investment at three levels of ¥6M / ¥8M / ¥10M (Stage 2 adds +5% to construction cost). NOI yield = NOI ÷ total investment; simple payback = total investment ÷ NOI; value per room = NOI ÷ cap rate (6–8%). The two-way sensitivity is calculated with ADR ±10% and occupancy of 65–85%. All are this article’s assumptions, not published figures.
■ Limitations and Caveats
Estimated settled ADR and occupancy are estimates based on OTA-listed inventory, and may diverge from actual results at properties with a high share of corporate contracts or direct sales. Borrowing terms, tax effects, depreciation, relocation costs and the economics during disaster deployments are not included in the model. The useful-life tier and building-tax treatment vary with the module specification and the judgement of the local municipality. Values for individual properties are not published.
■ Market Data
- MetroEngines Research & Consulting — Estimated settled ADR (September 2025–August 2026), occupancy (estimated from OTA-listed inventory, April–August 2026), property locations
■ Government and Public Sources
- MLIT, “Handling of Buildings Using Containers” (notice No. 2174 / No. 5, in Japanese)
- National Tax Agency, “Table of Useful Lives of Major Depreciable Assets” (in Japanese)
- MLIT Real Estate Information Library — official land prices, zoning
- MLIT, “Statistics on Building Construction Starts” (in Japanese)
■ Company Disclosures and Press Releases
- Develop Co., Ltd., “Sites and Number of Disaster Agreements” (as of September 2026, in Japanese)
- Develop Co., Ltd., “Rescue Hotel Deployment Cases” (in Japanese)
- Develop Co., Ltd., “Rescue Hotel Specifications” (in Japanese)
- Develop: “HOTEL R9 The Yard” series reaches 100 hotels (March 27, 2025, in Japanese)
- Develop signs “Rescue Hotel” disaster agreement with Gunma Prefecture (March 19, 2025, in Japanese)
- Develop provides 126 units to Tochigi Prefecture as a temporary medical facility (in Japanese)
- Develop: “HOTEL R9 The Yard Motosu” opens May 13, 2026 (in Japanese)
- Develop: “HOTEL R9 The Yard Mobara Mutsuno” opens March 17, 2026 (in Japanese)
- Develop: “HOTEL R9 The Yard Tamba” opens February 5, 2026 (in Japanese)
- Develop: “HOTEL R9 The Yard Uozu” grand opening, January 24, 2026 (in Japanese)
- LIFULL Investment acquires “HOTEL R9 The Yard Yabuki” (announced February 27, 2025, in Japanese)
- LIFULL Social Funding acquires “HOTEL R9 The Yard Yaita” (January 2020, in Japanese)
■ Industry Sources