

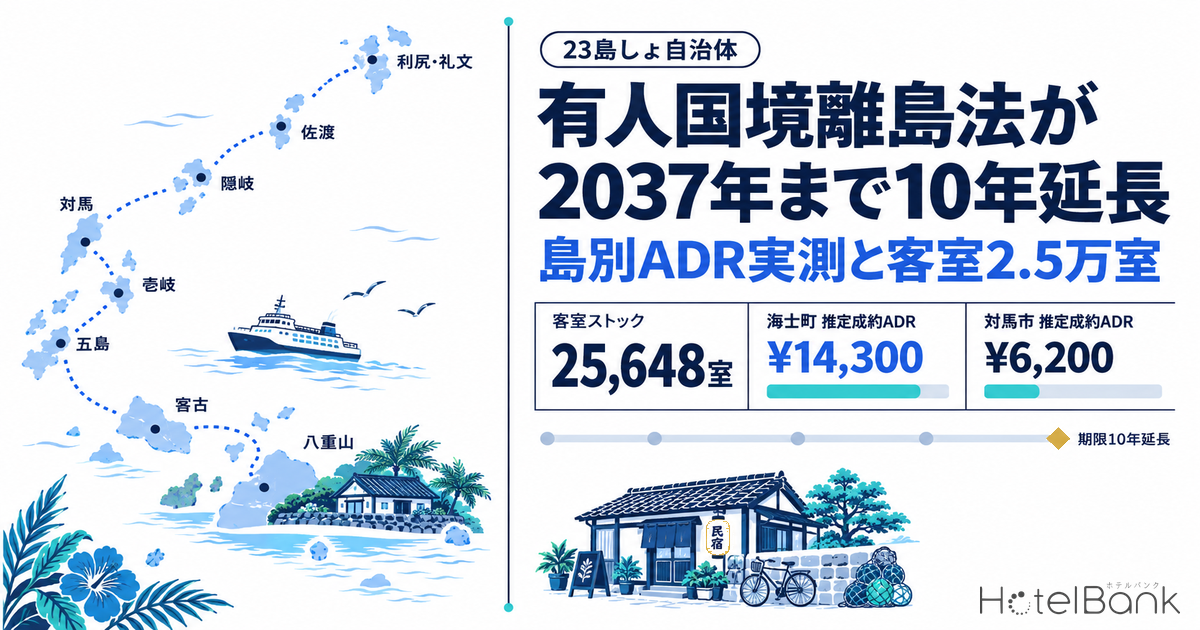
On July 8, 2026, Japan’s House of Councillors passed the amended Act on Inhabited Remote Border Islands (有人国境離島法) into law. The act, which was due to expire at the end of March 2027, now runs for another ten years to the end of March 2037. At the same time, six islands were newly added to the support program: Teuri and Yagishiri (Haboro Town, Hokkaido), Tobishima (Sakata City, Yamagata), Niijima and Shikinejima (Niijima Village, Tokyo) and Awashima (Awashimaura Village, Niigata). Moving the program’s end date ten years out also moves a basic assumption for anyone financing an island lodging: how long a payback period can realistically be planned.
This article lays out, for the 23 island municipalities covered by the act’s support program, the room stock tracked by MetroEngines Research & Consulting (2,083 properties, 25,648 rooms) alongside measured estimated settled ADR. It then estimates the maximum investment per room that a ten-year policy horizon can justify.
Metric Definitions Used in This Article
- ADR (average daily rate): Estimated settled rate (tax-excluded equivalent), calculated by applying property-type correction coefficients to the lowest published plan level on major booking sites (two guests per room, per-room rate, tax included). Checked against property-level results disclosed by listed hotel REITs (91 properties, most recent three months), the median error is about 7%. These are estimates and differ from each property’s actual settled prices and accounting figures. Area-level ADR is the median of the properties covered (the level of a typical property in the area); this article uses the average over the latest 12 months (September 2025 to August 2026).
- Listed price: The average across all plans on major booking sites (room-only through meal-inclusive; two guests per room, per-room rate, tax included). Its basis differs from ADR, so do not compare the two directly.
- Room stock: The total number of lodging properties and rooms within the scope tracked by MetroEngines Research. It is not a census and does not cover every facility licensed under the Hotel Business Act.
- Data source: MetroEngines Research & Consulting
- — The amended act was enacted on July 8, 2026, extending its expiry by ten years from end-March 2027 to end-March 2037. Investors now have a ten-year window in which payback periods can be planned with the program behind them.
- — Room stock across the 23 island municipalities totals 2,083 properties and 25,648 rooms. The five Nansei Islands municipalities hold 63.8% of rooms, and Miyakojima and Ishigaki alone hold 57.1%: under the same program, market sizes differ by an order of magnitude.
- — Estimated settled ADR spans 2.3x, from ¥14,300 in Ama Town to ¥6,200 in Tsushima. The Nansei Islands run 1.10–1.28x above Naha (¥10,198), while the Sea of Japan side sits at only 62–83% of its prefectural capitals.
- — New supply over four years totals 223 properties and 2,117 rooms, and 85.2% have 10 rooms or fewer. The 136 vacation rentals and cottages average 2.0 rooms: island supply has already fragmented into small units.
- — The investment that pays back in ten years is ¥3.0M–¥9.3M per room (at an assumed occupancy of 45–65%). New construction at ¥21.18M–34.03M per room is 2.7–5.7x higher, so what the program supports is not new builds but the revival of existing stock.
What the Ten-Year Extension Settles: Expiry, Covered Islands and a ¥5.5 Billion Grant
The core of the amendment is simple. The act took effect in April 2017 as ten-year sunset legislation, expiring on March 31, 2027. The amendment pushes that date to March 31, 2037, and adds six islands to the support program.
First, the program’s scope. According to the Cabinet Office, the inhabited remote border island areas comprise 29 areas and 148 islands. Of these, the areas where continued habitation is considered especially necessary are designated as “Specified Inhabited Remote Border Island Areas” (15 areas, 71 islands) and have been eligible for the grant. The six newly added islands join this specified category.
Funding comes from the Grant for Sustaining Communities in Specified Inhabited Remote Border Island Areas, budgeted at ¥5.5 billion for FY2026. Its uses fall into four broad types.
| Program type | Main content | Relevance to lodging |
|---|---|---|
| Lower sea and air fares | Cuts fares for island residents to the level of equivalent JR rail / Shinkansen fares | Indirect (staff travel costs). Tourist fares are not covered |
| Lower freight costs | Subsidizes sea and air shipping of daily necessities | Indirect. Construction materials are not covered |
| Expanding job opportunities | Supports capital spending for start-ups and business expansions that add jobs, plus up to five years of working capital | Direct. Starting a lodging business or renovating a building can qualify |
| Promoting longer-stay tourism | Developing overnight travel products (stay packages) and improving the local tourism services that make them up | Supports demand and product development. Building new lodging facilities is not covered |
Source: Compiled by MetroEngines Research & Consulting from the Cabinet Office program overview of the Grant for Sustaining Communities in Specified Inhabited Remote Border Island Areas and MLIT FY2026 budget materials
This is where misunderstandings tend to arise. The grant is not a construction subsidy for building new hotels or ryokan. The part that can reach capital spending on lodging directly is the “expanding job opportunities” track, which covers equipment and building renovation costs for start-ups or business expansions that add jobs. Municipalities publish the amounts in their calls for applications. In the FY2024 call by Mishima Village, Kagoshima, a start-up was capped at ¥6M in eligible costs with a subsidy cap of ¥4.5M; a business expansion with capital investment at ¥16M in costs and a ¥12M subsidy cap; and other expansions at ¥12M in costs and a ¥9M subsidy cap. Each municipality sets its own caps, so terms differ from island to island.
In other words, against a new-build project costing several hundred million yen per building, a ¥12M subsidy cap is roughly the most this program will contribute. What it supports is less the building itself than the handicap of starting a business on an island and keeping people employed there. Cumulative new jobs created under it reached 1,704 by FY2021.
Room Stock Across 23 Island Municipalities Is 25,648 Rooms, Over 60% in the Nansei Islands
Now to translate the policy into physical room stock. Within the scope tracked by MetroEngines Research, the 23 island municipalities covered by the act have 2,083 properties and 25,648 rooms. They are not evenly distributed.
| Island group | Municipalities | Properties | Rooms | Room share |
|---|---|---|---|---|
| Nansei Islands (Miyako, Yaeyama, Yonaguni, Tarama) | 5 | 1,182 | 16,351 | 63.8% |
| Sea of Japan / Tsushima Strait side (Tsushima, Iki, Goto, Oki, Sado, Rishiri-Rebun) | 13 | 701 | 8,006 | 31.2% |
| Municipalities of the six newly added islands | 4 | 134 | 893 | 3.5% |
| Ogasawara Village | 1 | 66 | 398 | 1.6% |
Source: MetroEngines Research & Consulting (tracked basis, 23 municipalities, 2,083 properties)
The five Nansei Islands municipalities alone hold 63.8% of rooms. Miyakojima (7,641 rooms) and Ishigaki (6,993 rooms) together account for 57.1% of the total: under the same program umbrella, the markets differ in scale by an order of magnitude. The 13 Sea of Japan-side municipalities combined have 8,006 rooms, just 365 more than Miyakojima alone (7,641).
Source: MetroEngines Research & Consulting
Estimated Settled ADR by Island: 2.3x Between Top and Bottom
Next, rates. The chart below ranks estimated settled ADR for the latest 12 months (September 2025 to August 2026) by island municipality.
Source: MetroEngines Research & Consulting (estimated settled ADR, latest 12-month average)
The top is Ama Town at ¥14,300 and the bottom Tsushima at ¥6,200, a gap of only 2.3x. Compared with ADR gaps in cities this is a compressed distribution: island markets have shallow price tiers (for how price tiers form on the major remote islands, see Autumn on Japan’s Islands: 2.37x ADR Gap Across 10 Municipalities). Note, however, that Ama, Nishinoshima, Yonaguni, Haboro, Rebun and Rishiri each have fewer than eight properties underlying the estimate, so the pricing of a handful of properties moves the average directly. Read these figures as ranges.
Among markets with more stable sample sizes are Miyakojima at ¥13,000 (+12.4% YoY), Taketomi at ¥12,900 (+2.5%), Ishigaki at ¥11,200 (+7.0%) and Sado at ¥10,300 (+9.0%). Miyakojima shows the strongest growth. On the Sea of Japan side, Tsushima is low at ¥6,200 but up 5.6% YoY, and Goto is at ¥7,600, up 12.2%, so rising markets exist there too.
| Island municipality | Properties | Rooms | Listed N | ADR N | Est. settled ADR | YoY | Listed price |
|---|---|---|---|---|---|---|---|
| Miyakojima City | 506 | 7,641 | 307 | 76 | ¥13,024 | +12.4% | ¥25,887 |
| Ishigaki City | 475 | 6,993 | 298 | 60 | ¥11,227 | +7.0% | ¥24,010 |
| Taketomi Town | 157 | 1,410 | 57 | 20 | ¥12,914 | +2.5% | ¥24,121 |
| Yonaguni Town | 36 | 270 | 14 | 1 | ¥9,142※ | — | ¥24,106 |
| Tarama Village | 8 | 37 | — | — | — | — | — |
| Sado City | 168 | 2,067 | 72 | 27 | ¥10,306 | +9.0% | ¥23,697 |
| Okinoshima Town | 36 | 438 | 18 | 10 | ¥8,976 | +10.8% | ¥20,053 |
| Ama Town | 18 | 109 | 7 | 2 | ¥14,281※ | +0.1% | ¥29,902 |
| Nishinoshima Town | 19 | 147 | 5 | 4 | ¥10,475※ | +7.7% | ¥28,295 |
| Chibu Village | 5 | 19 | — | — | — | — | — |
| Tsushima City | 94 | 1,459 | 36 | 10 | ¥6,189 | +5.6% | ¥15,806 |
| Iki City | 90 | 851 | 53 | 17 | ¥7,995 | -4.2% | ¥22,335 |
| Goto City | 124 | 1,065 | 66 | 19 | ¥7,610 | +12.2% | ¥20,032 |
| Shin-Kamigoto Town | 56 | 573 | 18 | 8 | ¥8,254 | +8.5% | ¥21,950 |
| Ojika Town | 15 | 72 | 3 | 0 | — | — | ¥30,127 |
| Rishirifuji Town | 27 | 452 | 13 | 11 | ¥8,390 | +4.7% | ¥23,176 |
| Rishiri Town | 15 | 240 | 7 | 3 | ¥13,760※ | +39.2% | ¥20,521 |
| Rebun Town | 34 | 514 | 14 | 6 | ¥9,412※ | +1.9% | ¥24,608 |
| Ogasawara Village | 66 | 398 | 3 | 0 | — | — | ¥31,218 |
| Niijima Village (Niijima & Shikinejima) | 75 | 530 | 8 | 0 | — | — | ¥29,576 |
| Awashimaura Village (Awashima) | 28 | 114 | — | — | — | — | — |
| Haboro Town (Teuri & Yagishiri) | 17 | 181 | 4 | 4 | ¥6,866※ | +4.4% | ¥18,437 |
| Sakata City (Tobishima) | 14 | 68 | 21 | 15 | ¥6,211 | +8.8% | ¥16,155 |
※ marks municipalities where fewer than eight properties feed the ADR estimate, so the estimate range is wide. Where Listed N and ADR N are blank, prices could not be observed on major booking sites. Source: MetroEngines Research & Consulting (latest 12-month average; rooms on a tracked basis)
Against the Mainland in the Same Prefecture: Nansei Islands Beat the Capital, Sea of Japan Side at 60–80%
Set against the mainland of the same prefecture, the island markets split in character. The table below compares them with each prefectural capital using the same definition and the same period (latest 12 months).
| Prefecture | Capital city ADR | Island side (representative) | vs. capital | Other island municipalities in the prefecture | vs. capital |
|---|---|---|---|---|---|
| Okinawa | Naha City ¥10,198 | Miyakojima City ¥13,024 | 1.28x | Ishigaki City ¥11,227 / Taketomi Town ¥12,914 | 1.10–1.27x |
| Nagasaki | Nagasaki City ¥9,952 | Tsushima City ¥6,189 | 0.62x | Iki City ¥7,995 / Goto City ¥7,610 / Shin-Kamigoto Town ¥8,254 | 0.76–0.83x |
| Shimane | Matsue City ¥12,699 | Okinoshima Town ¥8,976 | 0.71x | Ama Town ¥14,281 (N=2, wide range) | 1.12x |
Source: MetroEngines Research & Consulting (estimated settled ADR, monthly average over the latest 12 months = September 2025 to August 2026. ADR N: Naha 143, Nagasaki 64, Matsue 56, Miyakojima 76, Ishigaki 60, Taketomi 20, Tsushima 10, Iki 17, Goto 19, Shin-Kamigoto 8, Okinoshima 10, Ama 2)
All three Nansei Islands municipalities exceed Naha. Miyakojima is at 1.28x and Taketomi at 1.27x: the islands price above the prefectural capital. In markets where resort demand sets prices, pricing works differently from urban lodging demand. The Sea of Japan side is the reverse, with Tsushima at 0.62x Nagasaki City and Okinoshima at 0.71x Matsue. Only Ama Town exceeds Matsue, at 1.12x, but its ADR rests on just two properties, so the pricing of a few properties moves the average directly and the figure should be discounted accordingly.
This comparison matters for investment decisions in the per-room investment ceiling estimated later. Between the Nansei Islands, where rates above the prefectural capital hold, and the Sea of Japan side, stuck at 60–70% of the capital, the investment justified over the same ten-year horizon differs by more than double.
The Six Added Islands: 893 Rooms and What It Means When Prices Cannot Be Observed
The municipalities of the six newly added islands account for just 3.5% of rooms. Yet this small scale is exactly the kind of place the program is designed for.
| Added island | Municipality | Tracked properties | Rooms | Est. settled ADR |
|---|---|---|---|---|
| Niijima & Shikinejima | Niijima Village, Tokyo | 75 | 530 | — (listed price ¥29,600) |
| Teuri & Yagishiri | Haboro Town, Hokkaido | 17 | 181 | ¥6,900 (whole town, N=4) |
| Awashima | Awashimaura Village, Niigata | 28 | 114 | — (no price observations) |
| Tobishima | Sakata City, Yamagata | 14 | 68 | ¥6,200 (whole city, N=15) |
Source: MetroEngines Research & Consulting (tracked basis). ADR for Haboro and Sakata covers the whole municipality including mainland properties, not island properties alone
In Awashimaura we track 28 properties and 114 rooms, but prices cannot be observed continuously on major booking sites. That does not mean there is no demand. In markets that run on booking channels outside online listings, such as phone calls, direct bookings and minshuku associations, price data is simply never generated. Missing data is not the same as a missing market. Put the other way, building online listings on such islands is itself an opportunity to make rates and occupancy visible.
Niijima Village and Ogasawara Village are similar: we track 75 and 66 properties respectively, but not enough of them fall into the property-type categories validated for the ADR calculation. Listed prices (all-plan average) of ¥29,600 and ¥31,200 respectively are observed, but because the basis differs they cannot be compared side by side with the ADR in this article.
New Supply in Practice: 223 Openings in Four Years, 85% with 10 Rooms or Fewer
How has supply moved? From 2023 to 2026 (up to the survey date), 223 lodging openings totaling 2,117 rooms were confirmed across the 23 municipalities, an average of 9.5 rooms per property.
Source: MetroEngines Research & Consulting (based on confirmed online listings, N=223 properties). Listings appear a few months before opening, so the 2026 figure is expected to rise as more listings go live
What this distribution shows is that new island supply has fragmented into small units. Of the 223 openings, 190 (85.2%) have 10 rooms or fewer. By type, 136 properties (113 vacation rentals, 22 cottages and one glamping site) average 2.0 rooms, so small formats of one to a few rooms make up the majority. Only 14 projects have 30 or more rooms (1,372 rooms in total), and 12 of those are concentrated in Miyakojima and Ishigaki, where large-scale supply, including resort condominiums sold to individual investors, continues to arrive.
Limited to the 18 municipalities outside the Nansei Islands, openings over four years total 64 properties and 260 rooms, an average of just 4.1 rooms each. What is happening on the Sea of Japan side and the northern islands is not hotel development but the conversion of vacant houses and existing buildings into lodgings of one to five rooms. That is consistent with the investment estimate below.
Source: MetroEngines Research & Consulting (bubble size = tracked properties; horizontal axis on a log scale)
Plotting room stock against estimated settled ADR shows no clear correlation between scale and rate. Ama Town has 109 rooms at ¥14,300, Taketomi 1,410 rooms at ¥12,900 and Tsushima 1,459 rooms at ¥6,200. Rather than economies of scale failing to lift rates, it is closer to reality to say that the nature of demand differs from island to island. Some islands sustain high rates despite small scale, while others hold substantial stock but remain stuck in a low rate band. The latter are where reviving existing stock could still lift the rate band a notch.
A Ten-Year Horizon Justifies ¥3.0M–¥9.3M of Investment per Room
Now to the main question. With the program extended to March 2037, investment in island lodging can be planned around a ten-year payback with the program behind it. So how much investment can be recovered in ten years?
The assumptions are as follows. We take the simple view that an investment is recovered in ten years if annual GOP (gross operating profit) equals 10% of the investment, and derive the per-room investment ceiling with this formula.
The 30% GOP margin takes as reference the 38.9% GOP achieved by the 91 operator-managed properties disclosed by Invincible Investment Corporation (インヴィンシブル投資法人) for the period ended December 2024, set conservatively for small island properties that struggle to absorb fixed costs. Sensitivity is tested at three assumed occupancy levels: 45%, 55% and 65%.
Source: MetroEngines Research & Consulting estimates (assumptions: 30% GOP margin, 10-year payback; occupancy of 45%, 55% and 65% are assumed full-year values. ADR is the latest 12-month average, September 2025 to August 2026)
| ADR band | Occ. 45% | Occ. 55% | Occ. 65% | New-build cost per room | Gap (vs. 55% occ.) |
|---|---|---|---|---|---|
| Tsushima-Tobishima band Est. settled ADR ¥6,200 | ¥3.06M | ¥3.73M | ¥4.41M | ¥21.18M–34.03M | 5.7x |
| Goto-Rishiri band Est. settled ADR ¥8,300 | ¥4.09M | ¥5.00M | ¥5.91M | ¥21.18M–34.03M | 4.2x |
| Sado-Nishinoshima band Est. settled ADR ¥10,300 | ¥5.08M | ¥6.20M | ¥7.33M | ¥21.18M–34.03M | 3.4x |
| Miyako-Taketomi band Est. settled ADR ¥13,000 | ¥6.41M | ¥7.83M | ¥9.25M | ¥21.18M–34.03M | 2.7x |
New-build cost assumes ¥2.0M–2.5M per tsubo (3.3㎡) and 35–45㎡ of gross floor area per room (including common areas). The per-tsubo cost is an assumed range reflecting recent hotel construction costs. It excludes island-specific premiums for shipping materials and bringing in tradespeople. Source: MetroEngines Research & Consulting estimates
The conclusion is clear. At an assumed 55% occupancy (full-year basis), the per-room investment that pays back in ten years is ¥7.83M in the highest band, Miyako-Taketomi, and only ¥3.73M in the Tsushima-Tobishima band. New hotel construction, by contrast, costs at least ¥21.18M per room. The gap is 2.7x in the Miyako-Taketomi band and widens to 5.7x in the Tsushima-Tobishima band. Factor in the cost of shipping materials to remote islands and it grows further.
In other words, large new-build developments struggle to work within a ten-year horizon. What fits a ten-year payback is investment of ¥3.0M–¥9.3M per room: acquiring and renovating existing buildings. The supply picture in the previous section, with 190 of 223 openings at 10 rooms or fewer and 136 vacation rentals and cottages averaging 2.0 rooms, shows that the market is already following these economics.
This is where the grant comes in. The capital-investment type of the job-opportunity program has a ¥12M subsidy cap. Against revival costs of ¥3M–¥9M per room, that funds roughly 1.3 to 4 rooms. It will not pay for a 10-room lodging outright, but for a small revival of around five rooms the program can absorb a substantial share of the investment. Projects of exactly this size are what the program supports.
Practical Points: What Can and Cannot Be Used
When turning this into investment decisions, keep the following in mind.
First, the longer-stay tourism program supports demand generation and product development; it cannot be used for building lodging facilities. It covers costs of offering stay packages and of improving the local tourism services that make them up. For a lodging, it is best seen as a measure that strengthens demand, and it should not be built into plans as a source of capital expenditure.
Second, the job-opportunity program requires an increase in employment. Applications aimed only at capital spending are not envisaged. The program works only in combination with hiring and retaining people on the island, so the operating plan cannot be separated from the financing plan.
Third, caps and administration differ by municipality. The ¥6M / ¥16M / ¥12M tiers cited here are from Mishima Village, Kagoshima’s FY2024 call; Tsushima, Iki, Sado, Miyakojima and others each publish their own guidelines. Anyone considering a project should check the current year’s call for applications for the island in question directly.
Fourth, tax levers exist separately. Bonus depreciation and property tax relief under the Remote Islands Development Act and the depopulated areas law are distinct from the border islands grant, and whether they can be combined must be judged case by case. By our estimates, 48% bonus depreciation plus a three-year property tax exemption moves hotel IRR by about 0.6 points in depopulated, remote-island and peninsula areas.
Fifth, the ten-year term itself affects exit planning. For projects started now, the end-March 2037 expiry marks the limit of the period in which the program is certain to apply. If operating costs assume continued fare reductions and freight support, that assumption is guaranteed for ten years. For payback plans longer than ten years, it is prudent to stress-test year 11 onward on the assumption that the program no longer exists.
Summary
The amended act gives island lodging investment a clear time horizon running to the end of March 2037. The question is how to use these ten years.
Room stock across the 23 municipalities is 2,083 properties and 25,648 rooms. 63.8% is concentrated in the Nansei Islands, while the 13 Sea of Japan-side municipalities have just 8,006 rooms. Estimated settled ADR spans 2.3x, from ¥14,300 in Ama Town to ¥6,200 in Tsushima, a market with shallower tiers than cities. New supply over four years was 223 properties and 2,117 rooms, with 85.2% at 10 rooms or fewer, a sign of continued fragmentation.
At these rate and occupancy levels, a ten-year payback works for investment of ¥3.0M–¥9.3M per room. New hotel construction at ¥21.18M–¥34.03M per room is 2.7–5.7x higher, so large new builds do not fit a ten-year frame. What the program actually supports is investment that revives existing stock in units of one to five rooms and runs it with local hires, and the ¥12M subsidy cap of the job-opportunity program is aimed squarely at that scale.
What ten years of policy continuity creates is not a catalyst for large developments but time to build up small projects that reliably pay back. By matching each island’s rate level against the depth of its existing stock, the figures above let you work out which project size works on which island.
Note on the estimates: The investment estimates in this article are simplified calculations based on estimated settled ADR, assumed occupancy, a 30% GOP margin and a ten-year payback. Actual investment decisions require a project-specific feasibility study. For municipalities where fewer than eight properties feed the ADR estimate (Ama, Nishinoshima, Yonaguni, Haboro, Rebun and Rishiri), the estimate range is wide and figures should be read as ranges. Program eligibility and subsidy caps vary by municipality and fiscal year.
References and Sources
■ Data sources
Estimated settled ADR and listed prices are averages of monthly values over the latest 12 months (September 2025 to August 2026) for the 23 island municipalities covered by the act and the prefectural capitals used for comparison. Room stock (2,083 properties, 25,648 rooms) and new openings (2023–2026, 223 properties, 2,117 rooms) are aggregated from our tracked lodging database. Program, budget and grant requirements are from Cabinet Office and MLIT publications; the enactment date and the six added islands are from news reports and announcements by the municipalities concerned.
■ Estimate assumptions
Investment ceiling per room = estimated settled ADR × assumed occupancy × 365 days × 30% GOP margin × 10 years. Occupancy is tested at 45%, 55% and 65% (assumed full-year values, not actual occupancy in each municipality). The 30% GOP margin is set conservatively for small island properties that struggle to absorb fixed costs, with reference to results for operator-managed properties disclosed by a listed REIT. New-build cost per room assumes ¥2.0M–2.5M per tsubo and 35–45㎡ of gross floor area per room (including common areas), and excludes island-specific premiums for shipping materials and bringing in tradespeople as well as price inflation during construction.
■ Limitations and caveats
(1) ADR is an estimate and differs from each property’s actual settled prices and accounting figures. (2) Municipalities where fewer than eight properties feed the ADR estimate (Ama, Nishinoshima, Yonaguni, Haboro, Rebun and Rishiri) have wide estimate ranges. Municipalities where prices cannot be observed, such as Awashimaura, Tarama and Chibu, reflect missing data, not missing demand. (3) ADR for Haboro and Sakata covers the whole municipality including mainland properties, so its scope does not match the (island-only) room stock. (4) This article focuses on measured supply (room stock, new supply and rates) and does not cover demand-side results such as guest nights or ferry passenger numbers. Occupancy is assumed, and demand must be confirmed in a project-specific feasibility study. (5) Subsidy caps and eligible costs vary by municipality and fiscal year.
■ Market data
- MetroEngines Research & Consulting — estimated settled ADR (23 island municipalities, latest 12 months), room stock (2,083 properties, 25,648 rooms, tracked basis), new openings (2023–2026, N=223 properties)
■ Program and government materials
- Cabinet Office, Secretariat of the Headquarters for Ocean Policy: “Act on Inhabited Remote Border Islands — laws and related materials” (Japanese)
- Cabinet Office: “Inhabited Remote Border Islands” (basic policy and status reports, Japanese)
- MLIT: “Grant for Sustaining Communities in Specified Inhabited Remote Border Island Areas — FY2026 budget ¥5.5 billion” (Japanese)
- Iki City: “The Act on Inhabited Remote Border Islands has been amended and extended” (enacted July 8, 2026, Japanese)
- Shin-Kamigoto Town: “The Act on Inhabited Remote Border Islands will be extended for ten years” (Japanese)
- FY2024 call for applications, job-opportunity program of the border islands grant (Mishima Village, Kagoshima, Japanese)
■ News reports
- Nikkei: “Amended border islands act enacted, adding six islands including Teuri to support program” (July 8, 2026, Japanese)
- NHK: “Upper House plenary enacts amended law on preserving inhabited border islands, adding six islands” (Japanese)
■ REIT disclosures
- Invincible Investment Corporation (インヴィンシブル投資法人), financial results presentation (GOP of 91 operator-managed properties, period ended December 2024)