

There is one question that always comes up when a new limited-service hotel project reaches the point of fixing the standard guest-room specification. Should the bathroom be a three-in-one unit bath (tub, washbasin and toilet integrated into a single module), or should the bath and toilet be separated? The former keeps the per-room floor area down and yields more rooms out of the same gross floor area. The latter may allow a higher rate, but it requires paying for several extra square metres per room plus the equipment cost differential up front.
This article narrows in on that single decision, connecting the demand side (how often it actually shows up in guest reviews, and how much it moves the rate) and the supply side (how many square metres and how much money it adds) into one payback calculation. Cross-referencing 4,515 limited-service hotels, 2.3 million guest reviews and listed prices by room type, what moves the rate turns out not to be the bathroom configuration itself, but the floor area that configuration demands.
How this differs from our earlier reports
Our earlier reports “Hotel Construction Cost ¥20.67M per Room — Derived from a 35.0m² Room Unit Area Across 31 Projects” and “Hotel Construction Cost ¥8.7M–71.4M per Room: 3 Tiers by Format and Break-Even ADR in 12 Markets” take the total gross floor area and construction cost as their subject. Our earlier report on the asset value of sleep-and-wellness guest rooms dealt with bedding and lighting — a different specification axis. This article restricts itself to one point: the bathroom configuration (three-in-one unit / separated bath and toilet / independent bathroom with a washing area), and examines the marginal economics of “the few square metres added to one room” rather than the total.
Metric Definitions Used in This Article
- ADR (average daily rate): An estimated settled rate (tax-excluded equivalent) calculated by applying a format-specific adjustment coefficient to the lowest published plan level each property posts on OTAs and other booking sites (double occupancy, per-room rate, tax-included). Cross-checked against property-level actuals disclosed by listed hotel REITs (91 properties, most recent 3 months), the median error is approximately 7%. These are estimates and differ from each property’s actual transaction prices and accounting figures. Area-level ADR is the median across the target properties (the level of a typical property in that area).
- Listed price: The selling price published on booking sites as such. Per-room rate at double occupancy (tax-included). Price comparisons by room type in this article are made on this listed-price basis; conversion to estimated settled ADR uses a measured conversion coefficient of 0.540 (median across 4,462 target properties).
- OCC (occupancy rate): The share of sold rooms against the total room count in an area (an estimate based on OTA sales inventory; consistency checks against monthly REIT disclosures confirm accuracy of roughly a few percentage points). The occupancy rates used in this article’s payback calculations are business-plan assumptions, not measured values.
- Data sources: MetroEngines Research & Consulting / Ministry of Land, Infrastructure, Transport and Tourism “Building Dynamics Statistics Survey” / semantic analysis of guest reviews by the HotelBank Editorial Team
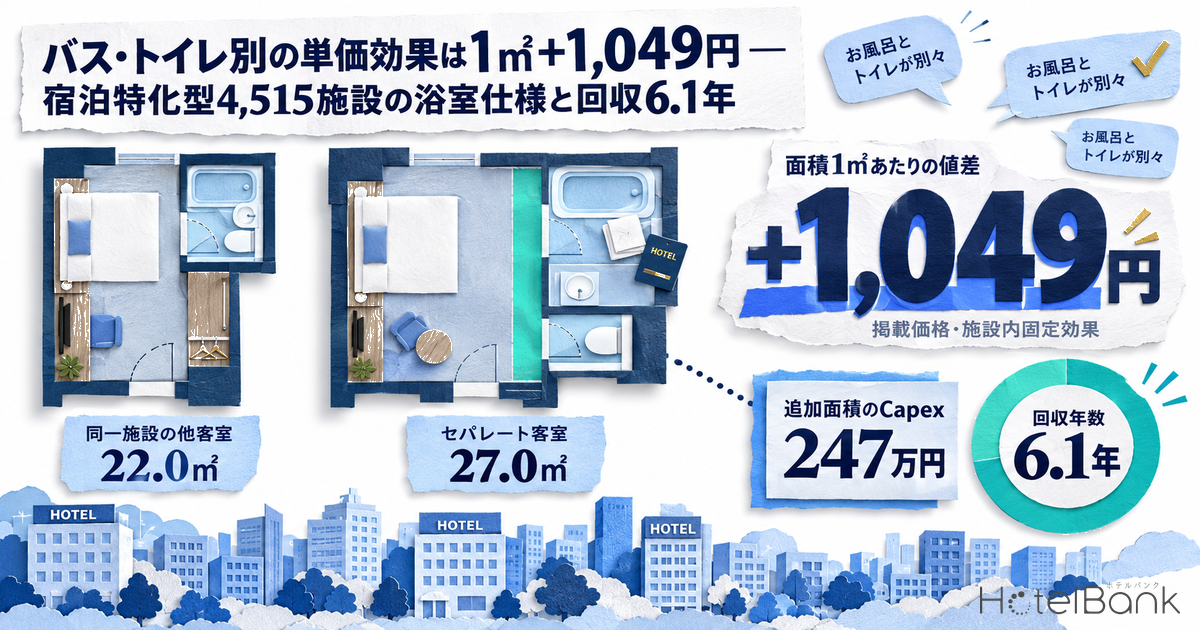
- — +¥1,049 per m²: Looking at floor area and bathroom configuration simultaneously within the same property, what moves the listed price is area (95% CI +¥563 to +¥1,431). The bath-toilet-separated configuration on its own comes to +¥54, with an interval straddling zero.
- — 50,367 mentions, 91.0% positive: The review mention rate for bathroom separation rose from 0.544% in the first 12 months to 0.629% in the second (+15.7%). Among limited-service hotels, 4.9% flag it in the room name; for properties opened 2016–2019 the figure is 10.2%.
- — Option B (+3.5m², ¥2.47M capex) pays back in 6.1 years: A 16.4% return on capex assuming 80% full-year occupancy and a 70% GOP contribution ratio. Even with gross floor area fixed, the 9.1% loss of room count is absorbed and room revenue rises 14.0%.
- — The break point is a marginal rate of ¥400 per m² (estimated settled ADR basis): below it, payback stretches to 8.6 years or more. At the lower bound of the regression’s 95% confidence interval (¥304 per m²) it extends to 11.4 years.
- — Swapping the configuration alone in a renovation rests on weak grounds: separation that creates no additional area shows no confirmable price premium, and even consolidating three rooms into two pays back only in 8.3–11.1 years. Request-form complaints cluster in the mid-tier — properties of around 172 rooms with an estimated ADR of ¥12,600.
Demand side: guests mentioned a “separate” bathroom 50,000 times, and 91% of those were words of appraisal
First, the measurable volume of demand. Running a semantic analysis over guest reviews and extracting remarks touching on “separated bath and toilet / presence of an independent washbasin,” 50,367 reviews qualified across all formats over the most recent 24 months (September 2024 to September 2026). Of these, 45,816 (91.0%) were positive mentions, 1,334 (2.6%) were complaints or requests, and the remaining 3,217 were neutral.
On the positive side, the phrasing is dominated by appraisal of the specification’s mere existence — “the bath and toilet were separate,” “separate bath and toilet, nice and roomy.” On the complaint side, what stands out is the request form: “it would be nice if the bath and toilet were separate,” “please make it separated.” In other words, this tag carries two meanings at once: on the positive side it signals properties that have the specification, and on the negative side it marks unmet demand at properties that do not.
Narrowing to limited-service hotels (business-hotel format, 4,515 properties with 30 or more reviews in the last 24 months), positive mentions numbered 13,935 against 2,307,516 target reviews — a mention rate of 0.60%. As a number it is small. But because reviews only surface “things memorable enough to be worth writing down,” this 0.60% should be read as an indicator of intensity of interest, not of how widespread the specification is.
Month by month, the mention rate was 0.544% in the first 12 months (September 2024 – August 2025) against 0.629% in the second 12 months (September 2025 – August 2026) — an increase of 15.7%. Because the tagging rate for guest-room tags holds steady at 61–64% each month, this gap reflects not a shift in analytical coverage but a genuine rise in how often guests mention bathroom separation. A rising inbound share and growth in long-stay and solo female travel are plausible drivers, but review data alone cannot isolate the cause.
The geographic skew is unmistakable. Mention rates are highest in regional urban markets — Chiba 1.57%, Nagasaki 1.40%, Shiga 1.25%, Hiroshima 1.23% — while major metropolitan centres sit low: Tokyo 0.32%, Kyoto 0.45%, Osaka 0.55%. The natural reading is that this reflects differences in how rooms are built, not differences in demand. In central locations where land is expensive, compact rooms with three-in-one unit baths are the standard, so “being separate” is unlikely to register as an unusual experience. Conversely, in regional cities with room to build, and at properties with Japanese-style or family rooms, separated layouts appear more often — and end up in the reviews.
| Prefecture | Properties | Reviews | Mentions | Mention rate | Selling | Median ADR |
|---|---|---|---|---|---|---|
| Chiba | 91 | 46,323 | 726 | 1.57% | 7 (7.7%) | ¥8,051 |
| Nagasaki | 81 | 27,059 | 380 | 1.40% | 5 (6.2%) | ¥6,919 |
| Shiga | 58 | 15,737 | 196 | 1.25% | 1 (1.7%) | ¥7,731 |
| Hiroshima | 110 | 60,924 | 747 | 1.23% | 4 (3.6%) | ¥7,367 |
| Miyazaki | 53 | 17,851 | 202 | 1.13% | 2 (3.8%) | ¥6,697 |
| Hyogo | 103 | 48,120 | 542 | 1.13% | 6 (5.8%) | ¥7,687 |
| Tokushima | 44 | 11,465 | 114 | 0.99% | 2 (4.5%) | ¥5,866 |
| Aomori | 66 | 28,349 | 266 | 0.94% | 2 (3.0%) | ¥7,510 |
| Fukushima | 87 | 26,735 | 248 | 0.93% | 3 (3.4%) | ¥6,865 |
| Fukuoka | 206 | 139,318 | 1,240 | 0.89% | 17 (8.3%) | ¥9,598 |
| Miyagi | 98 | 51,602 | 449 | 0.87% | 2 (2.0%) | ¥7,542 |
| Saitama | 89 | 25,051 | 213 | 0.85% | 2 (2.2%) | ¥7,550 |
| Kanagawa | 143 | 81,307 | 656 | 0.81% | 8 (5.6%) | ¥8,822 |
| Ehime | 62 | 21,404 | 172 | 0.80% | 5 (8.1%) | ¥5,924 |
| Hokkaido | 267 | 148,442 | 1,144 | 0.77% | 20 (7.5%) | ¥9,200 |
Lining up the six major metropolitan markets shows that the volume of expressed demand and the way supply responds do not necessarily move together.
| Market | Target properties | Reviews | Positive mentions | Mention rate | Properties selling such rooms | Median estimated ADR |
|---|---|---|---|---|---|---|
| Fukuoka | 206 | 139,318 | 1,240 | 0.89% | 17 (8.3%) | ¥9,598 |
| Hokkaido | 267 | 148,442 | 1,144 | 0.77% | 20 (7.5%) | ¥9,200 |
| Aichi | 211 | 115,969 | 886 | 0.76% | 9 (4.3%) | ¥7,607 |
| Osaka | 263 | 193,379 | 1,070 | 0.55% | 24 (9.1%) | ¥9,088 |
| Kyoto | 120 | 105,388 | 479 | 0.45% | 10 (8.3%) | ¥12,000 |
| Tokyo | 579 | 448,208 | 1,434 | 0.32% | 31 (5.4%) | ¥13,300 |
Expressed demand (mention rate) and the supply response (share of properties selling such rooms) do not rank in the same order. Osaka sits below average on mentions at 0.55%, yet its share of properties selling such rooms is 9.1% (24 of 263) — the highest among the major markets. Kyoto likewise pairs a 0.45% mention rate with an 8.3% selling share. Tokyo, by contrast, is lowest on both counts among the major markets: 0.32% mentions and a 5.4% selling share. A coherent reading is that in central-Tokyo limited-service hotels the opportunity cost of guest-room floor area is at its highest, so area-hungry separated layouts are the least likely to be chosen.
Supply side: 4.9% advertise “separate bath and toilet” in the room name — 10.2% among properties opened since 2016
Next, the state of supply. Counting the properties that state at least one of “separate bath and toilet,” “separated,” “with a washing area” or “independent washbasin” in the names of the room types they sell on booking sites, 222 of the 4,515 limited-service hotels (4.9%) do so. The room name is the only specification display a guest sees before booking, so whether it appears there also reflects the operator’s own judgement as to whether the specification can be presented as a justification for the rate.
In practice the wording tends to pair the configuration with the area — “Twin / Non-smoking / 26m², separate bath and toilet,” “Deluxe Twin [Separated Bath and Toilet Type],” “Separate-Bath Single,” “Japanese-style room, 12 tatami (49m², separate bath and toilet).” In other words, operators present the bathroom configuration not as a standalone selling point but bundled with space. That is consistent with the price analysis that follows.
Cutting by opening year brings out a clear generational gap. Among properties opened in 1989 or earlier, only 3.6% (34 of 932) sell such rooms; among those opened 2016–2019 the figure is 10.2% (58 of 567) — 2.8 times higher. The share of properties receiving positive mentions also doubles, from 22.6% to 45.3%. Properties opened from 2020 onward number only 38 and cannot bear interpretation of the ratio, so they are shown as a reference value only.
This generational gap points in the same direction as the expansion of guest-room area itself. The 2016–2019 cohort has a median estimated ADR of ¥11,200, far above the ¥7,100 of the pre-1989 cohort. Bathroom separation has not been a standalone fashion; it has been implemented as part of a design philosophy of widening rooms to capture higher rates.
Testing the price effect: +¥1,460 within a property, but what works is area, not the bathroom configuration
Here is the core of this article. When measuring a rate effect, comparing different properties mixes in differences of location, building age and brand. So the comparison was made within the same property, between room types with the same meal conditions and the same maximum occupancy. The sample is the 141 properties selling such rooms for which a comparable pairing of room types could be established. Median listed prices (double occupancy, tax-included, excluding sold-out dates) for check-in dates between June and August 2026 were computed per room type, and the difference between separated-bathroom rooms and other rooms was taken within each property.
| Metric (within-property pairs, N=141 properties) | Median | 1st quartile | 3rd quartile |
|---|---|---|---|
| Listed-price gap between separated and other rooms (yen) | +¥1,460 | -¥574 | +¥3,079 |
| Same, as a percentage | +9.0% | -2.8% | +20.4% |
| Share of properties where the gap was positive | 70.9% (100 of 141 properties) | ||
| Gap in room area (104 cells with an area notation) | +4.5m² | — | |
| Of these, price gap in the 30 cells with similar area (within ±2m²) | -¥960 | — | |
The last two rows of the table are the important ones. Separated-bathroom rooms are listed at a median of roughly ¥1,500 more than other rooms. But the area gap is +4.5m², and once the comparison is restricted to pairs of near-identical area (within ±2m²), the price gap has a median of -¥960 — it disappears. That raises the suspicion that the price gap reflects not the bathroom configuration but simply the fact that those rooms are larger.
To separate the two, a regression of “listed price = floor area + bathroom-configuration dummy” was run on the 2,394 room types carrying an area notation in the room name, holding property, meal conditions and maximum occupancy fixed (a fixed-effects specification centred within property and condition; 2,303 valid observations across 98 properties). The results are as follows.
| Explanatory variable | Coefficient (listed price, double occupancy, tax-incl.) | 95% confidence interval | Interpretation |
|---|---|---|---|
| Room area (per m²) | +¥1,049 | +¥563 to +¥1,431 | One extra m² raises the listed price by about ¥1,000. The interval excludes zero |
| Separate bath and toilet (dummy) | +¥54 | -¥1,759 to +¥2,456 | Holding area equal, no premium from the configuration alone can be confirmed |
| Coefficient of determination (explanatory power for within-property variation) 0.499 / confidence intervals from 400 property-level bootstrap replications | |||
In the scatter plot, the separated-bathroom room types (blue) cluster toward the larger-area side, but within any given area band their price range overlaps that of other rooms (grey). The bathroom configuration does not stand on its own as an explanatory variable for price. A specification that guests clearly endorse shows up in price not as a configuration but as floor area.
This rewrites the premise of the investment decision. Not “separating the bath and toilet raises the rate,” but “the floor area added in order to separate them raises the rate.” Put the other way: where separation is achieved purely through clever layout without adding area, a price premium should not be expected. The payback calculation should be built on the marginal rate per square metre.
Converting to an estimated settled ADR basis: the median ratio of estimated settled ADR to listed price (all-plan average) measured across 4,462 properties is 0.540, so the marginal rate per square metre is approximately ¥570 per m² (estimated settled ADR basis, tax-excluded equivalent). For comparison, the average rate per square metre is the limited-service median estimated ADR of ¥7,800 divided by the median room area of 22.0m², or ¥354/m². That the marginal rate (about ¥570) exceeds the average rate (about ¥350) is why the payback calculation below works at all.
Supply-side cost: 2.0–5.0m² added per room, at a construction cost of ¥591,000 per m²
So how many square metres does separating the bathroom actually add to a room? Build it up from the dimensions of the three-in-one unit. The size designations standard in hotel guest rooms are “1216” (1.2m × 1.6m = 1.92m²) and “1418” (1.4m × 1.8m = 2.52m²), which assume tub, washbasin and toilet packed into a single box. Separating them requires, on top of the bathroom itself (1.92m² for a 1216 equivalent), an independent toilet (1.0–1.3m²), an independent washbasin (0.8–1.2m²), and the door swings and circulation each of those needs — which in practice lands in a range of +2 to 5m².
The measured data agree with that range. Comparing room types with an area notation in the room name, separated-bathroom rooms have a median area of 27.0m² (365 room types) against 22.0m² for other rooms at the same properties (1,897 room types). The median of the property-matched differences is +5.0m² (84 properties). That figure, however, captures more than the geometric difference of the bathroom: it also reflects the fact that separated layouts tend to be implemented in room types — twins, deluxes — that were already larger. The scenarios therefore span from +2.0m², close to the geometric floor, to +5.0m², the measured median.
Unit cost comes from the Ministry of Land, Infrastructure, Transport and Tourism’s “Building Dynamics Statistics Survey,” lodging-use buildings. The 2024 national figures are 1,756,286m² of floor area against ¥1.0384 trillion in planned construction cost — ¥591,279 per m² (¥1.955 million per tsubo). That is up 41% in two years from ¥419,164 in 2022, so additional floor area now costs more than it used to. To this is added an equipment differential from a three-in-one unit to a separated specification of ¥400,000 per room (¥200,000 to ¥1,000,000 tested in the sensitivity analysis below).
| Scenario | Additional area | Capex for the area | Equipment differential | Total capex / room | ADR uplift (settled-ADR basis) |
|---|---|---|---|---|---|
| A: toilet separated only (bathroom is a shower booth) | +2.0m² | ¥1.183M | ¥0.40M | ¥1.583M | +¥1,133 |
| B: separate bath and toilet + independent washbasin Base case | +3.5m² | ¥2.069M | ¥0.40M | ¥2.469M | +¥1,983 |
| C: independent bathroom with a washing area | +5.0m² | ¥2.956M | ¥0.40M | ¥3.356M | +¥2,832 |
The payback line: at 80% full-year occupancy Option B pays back in 6.1 years at a 16.4% return — below ¥400 per m² it stretches to 8.6 years
Payback is set on a GOP (gross operating profit) basis. The ADR uplift generates almost no additional variable cost, so the contribution ratio is high, but it is set conservatively at 70% to allow for booking-channel commissions and increased housekeeping supplies. The annual revenue gain is “ADR uplift × 365 × occupancy.” Occupancy is not a measured value but a full-year business-plan assumption, set at three levels: 70%, 80% and 85%.
| Scenario | 70% full-year OCC | 80% full-year OCC | 85% full-year OCC | GOP increment (at 80% OCC) | Return on capex (same) |
|---|---|---|---|---|---|
| A: +2.0m² | 7.8 yrs | 6.8 yrs | 6.4 yrs | +¥232k / room / year | 14.6% |
| B: +3.5m² | 7.0 yrs | 6.1 yrs | 5.7 yrs | +¥405k / room / year | 16.4% |
| C: +5.0m² | 6.6 yrs | 5.8 yrs | 5.5 yrs | +¥579k / room / year | 17.2% |
Payback shortens as the additional area grows because the fixed ¥400,000 equipment differential is spread thinner across more square metres. Since the capex for area and the marginal rate per square metre move in proportion, adding more area does not sharply improve the return on capex: the gap between Options B and C is only 0.8 percentage points.
What matters most is the marginal rate per square metre itself. This article’s measured value is ¥1,049/m² on a listed-price basis (¥566 converted to estimated settled ADR), but it is estimated from within-property variation across the 98 properties selling such rooms, and will run higher or lower depending on an individual project’s location and guest mix. Consider the sensitivity.
| Sensitivity item | Condition | Capex / room | GOP increment / room / year | Payback |
|---|---|---|---|---|
| Marginal rate per m² (estimated settled ADR basis) | ¥300 / m² | ¥2.469M | ¥215k | 11.5 yrs |
| ¥400 / m² | ¥2.469M | ¥286k | 8.6 yrs | |
| ¥566 / m² (measured) | ¥2.469M | ¥405k | 6.1 yrs | |
| ¥700 / m² | ¥2.469M | ¥501k | 4.9 yrs | |
| Equipment differential (versus a three-in-one unit) | ¥0.20M | ¥2.269M | ¥405k | 5.6 yrs |
| ¥0.40M (base) | ¥2.469M | ¥405k | 6.1 yrs | |
| ¥0.70M | ¥2.769M | ¥405k | 6.8 yrs | |
| ¥1.00M | ¥3.069M | ¥405k | 7.6 yrs |
| Marginal rate per m² (estimated settled ADR basis) | 70% full-year OCC | 75% full-year OCC | 80% full-year OCC | 85% full-year OCC | 90% full-year OCC |
|---|---|---|---|---|---|
| ¥304 (95% CI lower bound) | 13.0 yrs | 12.1 yrs | 11.4 yrs | 10.7 yrs | 10.1 yrs |
| ¥400 | 9.9 yrs | 9.2 yrs | 8.6 yrs | 8.1 yrs | 7.7 yrs |
| ¥566 (measured) | 7.0 yrs | 6.5 yrs | 6.1 yrs | 5.7 yrs | 5.4 yrs |
| ¥700 | 5.6 yrs | 5.3 yrs | 4.9 yrs | 4.6 yrs | 4.4 yrs |
| ¥773 (95% CI upper bound) | 5.1 yrs | 4.8 yrs | 4.5 yrs | 4.2 yrs | 4.0 yrs |
Moving the regression coefficient’s uncertainty and occupancy together makes the range of judgement explicit. At the measured ¥566/m², payback stays within 7.0 years even at 70% full-year occupancy; at the lower end of the confidence interval (¥304/m²) it stretches to 10.1 years even at 90% occupancy and 11.4 years at 80%. The estimation range for the marginal rate moves payback far more than a 5-point change in occupancy does. Verifying the relationship between price and area by room type around the planned site is therefore a higher priority than refining the occupancy assumption.
The break point is clear. Once the marginal rate per square metre falls below ¥400/m² on an estimated settled ADR basis, payback stretches past 8.6 years — beyond the tolerance of a typical limited-service investment horizon. Conversely, in a location that can command ¥700/m², payback is 4.9 years. That means the decision can flip between high-rate central and resort locations and lower-rate regional cities.
When gross floor area is fixed: room count falls 9.1%, but revenue rises 14.0%
In a new-build project, the binding constraint is usually not capex but the ceiling on gross floor area. Where the floor-area ratio fixes the total, adding 3.5m² per room is the same thing as cutting rooms. Taking the 35.0m² room unit area for limited-service hotels shown in our earlier work as the starting point, the table below models the outcome per 1,000m² of gross floor area.
| Additional area | Room unit area | Rooms per 1,000m² | ADR (national median basis) | Annual room revenue | Change |
|---|---|---|---|---|---|
| ±0 (three-in-one unit) | 35.0m² | 28.57 | ¥7,800 | ¥65.01M | — |
| +2.0m² (Option A) | 37.0m² | 27.03 | ¥8,900 | ¥70.43M | +8.3% |
| +3.5m² (Option B) | 38.5m² | 25.97 | ¥9,800 | ¥74.13M | +14.0% |
| +5.0m² (Option C) | 40.0m² | 25.00 | ¥10,600 | ¥77.56M | +19.3% |
Under Option B the room count falls from 28.57 to 25.97 — a 9.1% reduction — but the ADR uplift more than offsets it, and annual room revenue per unit of gross floor area rises 14.0%. This works because of the relationship confirmed in the previous section: the marginal rate (¥566/m²) exceeds the average rate (¥354/m²). Since the marginal rate on added area is higher than the average rate of the existing stock, revenue increases by diverting fixed floor area into room size.
That relationship does, however, depend on the baseline ADR level. Using the 2016–2019 cohort’s median estimated ADR of ¥11,200 as the base, the same Option B revenue gain narrows to +7.0%. In projects already designed for high rates, the average rate approaches the marginal rate, so the benefit of adding area thins out. The conclusion is counter-intuitive: the lower the rate positioning of a project, the greater the relative benefit of investing in floor area.
Swapping it in during a renovation: separation that creates no area has weak grounds for a price rise
For owners of existing properties, the case is harder than for new builds. With the structure already fixed, the only way to enlarge rooms is to cut their number. If the bathroom is separated purely through layout without adding area, this article’s regression gives little basis for a price premium (configuration dummy coefficient +¥54, 95% confidence interval -¥1,759 to +¥2,456). As our earlier report on renovation downtime showed, a renovation involving wet areas costs ¥3 million per room in construction and swells to ¥3.98 million in effective capex once the opportunity cost of the closure period is included. Spending an effective ¥4 million on work that cannot be expected to raise the rate is difficult to justify.
Going in the direction of creating area — cutting the room count to enlarge each room — does pencil out. The case modelled below consolidates three rooms of 20m² each into two rooms of 30m².
| Consolidation pattern | ADR (estimated settled) | One night’s revenue from 3 rooms | Annual GOP increment | Effective capex ¥3M / room | At ¥4M / room |
|---|---|---|---|---|---|
| 3 rooms × 20m² (current) | ¥7,800 | ¥23,400 | — | — | — |
| 2 rooms × 30m² (consolidated) | ¥13,500 | ¥26,900 (+15.1%) | +¥723k | 8.3 yrs | 11.1 yrs |
| Reference: 2 rooms × 20m² → 1 room × 40m² | ¥19,100 | +22.7% | +¥723k | 4.1 yrs | 5.5 yrs |
A payback of 8.3 to 11.1 years is clearly worse than the 6.1 years of new-build Option B. Investing in bathroom separation at an existing property is defensible only where several conditions coincide: (1) consolidation opens room to move the room type into a higher tier, (2) existing rooms are 20m² or smaller and the tightness itself shows up in guest appraisals, and (3) the unmet-demand signal discussed below appears at the property in question.
Where the unmet demand sits — complaints come from the mid-tier: 172 rooms, ADR ¥12,600
Extracting the properties where the request form “please make the bath and toilet separate” appears yields 253 limited-service properties and 336 mentions in total. The profile of those 253 properties is instructive.
| Metric | 253 properties with request-form mentions | No mentions (3,087 properties) |
|---|---|---|
| Room count (median) | 172 | 95 |
| Estimated ADR (median) | ¥12,600 | ¥7,300 |
| Opening year (median) | 2009 | 2001 |
| Share not selling such rooms | 78.7% (199 properties) | 100% |
The requests are not coming from small, ageing properties. They come from the urban mid-to-upper tier: around 172 rooms with an estimated ADR of ¥12,600. Guests paying that rate hold bathroom separation as an expectation, so a three-in-one unit turns the gap with that expectation into words. At a property with an estimated ADR of ¥7,300 and 95 rooms, by contrast, it is not expected in the first place and so never surfaces as a complaint.
The bathroom specification decision therefore means different things at different rate levels. In a project targeting above ¥12,000, a separated layout is less a means of raising the rate than a precondition for sustaining it. Around the ¥8,000 band, by contrast, separation does work as a differentiator — but in locations where the marginal rate per square metre is low, it will not reach payback.
New build targeting rates above ¥10,000
Make Option B (+3.5m², ¥2.47M capex) the standard specification
Payback in 6.1 years at 80% full-year occupancy. This is the rate band where request-form mentions appear, so a separated layout is best treated as a precondition for sustaining the rate rather than as an uplift factor. Even with gross floor area fixed, revenue rises 7.0–14.0%.
New build in a regional city around the ¥8,000 band
Take it in steps with Option A (+2.0m², toilet separated only)
Where the marginal rate per m² falls below ¥400, payback runs past 8.6 years. Implement it in the upper room types only rather than across the board, and expand once market demand is confirmed — as in the high-mention markets of Chiba, Nagasaki and Hiroshima.
Renovating an existing property
Separation that creates no area rests on weak grounds
Swapping the configuration alone shows no statistically confirmable price premium. Consolidation that cuts the room count pays back in 8.3–11.1 years. Consider it only where existing rooms are 20m² or smaller and request-form mentions appear for your own property.
Limitations of this analysis: The marginal rate of ¥1,049/m² (¥566 on an estimated settled ADR basis) is an observed value estimated from within-property variation across 98 properties selling such rooms and 2,303 room types; it is not an estimate of a causal effect. Because it is limited to room types carrying an area notation in the room name, properties that do not display areas fall outside the analysis. The payback periods are simplified estimates assuming a 70% GOP contribution ratio and constant occupancy and rates; an actual investment decision requires a detailed feasibility study. Construction costs are national averages and differ substantially between central urban and regional locations.
Conclusion
Guests clearly value a separated bathroom. There were 50,000 mentions over the most recent 24 months, 91.0% of them positive, and the mention rate grew 15.7% year on year. Supply has responded: in the 2016–2019 opening cohort, 10.2% of properties sell such rooms, 2.8 times the 3.6% of the pre-1989 cohort.
Yet once the price data are carefully aligned within each property, what moves the rate is not the bathroom configuration but the area. Listed price rises +¥1,049 per m² (about ¥570 converted to estimated settled ADR), while the configuration dummy comes to +¥54 with a confidence interval straddling zero. This fact demands a change in how the investment case is phrased — from “separating the bath and toilet raises the rate” to “the floor area added in order to separate them raises the rate.”
As long as the marginal rate exceeds the average rate, diverting fixed gross floor area into room size increases revenue. An additional 3.5m² at ¥2.47 million of capex pays back in 6.1 years, and room revenue per 1,000m² of gross floor area rises 14.0% after absorbing a 9.1% cut in room count. The break point is a marginal rate of ¥400 per m². Checking whether your own site can command that level, from the relationship between price and area by room type nearby, is the practical first step in settling the specification.
References and Sources
■ Data sources
The population is 4,515 limited-service hotels (30 or more reviews in the most recent 24 months). The analysis uses estimated settled ADR (12-month average by property, September 2025 – August 2026), 19,185 listed prices by room type (check-in 1 June – 31 August 2026, double occupancy, tax-included, excluding sold-out dates), and semantic analysis of 8,592,063 guest reviews (September 2024 – August 2026). Construction costs come from lodging-use buildings in the Ministry of Land, Infrastructure, Transport and Tourism “Building Dynamics Statistics Survey” for 2024 (floor area 1,756,286m², planned construction cost ¥1.0384 trillion). Median ADRs by prefecture and by major market are medians of the 12-month per-property averages within this population, and differ in population and aggregation method from area-wide monthly medians.
■ Estimation assumptions
The marginal rate per m² is ¥566, obtained by multiplying the listed-price coefficient of ¥1,049/m² from a fixed-effects regression holding property, meal conditions and maximum occupancy fixed (2,303 valid observations across 98 properties; confidence intervals from 400 property-level bootstrap replications) by the conversion coefficient of 0.540 (median across 4,462 properties). Construction cost ¥591,279/m², equipment differential ¥400,000/room, GOP contribution ratio 70%, and occupancy as a full-year business-plan assumption (70–90%), with rates and occupancy held constant over the payback period. The gross-floor-area model assumes a 35.0m² room unit area with common-area floor space unchanged; the renovation model assumes effective capex of ¥3–4 million per room.
■ Limitations and caveats
The regression coefficients estimate associations in observed data, not causal effects. The analysis is limited to room types that state an area in the room name, and listed prices are not transaction prices as such. Construction costs are national averages with large regional and temporal variation (+41% from 2022 to 2024). The renovation consolidation model is a simplified estimate linearly extrapolating the marginal rate across the 10–20m² range and does not account for a ceiling on market acceptance of a given room type. Payback periods exclude tax, interest, depreciation and future repair costs; an actual investment decision requires a project-specific feasibility study.
■ Market data
- MetroEngines Research & Consulting — estimated settled ADR for 4,515 limited-service hotels (September 2025 – August 2026), listed prices by room type (check-in June – August 2026, double occupancy, tax-included, 19,185 room types), and tabulation of specification wording in room names
- HotelBank Editorial Team research — semantic analysis of 8,592,063 guest reviews (September 2024 – August 2026, 42,283 properties), extracting mentions of “separated bath and toilet / presence of an independent washbasin”
■ Government statistics and public data
- e-Stat “Statistical Survey on Building Construction Starts” (statistics ID: 0003114490) — floor area and planned construction cost of lodging-use buildings (2011–2024). For 2024: floor area 1,756,286m² / planned construction cost ¥1.0384 trillion
- Ministry of Land, Infrastructure, Transport and Tourism “Building Dynamics Statistics Survey (Building Construction Starts Statistics)”
■ Equipment and construction cost benchmarks
- Guide to unit-bath size designations and dimensions (1216, 1418, 1616, 1620) — the first two digits denote depth and the last two width, in centimetres
- How to choose a unit-bath size (SUUMO Remodel Times) — 0.75 tsubo corresponds roughly to the 1216 size
- Interior fit-out cost benchmarks for hotels and ryokan (¥1.2–5 million per guest room; ¥3–5 million where wet-area replacement is included)
- Unit-bath replacement cost benchmarks (¥700,000–1.5 million including installation)
■ Earlier reports (sources of assumed figures)
- “Hotel Construction Cost ¥20.67M per Room — Derived from a 35.0m² Room Unit Area Across 31 Projects” (source of the 35.0m² room unit area)
- “Hotel Renovation Downtime Costs 32.6% of Construction Spend — Effective Capex of ¥3M to ¥3.98M per Room” (source of the effective renovation capex level)
- “Hotel Construction Cost ¥8.7M–71.4M per Room: 3 Tiers by Format and Break-Even ADR in 12 Markets”