

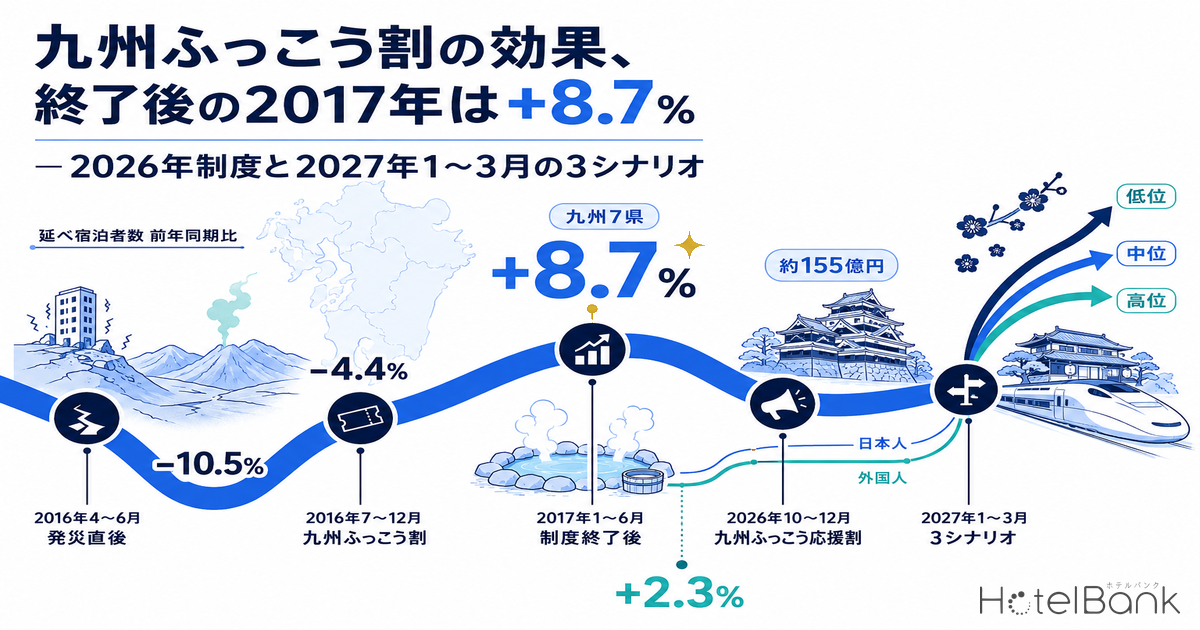
Coverage of the “Kyushu Fukko Ouenwari” travel subsidy that starts on October 1, 2026 has already settled the basics: the discount rates and the caps. What operators actually need to know lies further out — how demand behaves in the month after the programme ends. The 2016 “Kyushu Fukko Wari” left behind what is close to the only measured answer to that question. For this article we re-aggregated the Japan Tourism Agency’s Overnight Travel Statistics Survey by prefecture and by month going back to 2014, and examined what happened in January–June 2017, immediately after the earlier programme closed, broken out by Japanese versus foreign guests and by leisure versus business-oriented properties. The headline first: person-nights across Kyushu’s seven prefectures rose 8.7% year on year in the six months right after the programme ended, and no across-the-board payback decline is visible in the data. How demand came back, however, differed sharply by prefecture.
Metric Definitions Used in This Article
- Person-nights and occupancy rate: confirmed figures from the Japan Tourism Agency’s Overnight Travel Statistics Survey. Occupancy is the room occupancy rate published by that survey, not our own estimate. For 2016 and earlier we use the survey’s e-Stat entries; for 2017 we use the tabulated results published by the Japan Tourism Agency (Heisei 29).
- Japanese / foreign guests: we treat “Japanese” as total person-nights minus the survey’s “of which, foreign person-nights”.
- Leisure / business-oriented: the survey’s split between “properties where 50% or more of guests are travelling for leisure” and “properties where the share is under 50%”. Note that this classifies the property, not the purpose of the individual guest.
- ADR (average daily rate): an estimated settled rate (tax-exclusive equivalent) derived by applying property-type correction factors to the cheapest plan each property publishes on OTAs (two guests per room, per-room price, tax included). Cross-checked against property-level results disclosed by listed hotel REITs (91 properties, most recent three months), the median error is about 7%. It is an estimate and differs from each property’s actual transacted rates and accounting figures. Area-level ADR is the median across the covered properties (the level of a typical property in that area).
- Data sources: Japan Tourism Agency, Overnight Travel Statistics Survey; MetroEngines Research
- — In the six months right after the 2016 programme expired, person-nights across Kyushu’s seven prefectures were up 8.7% year on year. They were also 4.3% above the same period of 2015, before the earthquake. No across-the-board payback decline is visible.
- — But Japanese guests alone were 0.6% below 2015. What lifted the total was foreign demand, up 49.9% on the same basis — roughly 1.5 times. The “recovery” was not domestic demand returning under its own power.
- — Prefectures diverged. Oita was up 0.8% in total yet down 10.6% among Japanese guests; Kumamoto’s +19.3% was led by business-oriented properties at +30.4% rather than by leisure.
- — The 2026 programme carries ¥15.5bn in funding and runs for just under three months at a flat discount rate throughout. Concentrating a similar budget into a shorter window makes the lift stronger — and makes pull-forward of demand more likely too.
- — For January–March 2027 we set out three scenarios plus a sensitivity grid. The mid case is anchored on the same shape as January–March 2017 (total +2.3%, Japanese +1.6%, foreign +6.5%).
The 2016 programme was ¥18bn, six months, and a stepped-down discount rate
Start with the shape of the earlier programme. After the Kumamoto earthquake of April 2016, roughly 750,000 accommodation bookings were cancelled across Kyushu. Against that, about ¥18bn was allocated from the fiscal 2016 contingency reserve for Kumamoto earthquake recovery, and the “Kyushu Fukko Wari” was run by paying grants to travel agencies. It covered stays from July through December 2016 — six months.
Its defining design feature was that the discount rate was stepped down over the life of the programme. Kumamoto and Oita, the hardest-hit prefectures, had up to 70% off in July–September and up to 50% in October–December. The other five prefectures had up to 50% in July–September and up to 40% in October–December. The per-person cap was ¥20,000 for a one-night, two-day transport-inclusive package and ¥30,000 for two nights or more. The target was demand creation equivalent to 1.5 million person-nights; according to the results (provisional) announced by the Kyushu Tourism Promotion Organisation’s secretariat in March 2017, 2,719,000 people used it — about 1.8 times the target.
Accommodation demand across the seven prefectures did in fact steady during the programme. Re-aggregating the Japan Tourism Agency statistics, the period immediately after the earthquake (April–June 2016) was down 10.5% year on year, while July–December, the programme window, recovered to −4.4%. By prefecture the spread is wider still.
| Prefecture | Apr–Jun 2016 (right after the quake) |
Jul–Dec 2016 (programme window) |
Occupancy Jul–Dec average 2015 → 2016 |
|---|---|---|---|
| Fukuoka | +4.8% | −3.8% | 71.7 → 72.4 |
| Saga | −0.9% | −0.6% | 58.7 → 58.3 |
| Nagasaki | −24.6% | −14.6% | 60.9 → 54.1 |
| Kumamoto | −2.3% | −0.2% | 58.8 → 61.9 |
| Oita | −31.6% | +1.8% | 53.2 → 58.4 |
| Miyazaki | −12.1% | −2.2% | 53.9 → 54.3 |
| Kagoshima | −16.7% | −6.6% | 53.4 → 53.5 |
| Kyushu 7 prefectures | −10.5% | −4.4% | — |
| Japan (national) | −2.5% | −3.4% | 62.9 → 62.0 |
Person-nights, year on year. Source: Japan Tourism Agency, Overnight Travel Statistics Survey; compiled by the HotelBank Editorial Team
Oita’s swing from −31.6% to +1.8% is the most striking. Kumamoto’s initial drop was itself small at −2.3%, and it finished the programme window essentially flat at −0.2%. Nagasaki, by contrast, fell hardest at −24.6% despite being far from the epicentre, and recovered only slowly during the programme, at −14.6%. In other words, the distribution of seismic intensity and the distribution of cancellations did not line up: prefectures well away from the shaking absorbed reputational damage that the intensity map alone would not predict.
The six months after it ended were up 8.7% — there was no uniform drop
This is the heart of the matter. The programme closed at the end of December 2016. In the “sell it yourself” period that began the following month, how did accommodation demand in Kyushu move?
The answer is clear-cut. Person-nights across the seven prefectures in January–June 2017 came to 26,393,510, up 8.7% year on year — well ahead of the national +3.7%. January, the first month without the subsidy, was +2.5%; February was flat at −0.1%; then March +4.2%, April +15.8% and May +21.5% as growth accelerated. At the level of total volume, at least, no collapse followed the removal of the discount funding.
Person-nights across Kyushu’s seven prefectures, year on year by month. Source: Japan Tourism Agency, Overnight Travel Statistics Survey; compiled by the HotelBank Editorial Team
Reading that +8.7% straight off as “recovery” would be premature, though. The comparison base, January–June 2016, is a half-year dented by the April earthquake. A low base automatically inflates the following year’s growth rate. So we line it up three ways: against the same period of 2015, before the earthquake, and against 2014 as well.
| Kyushu 7 prefectures, Jan–Jun 2017 | Actual (person-nights) | vs 2016 | vs 2015 (pre-quake) |
|---|---|---|---|
| Person-nights (total) | 26,393,510 | +8.7% | +4.3% |
| of which Japanese | 22,662,220 | +6.0% | −0.6% |
| of which foreign | 3,731,290 | +27.9% | +49.9% |
| (reference) Japan, total | 238,604,740 | +3.7% | +2.7% |
Source: Japan Tourism Agency, Overnight Travel Statistics Survey; compiled by the HotelBank Editorial Team
The structure shows up here. The total was 4.3% above pre-earthquake 2015, but Japanese guests alone remained 0.6% below it. Foreign guests filled the gap, up 49.9% versus the same period of 2015 — roughly 1.5 times. The post-programme “return” looks less like domestic demand recovering under its own power and more like the inbound wave that was building at the time lifting Kyushu’s total. Which comes back first after a disaster, domestic or inbound demand, is not fixed: the order can reverse from one disaster area to another.
Breaking it down by month sharpens the picture further. Foreign person-nights in 2017 jumped +96.4% in May and +54.3% in July, while Japanese person-nights settled back toward the prior year through the second half — September −1.9%, October −0.5%, December −0.9%.
Kyushu’s seven prefectures, 2017 year-on-year change by month. Source: Japan Tourism Agency, Overnight Travel Statistics Survey; compiled by the HotelBank Editorial Team
Occupancy is the other metric that sits closer to what operators actually feel. The January–June average rose above 2016 in all seven prefectures: Fukuoka 69.3 → 71.0, Saga 54.3 → 59.8, Nagasaki 50.6 → 54.8, Kumamoto 54.0 → 58.9, Oita 46.9 → 56.0, Miyazaki 49.5 → 51.9, Kagoshima 46.4 → 53.4. Against a national move of 57.2 → 58.1, just +0.9pt, Kyushu gained between +1.7pt and +9.1pt. The image of “the subsidy ended and the footfall stopped” does not survive contact with the occupancy data either.
Occupancy rate (monthly average, January–June). Source: Japan Tourism Agency, Overnight Travel Statistics Survey; compiled by the HotelBank Editorial Team
Prefectures that came back, and prefectures that took time — the split the total hides
Look prefecture by prefecture and the conclusion splits apart behind the average. The table below sets the January–June 2017 results against both 2016 (the year after the programme window) and 2015 (before the earthquake).
| Prefecture | Jan–Jun 2017 (thousand person-nights) |
Total | Japanese | Foreign | |||
|---|---|---|---|---|---|---|---|
| vs 2016 | vs 2015 | vs 2016 | vs 2015 | vs 2016 | vs 2015 | ||
| Fukuoka | 8,006 | −1.5% | +7.3% | −3.6% | +0.9% | +8.8% | +47.6% |
| Saga | 1,435 | +0.8% | +0.7% | −4.3% | −6.6% | +59.3% | +118.7% |
| Nagasaki | 3,671 | +6.7% | −9.5% | +7.4% | −10.4% | +0.6% | −1.8% |
| Kumamoto | 3,825 | +13.7% | +19.1% | +13.4% | +19.3% | +16.0% | +17.6% |
| Oita | 3,580 | +21.4% | +0.8% | +11.0% | −10.6% | +91.0% | +98.6% |
| Miyazaki | 1,979 | +17.3% | +10.5% | +16.5% | +8.7% | +29.1% | +41.1% |
| Kagoshima | 3,898 | +18.1% | +2.6% | +13.2% | −2.9% | +90.3% | +105.1% |
| Kyushu 7 prefectures | 26,394 | +8.7% | +4.3% | +6.0% | −0.6% | +27.9% | +49.9% |
Source: Japan Tourism Agency, Overnight Travel Statistics Survey; compiled by the HotelBank Editorial Team
January–June 2017 versus the same period of 2015. Source: Japan Tourism Agency, Overnight Travel Statistics Survey; compiled by the HotelBank Editorial Team
Oita — the total came back, but Japanese demand was still below 2015 two years on
Oita’s total was +0.8% against 2015, so on the face of it demand had returned to its pre-earthquake level. Japanese guests alone, though, were −10.6%. What closed the gap was foreign demand at +98.6%, nearly doubling in absolute terms from 369,000 to 734,000 person-nights. Judge by the total alone and you misread the state of domestic demand by more than ten percentage points. One caveat: Oita’s own January–June 2015 was a high base, up 19.2% on 2014. Measured against 2014, the total was +20.1% and Japanese guests +2.0%.
Kumamoto — the growth was business demand, not leisure
Kumamoto posted the strongest growth of the seven prefectures against 2015: total +19.1%, Japanese +19.3%. That the worst-hit prefecture grew the most looks paradoxical until you split by property type. Properties where 50% or more of guests travel for leisure were up just 4.3% against 2015, while properties below that threshold — those serving mainly business demand — were up 30.4%. The natural reading is that long-stay demand tied to reconstruction and repair work was carrying the prefecture’s room nights. The same split runs in opposite directions against 2016 as well: leisure-oriented properties −1.9%, business-oriented properties +25.8%.
Nagasaki — the verdict changes with the base year
Nagasaki was −9.5% against 2015, the only decline among the seven. But January–June 2015 was an exceptional year for the prefecture, up 20.1% on 2014. Measured against 2014, the total was +8.7% and Japanese guests +4.3% — both positive. It is the textbook case of a conclusion that flips depending on where you put the base year, and the same caution applies when the 2027 results are assessed. Because 2026 was a normal year up to the July 28 earthquake, the safest approach for January–March 2027 is to carry two yardsticks side by side: versus the same months of 2026 and versus 2025.
The split reads more intuitively on a map. The figure below shows where Japanese person-nights in January–June 2017 sat relative to the pre-earthquake level (the same period of 2015). Circle size corresponds to total person-nights in that period.
Source: Japan Tourism Agency, Overnight Travel Statistics Survey; compiled by the HotelBank Editorial Team
Cross-checking against the academic research
This reading is consistent with earlier research. Tetsuaki Matsushita, “The effect of the ‘Fukko Wari’ recovery support measure on the recovery process of tourists in the Kumamoto earthquake” (Journal of Japan Society of Civil Engineers, Ser. D3, Vol. 75, No. 1, 2019) shows that the increase in tourists in Kumamoto was smaller than in Oita even though the discount rate was identical, and that in areas outside Kumamoto and Oita no effect large enough to change the recovery trend was detected. Our own aggregation points the same way: the largest gain during the programme was in Oita (from −31.6% in April–June to +1.8% in July–December), while Kumamoto’s leisure-oriented properties were still only +4.3% against 2015 after the programme ended. Identical discount funding does not produce an identical recovery when tourism assets, accommodation stock and road networks were damaged differently — a premise worth carrying into any reading of the 2026 programme.
How the 2026 programme differs — period, taper, inbound level, supply
The 2016 results cannot simply be transposed onto 2027. Four premises have changed.
| Item | FY2016 “Kyushu Fukko Wari” | FY2026 “Kyushu Fukko Ouenwari” |
|---|---|---|
| Earthquake | April 14 and 16, 2016 | July 28, 2026 |
| Budget | about ¥18bn (recovery contingency reserve) | about ¥15.5bn (contingency reserve) |
| Period | July–December 2016 (about six months) | stays from October 1 to December 25, 2026 (just under three months; as published by Nagasaki and Oita. May close early if the budget cap is reached, and could be extended into January 2027 or later) |
| Discount rate | Kumamoto and Oita: up to 70% in Jul–Sep → up to 50% in Oct–Dec Other five prefectures: up to 50% in Jul–Sep → up to 40% in Oct–Dec (stepped down over the period) | Kumamoto and Kagoshima: 60%; other five prefectures: 50% (flat throughout the period) |
| Discount cap | ¥20,000 for a transport-inclusive one-night trip; ¥30,000 for two nights or more | ¥20,000 for accommodation-only or a transport-inclusive one-night stay; ¥30,000 for transport-inclusive stays of two nights or more; ¥35,000 for multi-prefecture itineraries |
| Target and result | target of 1.5 million person-nights → 2,719,000 users (provisional figure announced by the secretariat) | equivalent to about 2.3–4.6 million person-nights on our estimate |
| Inbound visitors | 2016: about 24.04 million | 2025: 42.68 million (about 1.8x) |
| Supply | — | 1,997 properties and about 49,000 rooms confirmed as opening across Kyushu’s seven prefectures since 2017 |
Sources: Japan Tourism Agency; Kyushu Tourism Promotion Organisation; Japan National Tourism Organization (JNTO); MetroEngines Research (openings on an OTA-listing-confirmed basis, N=1,997 properties, closures not netted out)
The combination that matters most in practice is the third point, “flat throughout the period”, together with the second, “just under three months”. The 2016 programme spent six months walking the discount down from 70% to 50% and from 50% to 40%, so the lift to demand thinned out in stages. This time the rate is constant while the window itself is less than half as long. The same order of funding is concentrated into a shorter window, so the lift in October–December 2026 should come through more strongly than last time — and by the same token, pull-forward (trips being shifted into the subsidised window) is more likely to be pronounced. What January–March looks like after the programme depends on how much of that pull-forward occurred. On the pace within the programme itself, our tracking of October–December inventory sell-through shows November running at broadly the same level as October, with December still too early to read.
The fourth point, supply, also matters. Of the roughly 7,971 properties and about 213,000 rooms MetroEngines Research covers across Kyushu’s seven prefectures, 1,997 properties and about 49,000 rooms have been confirmed as opening since 2017 (on an OTA-listing-confirmed basis; 2026 is still being observed, since listings appear several months ahead of opening, and the count will rise). Even if the same volume of demand returns as in 2017, the room nights allocated per property are thinner than they were then.
Current rate levels, and three scenarios for January–March 2027
What budget-setters need is a sense of the level ahead. Start with where things stand. MetroEngines Research’s estimated settled ADR shows Kumamoto down 10.0% year on year in July 2026, the month of the earthquake, and Oita down 9.4%, with August turning back toward recovery at −5.0% and −4.1% respectively. Fukuoka moved less, at −0.0% in July and −2.1% in August.
Monthly estimated settled ADR (Kumamoto N=386–404 properties, Oita N=436–470 properties). Source: MetroEngines Research
Next, the level for January 2027. The table below sets the January and February 2026 actuals alongside a level estimated from the prices currently published on OTAs for January 2027.
| Prefecture | Jan 2026 actual |
Feb 2026 actual |
Jan 2027 (estimated from current listings) |
N (Jan 2027) |
|---|---|---|---|---|
| Fukuoka | ¥12,029 | ¥12,141 | ¥12,943 | 405 |
| Saga | ¥14,166 | ¥11,459 | ¥15,694 | 118 |
| Nagasaki | ¥8,259 | ¥8,290 | ¥10,718 | 193 |
| Kumamoto | ¥11,842 | ¥10,407 | ¥12,773 | 282 |
| Oita | ¥17,261 | ¥15,012 | ¥17,664 | 346 |
| Miyazaki | ¥7,142 | ¥8,962 | ¥9,568 | 115 |
| Kagoshima | ¥7,292 | ¥7,231 | ¥9,807 | 255 |
Estimated settled ADR (two guests per room, per room, tax-exclusive equivalent). Source: MetroEngines Research
One caution here: the January and February 2026 actuals and the January 2027 estimate rest on different foundations. The former is a level based on confirmed results; the latter is estimated from prices published on OTAs as of the survey date (September 2026), and the two cannot simply be differenced into a year-on-year comparison. The January 2027 figure is best read as a reference point for “where properties have currently set their pricing”, and it will move as the check-in date approaches through added plans and price adjustments.
Three scenarios for January–March 2027
On that basis, we set out three ranges for where Kyushu’s seven prefectures land in January–March 2027. The anchor is the January–March 2017 result — namely total +2.3%, Japanese +1.6% and foreign +6.5%, all year on year, in the quarter immediately after the earlier programme ended. Read the table below not as a forecast but as a range for setting budget and cash-flow assumptions.
| Jan–Mar 2027 Kyushu 7 prefectures |
Low | Mid | High |
|---|---|---|---|
| Japanese person-nights (vs same period 2026) | −3% to 0% | 0% to +2% | +2% to +4% |
| Foreign person-nights (vs same period 2026) | low single-digit growth | high single-digit to low double-digit growth | double-digit growth |
| Occupancy rate | in line with the same period of 2026 | same period of 2026 +1 to +2pt | same period of 2026, +3pt or more |
| Estimated settled ADR | in line with the same period of 2026 | slightly above the same period of 2026 | clearly above the same period of 2026 |
| What it requires | demand concentrated into a sub-three-month window leaves January and February weekdays thin; inbound growth slows | the same shape as January–March 2017: Japanese demand roughly flat, inbound lifting the total | guests who came during the programme start to repeat; the inbound shift toward Kyushu continues |
| January–March 2017 actual | Total +2.3% / Japanese +1.6% / foreign +6.5% (year on year). Against the same period of 2015: total +5.0%, Japanese −0.4%, foreign +56.8% | ||
The 2017 actuals are from the Japan Tourism Agency’s Overnight Travel Statistics Survey. The scenarios are the HotelBank Editorial Team’s framing, not forecasts
What separates the three ranges is, in the end, whether guests who came during the programme turn into guests who come without one. Under the 2016 programme, the total grew after it ended while Japanese demand had not fully returned to its 2015 level. Repeat that shape and you get the mid case; a heavy payback from pull-forward gives the low case; a build in repeat demand gives the high case.
| Foreign +5% | Foreign +12% | Foreign +20% | |
|---|---|---|---|
| Japanese −3% (heavy pull-forward payback) | -1.9% | -0.9% | +0.2% |
| Japanese 0% (flat) | +0.7% | +1.7% | +2.8% |
| Japanese +3% (repeat demand builds) | +3.3% | +4.3% | +5.4% |
Total growth is a weighted composite of “Japanese growth x 85.9% + foreign growth x 14.1%” (the mix is the January–June 2017 split used in this article). The shaded mid cell corresponds to the mid scenario in the table above. Applying the same procedure to the January–March 2017 actuals (Japanese +1.6%, foreign +6.5%) yields a total of +2.3%, matching that year’s reported figure. Read this as a range for setting assumptions, not as a forecast. If the foreign share rose to 20%, the same nine combinations would shift into a −1.4% to +6.4% range. Source: Japan Tourism Agency, Overnight Travel Statistics Survey; compiled by the HotelBank Editorial Team
Four axes with room left, heading into the sell-it-yourself period
The 2016 data also shows where there was still room to reach after the programme ended.
1. In-prefecture (local) demand. January–June in-prefecture stays across the seven prefectures were 5.36 million person-nights in 2017 against 5.60 million in 2015 — still 4.4% below the pre-earthquake level. While out-of-prefecture and inbound demand grew, local demand alone was left behind. Put the other way round, weekday plans aimed at local residents were the segment left most untouched after the programme ended. The higher the in-prefecture share, the more this axis pays: Miyazaki (26.5% in-prefecture) and Kagoshima (24.5%) stand out.
2. Weekdays and soft dates. Across the seven prefectures in 2017, Japanese demand settled into a flat band in the second half — September −1.9%, October −0.5%, December −0.9%. January–March is Kyushu’s natural low season, and how weekday inventory is filled in that window decides the revenue outcome. Preserving day-of-week and lead-time patterns from the booking data captured during the programme gives you the raw material for pricing the following January–March.
3. Multi-night stays. This programme is designed with weight on longer and multi-prefecture trips: a ¥30,000 cap for transport-inclusive stays of two nights or more and ¥35,000 for multi-prefecture itineraries. Raise the share of multi-night bookings during the programme and you are left with a sales design evaluated on stay value rather than a one-night rate. The 2017 fact that business-oriented properties in Kumamoto outgrew leisure-oriented ones shows how much long stays can support a prefecture’s demand.
4. Inbound. What lifted Kyushu’s total from 2016 to 2017 was foreign demand. Oita +98.6%, Kagoshima +105.1% and Saga +118.7% (all versus the same period of 2015) — in some prefectures it doubled in two years. Inbound visitors to Japan reached 42.68 million in 2025, about 1.8 times the 2016 level, so the base is already an order of magnitude different. Listings, multilingual support and payment options put in place for inbound guests during the programme carry straight into the January–March period afterwards. That window also overlaps with Lunar New Year demand from East Asia, which matters for Kyushu.
⚠ A note on ADR for future dates: the estimated settled ADR shown here for January 2027 is based on prices published on OTAs as of the survey date (September 2026) and will move as the check-in date approaches. Because it rests on a different foundation from the actual months (January and February 2026), the two cannot be compared directly as a year-on-year change. Selling conditions from January 2027 onward may also shift depending on the Kyushu Fukko Ouenwari’s covered period and how quickly the budget is used.
Summary
In the six months right after the 2016 Kyushu Fukko Wari ended, person-nights across Kyushu’s seven prefectures were up 8.7% year on year, and 4.3% above the pre-earthquake same period of 2015. Occupancy rose above the prior year in all seven. The image of a uniform drop the moment the programme expires is not supported by the Japan Tourism Agency’s confirmed figures.
The composition, however, was split. Japanese guests alone remained 0.6% below the 2015 level, and what lifted the total was foreign demand, up by half again. Oita looked recovered at +0.8% in total while Japanese demand was −10.6%; Kumamoto’s +19.3% was led by business rather than leisure. Build your own property’s outlook from the total alone and you will misread the quality of the demand.
The 2026 programme carries about ¥15.5bn, less than last time; runs just under three months, less than half as long; and holds the discount rate flat throughout. Concentrating a similar budget into a shorter window makes the October–December lift more likely to come through strongly, and by the same token makes pull-forward heavier. Where January–March 2027 lands turns on how much of that pull-forward occurred and on whether the inbound shift toward Kyushu continues. When you track the numbers, we would suggest always showing both the change versus the same months of 2026 and versus 2025. As Nagasaki shows, the verdict flips depending on where the base year sits.
Related reading
References and sources
■ Data sources
This article combines the Japan Tourism Agency’s Overnight Travel Statistics Survey (confirmed prefecture-level monthly figures, 2014–2017) with MetroEngines Research’s estimated settled ADR (Kyushu’s seven prefectures, monthly, September 2024 – February 2027). Figures for 2016 and earlier come from e-Stat entries; because 2017 is not registered on e-Stat, those figures were taken from the tabulated results published by the Japan Tourism Agency (Heisei 29). On the supply side, the 7,971 properties and 213,074 rooms covered across the seven prefectures were tabulated by year of opening, with 1,997 properties and 49,421 rooms identified as opening from 2017 onward.
■ Assumptions behind the estimates
The three scenarios and the sensitivity grid for January–March 2027 are not forecasts; they are ranges for setting budget and cash-flow assumptions. The mid case is anchored on the January–March 2017 actuals (total +2.3%, Japanese +1.6%, foreign +6.5%, all year on year). Each sensitivity cell is a weighted composite of Japanese and foreign growth using the January–June 2017 mix (Japanese 85.9%, foreign 14.1%); applying the same procedure to the January–March 2017 actuals yields a total of +2.3%, matching the reported figure. Estimated settled ADR applies property-type correction factors to the cheapest plan each property publishes on OTAs (two guests per room, per room, tax included) to give an estimated settled rate on a tax-exclusive equivalent basis, and area-level figures use the median across the covered properties.
■ Limitations and caveats
The January 2027 estimated settled ADR is based on listed prices as of the survey date (September 2026) and rests on a different foundation from the actual months (January and February 2026), so the two cannot be differenced into a year-on-year comparison. It will move as check-in approaches through added plans and price adjustments. The count of new openings is on a listing-confirmed basis and does not net out closures; 2026 is still being observed. The “leisure / business” split classifies the property, not the purpose of the individual guest. Because the Kyushu Fukko Ouenwari can close early if its budget cap is reached, changes to the covered period or selling conditions could change the premises for January–March 2027.
■ Government statistics and public data
- Japan Tourism Agency, “Overnight Travel Statistics Survey” (Heisei 29 and Heisei 28 tabulated results)
- e-Stat, “Overnight Travel Statistics Survey”: Table 2, person-nights (statistics ID 0003313520); Table 8, room occupancy rate (0003313903); Table 9, person-nights by place of residence (0003313977)
- Japan Tourism Agency, “Reiwa 8 Kumamoto earthquake: related information” (includes the Kyushu Fukko Ouenwari)
- Japan Tourism Agency, “Inbound visitors and outbound Japanese travellers”
- Japan National Tourism Organization (JNTO), “Inbound visitor statistics”
■ Results and design of the 2016 programme
- Kyushu Tourism Promotion Organisation, “Kyushu Fukko Wari results (provisional) and an update on the ‘Thank you from Kyushu’ campaign”
- Nikkei, “Kyushu Fukko Wari used by 2,719,000 people, 1.8 times the target” (March 3, 2017)
- Imidas, “Kyushu Fukko Wari” (discount rates, caps and budget)
■ Coverage of the 2026 programme
- Travel Voice, “Japan Tourism Agency to launch the ‘Kyushu Fukko Ouenwari’ in October: 50% off travel and accommodation, 60% in Kumamoto and Kagoshima” (August 28, 2026)
- Travel Watch, “Oita’s ‘Kyushu Fukko Ouenwari’ runs through the end of December”
- Travel Watch, “Nagasaki’s ‘Kyushu Fukko Ouenwari’ runs through the end of December”
■ Academic literature
■ Market data
- MetroEngines Research — estimated settled ADR (Kyushu’s seven prefectures, September 2024 – February 2027) and coverage of new openings (on an OTA-listing-confirmed basis)