

When a hotel owner starts costing a renovation, the first line item on the estimate is neither guestroom interior unit costs nor equipment replacement. It is the cost of investigating the building before work starts, and the time it takes for those survey results to come back. For any building constructed before the total ban on the manufacture and use of asbestos-containing building materials in September 2006, a prior asbestos survey is legally mandatory every time refurbishment work is carried out, and above a certain threshold the results must be reported to the national government and the local authority. This article is not about what to fix. It is about what you are required to investigate before you fix it — and what percentage that surveying, reporting, removal and schedule extension adds to renovation capex.
Let us first draw the line against our earlier work. Japan’s pre-1981 hotel stock — 236,000 rooms, 19.1% of all guestrooms used the June 1981 new seismic standard as its boundary and dealt with structural safety and the retrofit-or-rebuild decision. This article draws two different boundaries — 1975 (the general prohibition on spraying asbestos) and 2006 (the total ban on asbestos-containing building materials) — and its subject is not rebuilding but the additional surveying, schedule and cost attached to ordinary renovation work. Both the boundary years and the question are different. Our earlier analysis of renovation investment versus new build in an era of rising construction costs, and Hotels at year 10, both dealt with the return side of renovation investment; this article counts an overlooked item on the cost side. It also differs in boundary year and purpose from 226,000 hotel rooms across 32 regional core cities, which measured renewal headroom against a 1996 boundary.
Metric Definitions Used in This Article
- ADR (average daily rate): an estimated settled rate (tax-exclusive equivalent) calculated by applying a category-specific correction coefficient to the lowest published plan level each property lists on OTAs (double occupancy, per-room rate, tax-inclusive). Cross-checked against property-level results disclosed by listed hotel REITs (91 properties, trailing three months), the median error is approximately 7%. These are estimates and differ from each property’s actual transacted prices and accounting figures. Segment-level ADR is the median of the properties in that segment (the level of a typical property).
- OCC (occupancy): the occupancy rates used in the calculations in this article are the room occupancy rates by facility type from the Japan Tourism Agency’s Overnight Travel Statistics Survey, 2025 annual figures (preliminary), not our own estimates.
- Opening-year cohort: segmentation by the opening year and month recorded in the property master. It is neither the year of building confirmation nor the year of structural completion. Properties that were rebuilt or fully reconstructed after opening remain in the older cohort, while properties that converted an old building into a hotel in recent years fall into the newer cohort. It does not indicate whether asbestos is actually present.
- Analysis population: of the approximately 168,000 domestic properties tracked by MetroEngines Research, 27,161 properties and 1,266,644 rooms could be confirmed as operating. From the 24,687 properties and 1,233,076 rooms that carry a recorded opening year and month, we excluded a block of data-origin batch-recorded values (described below), leaving 20,673 properties and 1,158,019 rooms as the analysis population (91.4% coverage on a room basis).
- Data sources: MetroEngines Research & Consulting (opening-year basis) / Ministry of Health, Labour and Welfare, Asbestos Information Portal / Ministry of Land, Infrastructure, Transport and Tourism, Asbestos Countermeasures Q&A / Japan Tourism Agency, Overnight Travel Statistics Survey
Key Takeaways
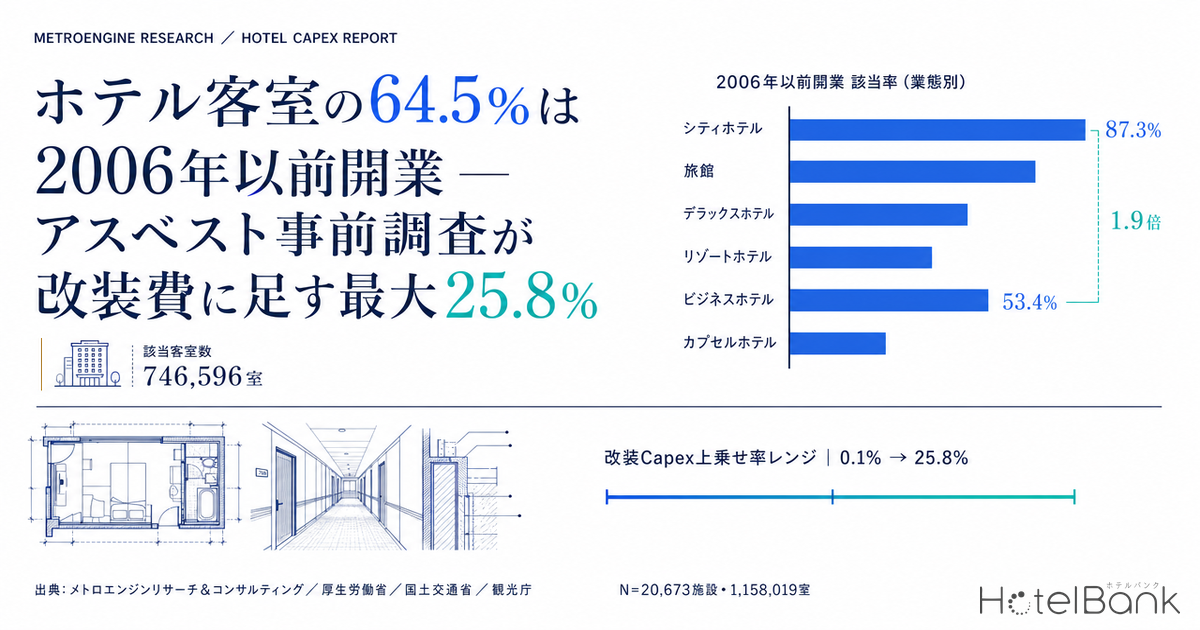
- 64.5% opened before 2006 — of the 1,158,019 rooms that are confirmed operating and carry an identifiable opening year and month, 746,596 opened before the total ban on asbestos-containing building materials (September 2006). The population that requires a prior survey every time it is renovated amounts to roughly two-thirds of Japan’s hotel and ryokan stock.
- A 1.9x spread by category — exposure runs 87.3% for city hotels, 84.9% for ryokan, 83.1% for deluxe hotels and 80.3% for resort hotels, against 53.4% for business hotels and 46.5% for capsule hotels; the gap between highest and lowest is 1.9x. Narrowing to properties opened before 1975, where the most friable sprayed materials could have been used, the gap widens to 9.7x — 49.5% for ryokan against 5.1% for business hotels.
- The survey is required on every job regardless of scale; reporting is set by a threshold — the prior survey itself is mandatory irrespective of project size, while the reporting obligation is triggered by demolition work with a combined demolished floor area of 80㎡ or more, or refurbishment work with a contract value of ¥1 million or more including tax. Even a guestroom bathroom refresh clears ¥1 million easily.
- The qualified-surveyor requirement is already fully in force — the requirement that prior surveys of buildings be conducted by a qualified party such as a certified building asbestos-containing material surveyor has applied since October 2023, and to structures since January 2026. Securing a surveyor now sets the start-on-site date.
- The add-on to renovation capex runs 0.1–25.8% — if no sprayed material is found, the survey cost alone amounts to 0.1–0.5%. If sprayed material equivalent to 5% of gross floor area is found, a full renovation of a 100-room business hotel carries 4.3–7.8% and a bathroom renovation at a 40-room ryokan carries 7.5–15.3%. The smaller the renovation, the smaller the denominator — and the higher the add-on rate climbs.
1975 and 2006 — the two lines drawn by law
Asbestos regulation has produced a number of dates that cut across building vintages. Two of them matter for investment decisions.
The first is 1975. The Ministry of Health, Labour and Welfare records that “in the past, work spraying asbestos for thermal insulation purposes was carried out in the construction of buildings and similar structures, but this was prohibited in principle in 1975.” Materials applied by that spraying process are what later came to be classified as “Level 1” — the most friable category. In MLIT’s framework, asbestos-containing building materials are classified for convenience into Levels 1 to 3 by their degree of dust generation: Level 1 is sprayed material, Level 2 is thermal insulation, heat insulation and fireproofing coating, and Level 3 is everything else, principally formed sheet materials. Buildings that opened before 1975 therefore carry a structurally higher probability of containing the category of material whose removal cost is an order of magnitude higher.
The second is September 2006. Building materials containing more than 0.1% asbestos by weight were comprehensively banned from manufacture and use at that point under the Ordinance on Industrial Safety and Health. Conversely, materials installed before that date may still contain asbestos — including Level 3 formed sheets — and must be investigated at every refurbishment. At the earlier 1995 stage, when the import and use of crocidolite (blue asbestos) and amosite (brown asbestos) were banned, the use of chrysotile (white asbestos) continued.
Thirty-one years separate the two lines. The pre-1975 layer carries “the possibility of high removal costs”; the 1975-to-2006 layer carries “the burden of surveying and reporting.” Each is a precondition of renovation.
| Date | Content of the regulation | Implication for renovation practice |
|---|---|---|
| 1975 | Work spraying asbestos prohibited in principle | Buildings predating this are more likely to contain highly friable sprayed material (Level 1 equivalent) |
| 1995 | Import and use of crocidolite and amosite banned | Later use was mainly chrysotile. The possibility of asbestos content itself remains |
| September 2006 | Total ban on the manufacture and use of building materials containing more than 0.1% asbestos by weight | Materials installed before this date, including formed sheets, are subject to survey |
| April 2021 | Prior surveys must combine a documentary review of design drawings and specifications with a visual inspection. Records must be retained for three years, kept at the worksite and displayed | Visual inspection alone is not enough; the availability of as-built drawings and refurbishment histories drives survey man-hours |
| April 2022 | Electronic system reporting of prior survey results made mandatory for work above a certain scale | A reporting step must now be completed before work starts |
| October 2023 | Prior surveys of buildings and ships must be conducted by qualified surveyors | Whether a surveyor can be secured determines the start-on-site date |
| January 2026 | The qualified-surveyor requirement extended to prior surveys of structures | Projects involving chimneys, storage equipment, piping and the like require a check of qualification categories |
What you must investigate before you fix — survey and reporting requirements
The MHLW Asbestos Information Portal sets out clearly which work is subject to reporting. Regardless of whether asbestos is present, reporting is required if the work falls into any of the following.
| Category | Scale that triggers reporting | Typical example in hotel renovation |
|---|---|---|
| Demolition of a building | Combined demolished floor area of 80㎡ or more | Tearing down an annex; removing a banquet wing |
| Refurbishment of a building | Contract value of ¥1 million or more including tax | Guestroom renewal, public bath refurbishment, HVAC and plumbing replacement |
| Demolition or refurbishment of specified structures | Contract value of ¥1 million or more including tax | Boiler chimneys, storage equipment, piping system replacement |
| Demolition or refurbishment of (steel) ships | Gross tonnage of 20 tons or more | (Not normally applicable to lodging facilities) |
Two practical points follow. First, the prior survey itself must be carried out on all work regardless of the scales above. Small jobs that fall below the reporting threshold still cannot skip the survey. Second, refurbishment of a building covers not only alterations and repairs but also work on building services such as gas supply, electricity supply, water supply and drainage. Replacing the bathroom in a guestroom or swapping out fan coil units becomes reportable once the contract value passes ¥1 million. At a 100-room hotel, even a job touching “just one floor” will clear that threshold.
Who is allowed to run the survey is fixed
Not just anyone can perform a prior survey. For buildings, it must be conducted by someone who has completed the training course for building asbestos-containing material surveyors — that is, one of the three categories of specified building asbestos-containing material surveyor, general building asbestos-containing material surveyor, or detached-house asbestos-containing material surveyor (the detached-house category is limited to detached houses and the interiors of dwelling units in apartment buildings) — or by someone registered with the Japan Asbestos Survey and Diagnosis Association on or before 30 September 2023 whose registration remains current. Because hotel and ryokan refurbishment falls outside the detached-house category, in practice this means securing a general or specified surveyor.
The effect on the investment schedule is straightforward. The start-on-site date cannot be fixed until a surveyor is assigned. Even with design and quantity surveying complete, work cannot begin until the sequence of survey, analysis (where required) and reporting has been followed. There are situations where the critical path of a renovation plan shifts from booking the contractor to booking the surveyor.
Which side of the line is the room stock on? 64.5% predates 2006
Now to the internal data. Of the 27,161 properties and 1,266,644 rooms confirmed as operating, 24,687 properties and 1,233,076 rooms carry a recorded opening year and month. However, this set contains a block of records with unknown opening dates that were batch-assigned to 1 January 1990. That single date alone accounts for 4,014 properties and 75,057 rooms — 13 times the 307 properties on the next most common date, 1 January 1989, an anomalous concentration. We treat these as opening year unknown and exclude them, leaving 20,673 properties and 1,158,019 rooms as the analysis population. Coverage is 91.4% on a room basis and 76.1% on a property basis (with the caveat that the exclusion may understate genuine 1990 openings to some degree).
The distribution shows three peaks in Japan’s lodging stock: the early 1970s (15,820 rooms in 1973), a long plateau from the late 1980s into the early 1990s, and a re-acceleration from 2005 onward. Of the two regulatory lines, 1975 cuts through the first peak, and 2006 falls between the end of the second plateau and the start of the third rise.
| Opening cohort | Properties | Rooms | Share of rooms | Asbestos position |
|---|---|---|---|---|
| Before 1975 | 3,615 | 168,469 | 14.5% | Before spraying was prohibited in principle. The layer most likely to carry Level 1 equivalent material |
| 1976–1996 | 5,190 | 355,319 | 30.7% | Spraying already regulated, but insulation and formed sheets may still contain asbestos |
| 1997–2006 | 3,137 | 222,808 | 19.2% | Chrysotile-dominant. Pre-total-ban, so formed sheets still require survey |
| 2007 onward | 8,731 | 411,423 | 35.5% | Opened after the total ban. The survey obligation itself still applies |
| Before 2006, total | 11,942 | 746,596 | 64.5% | — |
Rooms opened before 2006 number 746,596, or 64.5% of the total. The population for which the possibility of asbestos-containing material turning up in a prior survey has to be taken seriously accounts for roughly two-thirds of Japan’s hotel and ryokan stock. Of these, 168,469 rooms (14.5%) opened before 1975 and belong to the layer that may carry the sprayed material with the highest removal costs.
It bears emphasizing, however, that even properties opened from 2007 onward are not exempt from the prior survey obligation itself. Neither the reporting system nor the survey obligation draws a line at building vintage. A newer building simply has a higher probability that the survey concludes with “not present” — it does not license skipping the survey.
A 1.9x spread by category — 9.7x in the sprayed-material layer
| Category | Properties | Rooms | Pre-2006 | Exposure | Pre-1975 | Rate |
|---|---|---|---|---|---|---|
| Business hotels | 5,554 | 606,984 | 324,428 | 53.4% | 31,187 | 5.1% |
| City hotels | 1,069 | 174,105 | 151,937 | 87.3% | 30,618 | 17.6% |
| Ryokan | 5,876 | 151,553 | 128,711 | 84.9% | 75,024 | 49.5% |
| Resort hotels | 1,109 | 90,984 | 73,035 | 80.3% | 17,416 | 19.1% |
| Deluxe hotels | 110 | 29,092 | 24,165 | 83.1% | 6,080 | 20.9% |
| Capsule hotels | 196 | 26,482 | 12,303 | 46.5% | 2,379 | 9.0% |
Exposure is highest for city hotels at 87.3% (151,937 of 174,105 rooms). Many are large full-service properties that secured prime urban sites by the 1980s, and most are still operating. Ryokan follow at 84.9%, deluxe hotels at 83.1% and resort hotels at 80.3%.
By contrast, business hotels stand at 53.4%. The mass supply of limited-service properties was concentrated from the late 1990s onward, and the different formation period of the category itself shows through directly. Capsule hotels are lower still at 46.5%. For the same word “renovation,” the weight of the procedures required before breaking ground differs structurally between a city hotel and a business hotel.
The gap widens further in the pre-1975 layer. 49.5% of ryokan rooms (75,024 of 151,553) opened before spraying was prohibited in principle, against just 5.1% for business hotels — a 9.7x difference. Ryokan have a high share of timber and steel-frame construction, and many such structures never required sprayed fireproofing in the first place, so an early opening year does not translate directly into the probability of Level 1 material being present. Even so, plant rooms, boiler rooms and kitchen areas remain items to check regardless of vintage.
Size band and region — the denominator of survey cost changes
| Room count | Properties | Rooms | Pre-2006 | Exposure | Exposed properties |
|---|---|---|---|---|---|
| 1–19 rooms | 9,922 | 84,458 | 47,977 | 56.8% | 4,758 |
| 20–49 rooms | 4,176 | 132,000 | 90,407 | 68.5% | 2,833 |
| 50–99 rooms | 2,752 | 197,248 | 144,598 | 73.3% | 2,034 |
| 100–199 rooms | 2,578 | 362,184 | 213,552 | 59.0% | 1,539 |
| 200+ rooms | 1,245 | 382,129 | 250,062 | 65.4% | 778 |
Exposure peaks at 73.3% in the 50–99 room band, falls to 59.0% at 100–199 rooms, then returns to 65.4% above 200 rooms. What matters for investment decisions, however, is not the rate but the denominator. Restricting to properties of 100 rooms or more, 2,317 buildings and 463,614 rooms opened before 2006 — 62.1% of the 746,596 exposed rooms. At large properties the survey cost is contained within a single building, whereas the smaller the room count, the heavier the per-room survey burden. That asymmetry reappears directly as a difference in add-on rates in the calculations below. In prioritizing which buildings and which rooms to tackle first, our earlier work crossing location against guestroom ratings for renovation headroom in aging rooms at prime locations is also a useful reference.
Cost benchmarks — published unit rates exist, but they are 19 years old
MLIT publishes benchmark removal costs in its “Asbestos Countermeasures Q&A.” Three qualifications must stay attached whenever that table is cited.
| Asbestos treatment area | Removal cost | Treatment in this article |
|---|---|---|
| 300㎡ or less | ¥20,000/㎡ – ¥85,000/㎡ | Used as a floor |
| 300㎡–1,000㎡ | ¥15,000/㎡ – ¥45,000/㎡ | Used as a floor |
| 1,000㎡ or more | ¥10,000/㎡ – ¥30,000/㎡ | Used as a floor |
Qualification 1: these unit rates apply only to sprayed material (Level 1 equivalent), and the bands are treatment areas, not levels. They are not published in the form “Level 1 costs this much, Level 2 costs that much.” MLIT does not publish removal unit rates by level, and no official unit rates exist for Levels 2 and 3. In our calculations, unit rates are applied only to the portion equivalent to sprayed material; formed sheets and similar materials are handled through their effect on the schedule alone.
Qualification 2: the data are 19 years old, based on construction performance from January to December 2007. Over the same interval, unit construction starts costs for lodging-use buildings in MLIT’s Building Construction Statistics Survey rose 2.80x, from ¥699,000 per tsubo in 2011 to ¥1,955,000 per tsubo in 2024, and labor rates and material prices have risen consistently throughout. The figures in this table should therefore be treated as a floor in present-value terms, and cannot be used as a ceiling.
Qualification 3: the ranges are very wide. MLIT itself notes that “asbestos treatment costs vary substantially with circumstances (room shape, ceiling height, the presence of fixed equipment and other construction conditions materially change the extent of pre-start preparation and temporary works, producing a wide range in treatment costs),” and states explicitly that “the benchmark treatment costs in the table above are derived after trimming the top and bottom 15% of cases from the construction performance data.” In the 300㎡-or-less band, the ceiling is 4.25x the floor.
The anchor for survey cost is ¥250,000 per building
For survey costs, the only official benchmark is the subsidy cap set by the government. According to MLIT’s Asbestos Countermeasures Q&A, under the subsidy scheme for asbestos content surveys of private buildings, the subsidy is capped in principle at ¥250,000 per building. That subsidy, however, covers “surveys of the presence of asbestos content in sprayed material in buildings” — specifically sprayed asbestos, asbestos-containing sprayed rock wool, sprayed vermiculite, sprayed perlite and the like. A prior survey for refurbishment work, which covers all building materials including formed sheets, is broader than that scope. We use ¥250,000 per building as a floor anchor for sprayed-material surveys and assume that the prior survey cost for a full-building refurbishment is several times that. Because subsidy schemes are administered differently by each local authority, actual eligibility must be confirmed with the municipality where the property is located.
Building up two cases — the add-on rate to renovation capex
We now translate the regulatory requirements and unit rates above into two concrete renovation plans. One is a full renovation of a 100-room business hotel with 6,000㎡ of gross floor area; the other is a bathroom renovation at a 40-room ryokan. Both assume a pre-2006 opening. On the separate question of the order in which bathroom facilities should be renewed, our analysis of the rainy-season bathroom rating gap organizes the priorities across three axes: area, category and building age.
■ Calculation assumptions
- Case A: a 100-room business hotel with 6,000㎡ of gross floor area, full renovation. Renovation capex ¥550 million (¥5.5 million per room: ¥4.5 million of guestroom interiors plus ¥1 million equivalent of public areas and building services). ADR is the median estimated settled ADR of ¥7,340 (business hotels of 80–150 rooms opened before 2006, N=81 properties, trailing 12 months); occupancy is the 75.3% business hotel figure from the Japan Tourism Agency’s Overnight Travel Statistics Survey, 2025 annual figures. RevPAR ¥5,527.
- Case B: a 40-room ryokan with 2,400㎡ of gross floor area, bathroom renovation. Renovation capex ¥100 million (guestroom bathrooms plus the public bath). ADR is the median estimated settled ADR of ¥14,824 (ryokan of 25–60 rooms opened before 2006, N=77 properties, trailing 12 months); occupancy is the 38.4% ryokan figure from the same survey. RevPAR ¥5,692.
- Survey cost: ¥800,000 for Case A, ¥500,000 for Case B. Assumed values, set using MLIT’s ¥250,000 per building subsidy cap for sprayed-material surveys as a floor anchor and scaling up for a documentary review, visual inspection and sample analysis covering all building materials including formed sheets.
- Removal cost: the treatment-area unit rates in MLIT’s “Asbestos Countermeasures Q&A” Q40 (2007 construction performance). Sensitivity is taken at three levels where the treated area equivalent to sprayed material is 0%, 5% and 15% of gross floor area. No amount is booked for Level 2 and 3 equivalents because no official unit rates exist; they are handled on the schedule side only.
- Opportunity cost of schedule extension: additional closure days x room count x RevPAR. Case A assumes a full closure of 30 or 60 days where sprayed material is present, Case B 20 or 40 days — a conservative framing that compresses if phased floor-by-floor construction is possible.
- This is a simplified calculation; an actual investment decision requires a detailed feasibility study. The presence or absence of asbestos can be established only by survey and cannot be determined from the opening year.
| Sprayed-material area share | Treated area | Survey cost | Removal cost | Extra closure | Opportunity cost | Add-on amount | Add-on rate |
|---|---|---|---|---|---|---|---|
| 0% (none present) | — | ¥0.8m | ¥0 | 0 days | ¥0 | ¥0.8m | 0.1% |
| 5% | 300㎡ | ¥0.8m | ¥6m–25.5m | 30 days | ¥16.58m | ¥23.38m–42.88m | 4.3–7.8% |
| 15% | 900㎡ | ¥0.8m | ¥13.5m–40.5m | 60 days | ¥33.16m | ¥47.46m–74.46m | 8.6–13.5% |
| Sprayed-material area share | Treated area | Survey cost | Removal cost | Extra closure | Opportunity cost | Add-on amount | Add-on rate |
|---|---|---|---|---|---|---|---|
| 0% (none present) | — | ¥0.5m | ¥0 | 0 days | ¥0 | ¥0.5m | 0.5% |
| 5% | 120㎡ | ¥0.5m | ¥2.4m–10.2m | 20 days | ¥4.55m | ¥7.45m–15.25m | 7.5–15.3% |
| 15% | 360㎡ | ¥0.5m | ¥5.4m–16.2m | 40 days | ¥9.11m | ¥15.01m–25.81m | 15.0–25.8% |
Set the two tables side by side and the structure becomes clear. If no sprayed material is found, the add-on is only 0.1–0.5%. That is the survey cost alone, well within the margin of error on renovation capex. But once sprayed material equivalent to 5% of gross floor area appears, the figure jumps to 4.3–7.8% in Case A and 7.5–15.3% in Case B. At 15%, Case B reaches a maximum of 25.8% — a quarter of the renovation budget consumed by asbestos work.
Case B’s add-on rate runs close to double Case A’s not because the removal area is small, but because the denominator, renovation capex, is small. A full renovation of a 100-room business hotel costs ¥550 million against ¥100 million for a bathroom renovation at a 40-room ryokan. The same absolute addition is amplified 5.5x when read as a ratio. On top of that, in the 300㎡-or-less band MLIT’s unit rate ceiling is the highest at ¥85,000/㎡. Smaller renovations carry higher per-square-meter rates as well.
One further point: opportunity cost carries substantial weight. In Case A’s 5% scenario, ¥16.58 million of the ¥23.38–42.88 million add-on — fully 71% in the low case — is RevPAR forgone to closure. In other words, this line item should be managed as a question of time rather than of construction cost. Whether operations can continue through phased floor-by-floor construction, and whether removal work can be pushed into the low season, are the largest levers on the add-on amount. For a ryokan, the 38.4% occupancy that characterizes the category (room occupancy rate for ryokan, Japan Tourism Agency Overnight Travel Statistics Survey, 2025 annual figures, preliminary) also means, read the other way, considerable room to concentrate closure days in low-demand periods. All of the above concerns the cost side; how far renovation returns in guestroom ratings is something we aggregate separately in our ranking of properties where “renovated and clean” lifts satisfaction the most.
Three scenarios and schedule sensitivity — how far can the add-on rate be compressed?
The two cases above varied the sprayed-material area share across three levels — 0%, 5% and 15% — but held closure days fixed. As the previous section showed, the majority of the add-on is not construction cost but RevPAR forgone to closure. Below, using the same assumptions, we (1) reorganize the three levels as optimistic, central and pessimistic, and (2) show on two axes how far the add-on rate falls when closure days can be compressed. No new assumptions are introduced — every figure derives from the calculation assumptions above and MLIT’s published unit rates.
| Scenario | Sprayed-material area share | Case A add-on | Case A rate | Case A per room | Case B add-on | Case B rate | Case B per room |
|---|---|---|---|---|---|---|---|
| Optimistic | 0% (survey finds none) | ¥0.8m | 0.1% | ¥8k | ¥0.5m | 0.5% | ¥13k |
| Central | 5% | ¥23.38m–42.88m | 4.3–7.8% | ¥234k–429k | ¥7.45m–15.25m | 7.5–15.3% | ¥186k–381k |
| Pessimistic | 15% | ¥47.46m–74.46m | 8.6–13.5% | ¥475k–745k | ¥15.01m–25.81m | 15.0–25.8% | ¥375k–645k |
Read per room, the meaning of the gap changes. In the pessimistic scenario, Case A’s add-on is ¥475,000–745,000 per room, around a tenth of the ¥5.5 million per room renovation capex. Case B’s is ¥375,000–645,000 per room, but because capex is only ¥2.5 million per room, the rate bites more than twice as hard. The absolute amount is larger in Case A; the rate is heavier in Case B — which changes both how the budget is built and who is on the other side of the negotiation.
| Sprayed-material area share x removal unit rate | Closure 100% (full, no compression) | 75% | 50% | 25% | 0% (phased, no closure) |
|---|---|---|---|---|---|
| None present (0%) | 0.1% | 0.1% | 0.1% | 0.1% | 0.1% |
| 5%, removal rate low (¥20,000/㎡) | 4.3% | 3.5% | 2.7% | 2.0% | 1.2% |
| 5%, removal rate high (¥85,000/㎡) | 7.8% | 7.0% | 6.3% | 5.5% | 4.8% |
| 15%, removal rate low (¥15,000/㎡) | 8.6% | 7.1% | 5.6% | 4.1% | 2.6% |
| 15%, removal rate high (¥45,000/㎡) | 13.5% | 12.0% | 10.5% | 9.0% | 7.5% |
The reading is simple. Even in the pessimistic scenario (15% at the low unit rate), eliminating closure through phased construction drops the add-on rate from 8.6% to 2.6%. Conversely, the central scenario (5% at the high unit rate) with a full closure costs 7.8%, well above the 2.6% of pessimistic-with-no-closure. In other words, there are situations where “can the work be done without stopping operations” matters more to the add-on rate than “how much asbestos turns up.” Removal unit rates leave little room to negotiate; the construction sequence can be chosen at the design stage. Put these two axes into the sensitivity analysis and the day the survey results land, you can move straight to redesigning the schedule.
Sharpening the renovation capex estimate — four practical points
1. Assemble as-built drawings and refurbishment histories first
Since April 2021, a prior survey has required both a documentary review of design drawings and specifications and a visual inspection (except where no documents exist). If as-built drawings, specifications and past refurbishment records are on hand, the documentary review narrows the scope; if they are not, the range of visual inspection and analysis widens and both survey cost and days expand. Confirming whether drawings exist during acquisition due diligence is worth it for this reason alone.
2. Put surveyor booking on the schedule
Since October 2023, prior surveys of buildings must be conducted by a qualified surveyor. Starting the survey after design and quantity surveying are complete means analysis and reporting still lie between you and breaking ground. Placing surveyor assignment in the same column as contractor booking prevents the start date from slipping.
3. Add “sprayed-material area share” to the sensitivity analysis
Renovation capex sensitivity is normally built around ADR lift and construction period, but for pre-2006 buildings a third axis earns its place. Running 0%, 5% and 15% in advance removes the need to renegotiate the budget once survey results arrive. Quantifying uncertainty up front is what makes the later decision fast.
4. Evaluate low-season scheduling as an ROI item
Where opportunity cost accounts for the majority of the add-on, the value of shifting removal work into the demand trough can be quantified. The greater a property’s seasonal RevPAR spread, the greater the return on that scheduling adjustment. “When you build” carries the same weight as “what it costs” for this line item.
Finally, where does this line item sit within the overall picture of renovation capex? As our earlier analysis of renovation versus new build in an era of rising construction costs showed, investment unit costs for large-scale renovation projects in 2026 range from ¥23.86 million to ¥48.56 million per room, or 30–70% of new-build cost. Renovation wins against new build precisely because the existing structure can be reused. Asbestos-related cost is an item that attaches to that choice to reuse the existing structure. It does not arise on a new build. Factor in, at the comparison stage, the fact that renovation capex estimates carry a line item with a 0%-to-25% swing, and you can measure the real margin of advantage for the renovation case more accurately. The same swing applies to room-level investment decisions such as capex payback on guestroom specifications, wherever the subject is a pre-2006 building.
What this metric can and cannot tell you
The aggregation in this article is based on opening year and month. It is neither the year of building confirmation nor the year of structural completion. Consequently (1) properties rebuilt or fully reconstructed after opening remain in the older cohort, and (2) properties that converted a pre-2006 building into a hotel in recent years fall into the newer cohort. Errors run in both directions.
More importantly, asbestos content cannot be determined from the opening year in any way. Even among buildings that opened in the same year, the presence or absence of asbestos differs entirely with structure, construction method and finish material choices. Actual presence is established only by prior survey. This article therefore makes no estimates naming individual properties and limits its analysis to cohort aggregates at the national and category level. Decisions on individual assets require a documentary review, visual inspection and, where necessary, analysis conducted by a qualified surveyor.
What this is useful for is sizing the market as a whole and getting a first read on capex budgets at the portfolio level. Read it as a first-pass screen for counting how many of the rooms you own sit in buildings that require a survey step every time they are renovated.
Frequently asked questions
Q. Is a prior asbestos survey always required for hotel renovation work?
A. Yes. The MHLW Asbestos Information Portal states explicitly that “the prior survey itself must be carried out on all work regardless of the scales above.” What changes with project scale is not whether a survey is needed, but whether the results must be reported to the Labour Standards Inspection Office and the local authority.
Q. At what project scale does the reporting obligation arise?
A. Regardless of whether asbestos is present, reporting is required where the work is (1) demolition of a building with a combined demolished floor area of 80㎡ or more, (2) refurbishment of a building with a contract value of ¥1 million or more including tax, (3) demolition or refurbishment of specified structures with a contract value of ¥1 million or more including tax, or (4) demolition or refurbishment of a steel ship of 20 gross tons or more. Refurbishment of a building covers not only alterations and repairs but also work on building services such as gas supply, electricity supply, water supply and drainage.
Q. Is a survey unnecessary for hotels that opened in 2007 or later?
A. No. The prior survey obligation does not draw a line at building vintage, so it applies regardless of opening year. That said, because asbestos-containing building materials were comprehensively banned from manufacture and use in September 2006, sections built after that date have a higher probability of the survey concluding with “not present.”
Q. Who is permitted to conduct the prior survey?
A. For buildings, it must be conducted by someone who has completed the training course for building asbestos-containing material surveyors (the three categories of specified building, general building, and detached-house asbestos-containing material surveyor), or by someone registered with the Japan Asbestos Survey and Diagnosis Association on or before 30 September 2023 whose registration remains current at the time of the survey. This qualified-surveyor requirement has applied to buildings and ships since October 2023 and to structures since January 2026. Note that the detached-house category is limited to detached houses and the interiors of dwelling units in apartment buildings, so hotels and ryokan fall outside it.
Q. Where can benchmark removal costs be checked?
A. MLIT’s “Asbestos Countermeasures Q&A” Q40 publishes benchmark removal costs for asbestos-containing sprayed material by treatment area: ¥20,000–85,000/㎡ for 300㎡ or less, ¥15,000–45,000/㎡ for 300–1,000㎡, and ¥10,000–30,000/㎡ for 1,000㎡ or more. These are based on construction performance data from January to December 2007, however, and are unit rates for sprayed material only. No official unit rates are published for Level 2 and Level 3 equivalent materials.
Q. How many hotel rooms nationwide opened before 2006?
A. Aggregating the 20,673 properties and 1,158,019 rooms among the properties tracked by MetroEngines Research that are confirmed operating with an identifiable opening year and month, 11,942 properties and 746,596 rooms opened before 2006 — 64.5% on a room basis. Of these, 3,615 properties and 168,469 rooms (14.5%) opened before 1975.
Further reading
- Japan’s Pre-1981 Hotel Stock: 236k Rooms, 19.1% — Retrofit or Rebuild
- Hotels at Year 10: The Renovation Gap Is +13.6% Below 100 Rooms
- 226k Hotel Rooms in 32 Regional Cities: 42.7% Built Before 1996
- Hotel Bathroom Review Gap: Area x Category x Age 3-Axis Analysis
References and sources
■ Data sources
The room stock aggregation uses the MetroEngines Research & Consulting property master (as of August 2026). From 27,161 properties and 1,266,644 rooms confirmed as operating, we extracted the 24,687 properties and 1,233,076 rooms carrying a recorded opening year and month, then excluded the 4,014 properties and 75,057 rooms batch-recorded to 1 January 1990 as opening year unknown, leaving 20,673 properties and 1,158,019 rooms as the analysis population (91.4% coverage on a room basis). Regulatory and legal content follows what is published by the Ministry of Health, Labour and Welfare’s Asbestos Information Portal and MLIT’s “Asbestos Countermeasures Q&A”; removal unit rates come from Q40 of that Q&A (calculated from construction performance data between January and December 2007); occupancy rates are the room occupancy rates by facility type from the Japan Tourism Agency’s Overnight Travel Statistics Survey, 2025 annual figures (preliminary). Each is used as published at the time of reference.
■ Limitations and caveats
(1) The aggregation is based on opening year and month, not the year of building confirmation or structural completion. Properties rebuilt or fully reconstructed after opening remain in the older cohort, and properties that converted an old building into a hotel in recent years fall into the newer cohort, so errors run in both directions. (2) Asbestos content cannot be determined from the opening year. Actual presence is established only by a prior survey conducted by a qualified surveyor, so this article makes no estimates naming individual properties and limits its analysis to cohort aggregates at the national and category level. (3) Removal unit rates are based on 2007 construction performance — data that is 19 years old and does not incorporate subsequent increases in labor rates and material prices. They should be treated as a floor in present-value terms and cannot be used as a ceiling. They also apply only to sprayed material (Level 1 equivalent); no official unit rates exist for Level 2 and 3 equivalent materials. (4) Survey costs, closure days and renovation capex levels are assumed values set for the purposes of calculation, not actual figures. (5) Openings from 2018 onward are structurally understated because of the observation lead time between opening and OTA listing.
■ Market data
- MetroEngines Research & Consulting — room stock aggregation on an opening-year basis (N=20,673 properties / 1,158,019 rooms), estimated settled ADR (business hotels N=81 properties, ryokan N=77 properties)
■ Regulation and law (primary sources)
- Ministry of Health, Labour and Welfare, “About the Asbestos Prior Survey Result Reporting System” (Asbestos Information Portal)
- Ministry of Health, Labour and Welfare, “To Prime Contractors” (Asbestos Information Portal)
- Ministry of Health, Labour and Welfare, “Q&A on Asbestos”
- Ministry of Land, Infrastructure, Transport and Tourism, “Asbestos Countermeasures Q&A” (level classification, benchmark removal costs, subsidy scheme)
- Ministry of the Environment, “The Asbestos Prior Survey Result Reporting System Starts on 1 April” (press release)
■ Government statistics
- Japan Tourism Agency, “Overnight Travel Statistics Survey (2025 annual figures, preliminary)” — room occupancy rate by facility type
- Ministry of Land, Infrastructure, Transport and Tourism, “Building Construction Statistics Survey (Construction Starts Statistics)” — unit construction starts costs for lodging-use buildings