

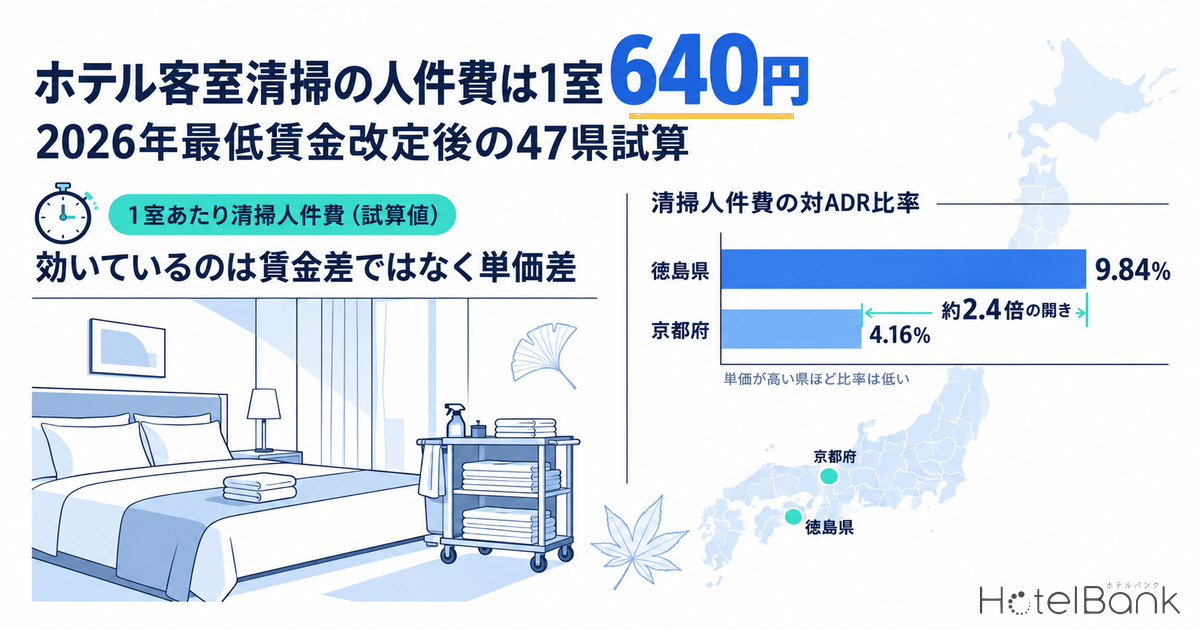
Japan’s regional minimum wages for fiscal 2026 have been raised in all 47 prefectures, bringing the national weighted average, based on the council recommendations, to ¥1,177 (+¥56 year on year). The new rates take effect in stages between October 1 and December 2. Room cleaning is the single most labor-hour-intensive process in the lodging business, so this revision feeds directly into the per-room cost structure. In this article we combine each prefecture’s regional minimum wage with the time needed to clean one room to estimate the “housekeeping labor cost per room” in all 47 prefectures, and what percentage of the estimated settled ADR it represents. The bottom line: under the 25-minute scenario, the cost-to-ADR ratio ranges from 4.16% in Kyoto to 9.84% in Tokushima, a gap of roughly 2.4x.
Metric Definitions Used in This Article
- ADR (Average Daily Rate): An estimated settled rate (tax-excluded equivalent), calculated by applying a property-type adjustment factor to the lowest-priced plan each property publishes on OTAs and other channels (double occupancy, per-room rate, tax-included). Checked against property-level results disclosed by listed hotel REITs (91 properties, most recent 3 months), the median error is about 7%. These are estimates and differ from each property’s actual transaction prices and accounting figures. Area-level ADR is the median of covered properties (the level of a typical property in the area). This article uses the 12-month average from September 2025 to August 2026 (for Hyogo only, an 11-month average excluding November 2025, when the number of covered properties temporarily fluctuated sharply).
- Housekeeping labor cost per room (estimate): Regional minimum wage × cleaning time × statutory welfare cost factor 1.16 × indirect time factor 1.20. This is an estimate based on the assumptions described below and does not represent actual amounts paid.
- Cost-to-ADR ratio: The housekeeping labor cost above divided by the estimated settled ADR.
- Data sources: MetroEngines Research (ADR); Ministry of Health, Labour and Welfare (MHLW) and prefectural labour bureau publications (minimum wages)
- — ¥629–742 per room at 25 minutes (¥683 at the national weighted average of ¥1,177). The ¥195 regional gap in minimum wages shrinks to a ¥113 (1.18x) difference per room once compressed into 25 minutes.
- — The cost-to-ADR ratio ranges about 2.4x, from 4.16% (Kyoto) to 9.84% (Tokushima). The spread is driven not by the wage gap (1.18x) but by the regional gap in estimated settled ADR (2.5x).
- — This year’s revision adds ¥31–38 per room, or 0.2–0.3% of ADR. Assuming a full year from October 2026 onward, a 100-room hotel at 75% occupancy faces ¥0.86–1.03 million more per year, recoverable with a ¥31–38 rate increase per night.
- — Cutting cleaning time by 5 minutes (¥148) saves more than the Tokyo–Okinawa wage gap (¥112). Among the variables operators can control, process design has more leverage than location.
- — Combining three labor-saving measures cuts cost by 28%, pushing the 6.64% national median down to about 4.8%. The lower a market’s rates, the larger the impact on the ratio.
Fiscal 2026 Revision Lifts the Wage Floor to ¥1,085–1,280
On September 3, 2026, the Ministry of Health, Labour and Welfare compiled and published the revised regional minimum wages for all 47 prefectures. Increases fall within a range of ¥54 to ¥65, and 33 of the 47 prefectures received recommendations above the guideline set by the Central Minimum Wages Council. The highest is Tokyo at ¥1,280 and the lowest is Miyazaki at ¥1,085, a difference of ¥195.
What matters for lodging businesses is that the revision does not take effect on a single nationwide date. While 15 prefectures switch over on October 1, Kyoto follows on November 16, Iwate and Kumamoto on December 1, and Okinawa on December 2, spreading effective dates out toward year-end. In other words, even within the same fiscal year, the month in which the cost increase starts to hit the P&L differs by up to two months depending on the region. For multi-site operators, the gap is large enough to justify splitting monthly budgets by region.
When thinking about housekeeping labor costs, the minimum wage is not the same as the hourly wage actually paid. Prevailing advertised hourly wages often exceed it, so here we use it as a floor benchmark. Please read all estimates that follow as a floor: “at least this much will be incurred.”
20, 25 or 30 Minutes per Room — Three Cleaning-Time Scenarios
Industry rules of thumb for the time needed to clean one room are roughly as follows: about 20 minutes for a business-hotel room of around 18㎡, and roughly 20–30 minutes for limited-service hotels with standardized fixtures. City hotels, resorts and ryokan with Japanese-style rooms take longer, as floor area, the number of amenities and the complexity of bed-making all increase. Many outsourced-cleaning rate cards also price in time bands — 20-minute, 30-minute and 40-minute classes — showing that time effectively functions as the unit of cost.
Centering on limited-service hotels, this article sets three scenarios: 20, 25 and 30 minutes. Twenty minutes assumes well-designed workflows and task management, 25 minutes is standard, and 30 minutes assumes rooms that are larger or carry more amenities.
Housekeeping labor cost per room was calculated with the following formula.
■ Formula and Assumptions
Housekeeping labor cost per room = Regional minimum wage × (Cleaning time ÷ 60) × 1.16 × 1.20
- Statutory welfare cost factor 1.16: Set at roughly 16%, the combined total of health insurance (employer share approx. 4.9%), employees’ pension (9.15%), employment insurance (employer share approx. 0.85%), workers’ accident compensation insurance and the child and childcare contribution. This is a typical level based on the FY2026 Kyokai Kenpo rate for Tokyo (9.85%) and the FY2026 employment insurance rate, and it varies with industry, age mix and the workers’ compensation rate.
- Indirect time factor 1.20: An assumed value setting time spent outside direct in-room work — carrying linens and amenities, moving between rooms, waiting for inspections, morning briefings and handovers — at 20% of direct time.
- Supplies, linens, laundry, supervisor wages and recruiting costs are not included (labor cost only).
*All factors are values set for this article, not measured values. Please substitute your own operating results.
Plugging the fiscal 2026 revised rates into this formula puts housekeeping labor cost per room under the 25-minute scenario in a range from around ¥630 in Okinawa, Kochi and Miyazaki to ¥742 in Tokyo and Kanagawa. The gap between the highest and lowest is ¥113, a ratio of only 1.18x. Even with a ¥195 regional gap in minimum wages, compressing it into a short 25-minute task leaves an absolute difference of just over ¥100 per room.
Cost-to-ADR Ratio of 4.16%–9.84% — Driven by Rate Gaps, Not Wage Gaps
The picture changes, however, once this housekeeping labor cost is divided by the estimated settled ADR. Under the 25-minute scenario, the cost-to-ADR ratio is lowest in Kyoto at 4.16% and highest in Tokushima at 9.84%, a gap of about 2.4x. The per-room cost differs by only 1.18x, yet the ratio differs by 2.4x because the regional gap in ADR, the denominator, is far larger than the wage gap in the numerator.
In fact, Kyoto’s estimated settled ADR averages about ¥16,500 over 12 months (N=588 properties) versus about ¥6,500 in Tokushima (N=141 properties), a 2.5x gap. Minimum wages, by contrast, are ¥1,180 and ¥1,103, a difference of only 1.07x. Put another way, what determines the weight of housekeeping labor cost is not where you hire but how much you sell rooms for.
Source: Compiled by HotelBank Editorial Team from MetroEngines Research and MHLW publications
This structure is actually good news for high-wage regions. Tokyo has the country’s highest minimum wage at ¥1,280, but with an estimated settled ADR of about ¥14,500, its cost-to-ADR ratio is 5.11%, below the national median (6.64%). Kanagawa is similar at 5.26%. Conversely, the highest ratios appear in prefectures with ADRs around ¥7,000, such as Tokushima (9.84%), Ibaraki (9.46%), Kagoshima (9.28%), Miyazaki (9.13%) and Ehime (9.08%).
Source: Compiled by HotelBank Editorial Team from MetroEngines Research and MHLW publications
As the scatter chart shows, the relationship between the cost-to-ADR ratio and ADR follows a near-hyperbolic curve. This means the room for improving the ratio lies not in “finding places where wages are cheap” but in raising rates. For a prefecture with a ¥7,000 ADR to bring the ratio down from 9% to 7%, it must either cut costs by 22% or raise ADR to ¥9,000 — and the latter offers more paths to get there.
Nationwide Map: High-Ratio Prefectures Cluster in Western Japan and Northern Kanto
Plotting the 25-minute cost-to-ADR ratio on a map makes the skew in its distribution easier to see. Prefectures above 8% cluster in Shikoku, southern Kyushu and northern Kanto, while major metropolitan areas such as Kyoto, Tokyo, Kanagawa and Hyogo, and high-rate tourist destinations such as Oita, Shizuoka, Nara and Nagano, sit at 5% or lower. Circle size reflects the height of the ratio.
Source: Compiled by HotelBank Editorial Team from MetroEngines Research and MHLW publications
Top 20 Prefectures by Cost-to-ADR Ratio — Markets with the Most Room to Raise Rates
The following lists the 20 prefectures with the highest cost-to-ADR ratios under the 25-minute scenario. The ranking does not reflect operating skill; it shows markets where the cleaning process weighs relatively heavily against the level of room rates. Seen the other way, these are also markets where moving ADR by just a few hundred yen visibly improves the ratio.
| Rank | Prefecture | Minimum wage (FY2026) | Effective date | Cleaning labor cost (25 min, per room) | Est. settled ADR | Cost-to-ADR ratio | N (properties) |
|---|---|---|---|---|---|---|---|
| 1 | Tokushima | ¥1,103 | 2026/11/01 | ¥640 | ¥6,499 | 9.84% | 141 |
| 2 | Ibaraki | ¥1,136 | 2026/10/18 | ¥659 | ¥6,968 | 9.46% | 312 |
| 3 | Kagoshima | ¥1,090 | 2026/10/25 | ¥632 | ¥6,810 | 9.28% | 317 |
| 4 | Miyazaki | ¥1,085 | 2026/10/24 | ¥629 | ¥6,895 | 9.13% | 163 |
| 5 | Ehime | ¥1,093 | 2026/11/01 | ¥634 | ¥6,985 | 9.08% | 210 |
| 6 | Iwate | ¥1,090 | 2026/12/01 | ¥632 | ¥7,205 | 8.77% | 253 |
| 7 | Saitama | ¥1,196 | 2026/10/01 | ¥694 | ¥8,022 | 8.65% | 214 |
| 8 | Toyama | ¥1,119 | 2026/10/01 | ¥649 | ¥7,604 | 8.54% | 164 |
| 9 | Yamaguchi | ¥1,101 | 2026/10/08 | ¥639 | ¥7,543 | 8.47% | 195 |
| 10 | Fukushima | ¥1,094 | 2026/10/16 | ¥635 | ¥7,510 | 8.45% | 438 |
| 11 | Nagasaki | ¥1,087 | 2026/11/02 | ¥630 | ¥7,813 | 8.07% | 254 |
| 12 | Aomori | ¥1,090 | 2026/10/29 | ¥632 | ¥7,924 | 7.98% | 184 |
| 13 | Kochi | ¥1,086 | 2026/10/29 | ¥630 | ¥7,936 | 7.94% | 119 |
| 14 | Kagawa | ¥1,092 | 2026/10/01 | ¥633 | ¥8,004 | 7.91% | 160 |
| 15 | Akita | ¥1,090 | 2026/10/14 | ¥632 | ¥7,999 | 7.90% | 172 |
| 16 | Aichi | ¥1,195 | 2026/10/01 | ¥693 | ¥8,777 | 7.90% | 506 |
| 17 | Shiga | ¥1,136 | 2026/10/03 | ¥659 | ¥8,409 | 7.84% | 160 |
| 18 | Okayama | ¥1,104 | 2026/10/02 | ¥640 | ¥8,328 | 7.69% | 191 |
| 19 | Hiroshima | ¥1,141 | 2026/10/11 | ¥662 | ¥8,692 | 7.61% | 300 |
| 20 | Tottori | ¥1,090 | 2026/10/03 | ¥632 | ¥8,619 | 7.33% | 150 |
Source: Compiled by HotelBank Editorial Team from MetroEngines Research (estimated settled ADR is the 12-month average for Sep 2025–Aug 2026; N = median number of covered properties per prefecture) and MHLW publications
For example, if Tokushima raises ADR from ¥6,500 to ¥8,000, the ratio falls from 9.84% to 8.0% even with housekeeping labor cost unchanged at ¥640. That is a ¥1,500 increase per room, equivalent to 23% of the prefecture’s estimated settled ADR — a range reachable through peak-season pricing and the design of meal-inclusive plans.
Bottom 20 Prefectures by Cost-to-ADR Ratio — Markets Where Cleaning Weighs Lightly
| Rank | Prefecture | Minimum wage (FY2026) | Effective date | Cleaning labor cost (25 min, per room) | Est. settled ADR | Cost-to-ADR ratio | N (properties) |
|---|---|---|---|---|---|---|---|
| 28 | Tochigi | ¥1,125 | 2026/10/01 | ¥652 | ¥10,546 | 6.19% | 403 |
| 29 | Shimane | ¥1,092 | 2026/10/10 | ¥633 | ¥10,381 | 6.10% | 174 |
| 30 | Kumamoto | ¥1,092 | 2026/12/01 | ¥633 | ¥10,531 | 6.01% | 394 |
| 31 | Ishikawa | ¥1,113 | 2026/10/03 | ¥646 | ¥11,138 | 5.80% | 238 |
| 32 | Gifu | ¥1,121 | 2026/10/01 | ¥650 | ¥11,277 | 5.77% | 376 |
| 33 | Mie | ¥1,143 | 2026/10/01 | ¥663 | ¥11,751 | 5.64% | 355 |
| 34 | Fukui | ¥1,112 | 2026/10/04 | ¥645 | ¥11,516 | 5.60% | 212 |
| 35 | Yamanashi | ¥1,113 | 2026/11/01 | ¥646 | ¥11,736 | 5.50% | 294 |
| 36 | Fukuoka | ¥1,114 | 2026/10/04 | ¥646 | ¥11,761 | 5.49% | 470 |
| 37 | Gunma | ¥1,120 | 2026/10/03 | ¥650 | ¥12,083 | 5.38% | 433 |
| 38 | Nagano | ¥1,117 | 2026/10/02 | ¥648 | ¥12,078 | 5.36% | 815 |
| 39 | Okinawa | ¥1,086 | 2026/12/02 | ¥630 | ¥11,825 | 5.33% | 492 |
| 40 | Saga | ¥1,095 | 2026/11/15 | ¥635 | ¥12,059 | 5.27% | 154 |
| 41 | Kanagawa | ¥1,279 | 2026/10/01 | ¥742 | ¥14,101 | 5.26% | 573 |
| 42 | Tokyo | ¥1,280 | 2026/10/01 | ¥742 | ¥14,531 | 5.11% | 1,133 |
| 43 | Hyogo | ¥1,172 | 2026/10/01 | ¥680 | ¥13,295 | 5.11% | 544 |
| 44 | Shizuoka | ¥1,154 | 2026/10/15 | ¥669 | ¥13,536 | 4.94% | 847 |
| 45 | Nara | ¥1,107 | 2026/10/04 | ¥642 | ¥13,220 | 4.86% | 134 |
| 46 | Oita | ¥1,096 | 2026/11/01 | ¥636 | ¥14,857 | 4.28% | 466 |
| 47 | Kyoto | ¥1,180 | 2026/11/16 | ¥684 | ¥16,469 | 4.16% | 588 |
Source: Compiled by HotelBank Editorial Team from MetroEngines Research (estimated settled ADR is the 12-month average for Sep 2025–Aug 2026; N = median number of covered properties per prefecture) and MHLW publications
The bottom 20 split broadly into two groups: major metropolitan areas (Tokyo, Kanagawa, Hyogo) and prefectures with high rates driven by hot-spring and resort demand (Kyoto, Oita, Shizuoka, Nara, Nagano, Okinawa). Their position is unrelated to whether their minimum wage is high or low — Okinawa, for instance, has a minimum wage of ¥1,086 (among the lowest nationwide) yet a ratio of 5.33%, and Oita is at 4.28% with ¥1,096. High rates absorb the wage level.
Sensitivity to Cleaning Time — A 5-Minute Cut Moves the Ratio by 20%
Varying cleaning time across 20, 25 and 30 minutes changes housekeeping labor cost per room proportionally. Taking 25 minutes as the baseline, 20 minutes is −20% and 30 minutes is +20%. In ratio terms, Tokushima moves within 7.87%–11.81% and Kyoto within 3.32%–4.99%.
Source: Compiled by HotelBank Editorial Team from MetroEngines Research and MHLW publications
What stands out is that the effect of a 5-minute cut is larger than the regional gap in minimum wages. The difference in housekeeping labor cost per room between Tokyo and Okinawa is ¥112 under the 25-minute scenario, yet cutting cleaning time from 25 to 20 minutes within Tokyo itself lowers cost by ¥148. Among the variables operators can control, process design has more leverage than location. The number of rooms handled per employee — the premise for that process design — also varies considerably by prefecture.
| Cleaning time (labor cost per room) | ADR ¥7,000 | ADR ¥9,000 | ADR ¥11,000 | ADR ¥13,000 | ADR ¥15,000 |
|---|---|---|---|---|---|
| 20 min (¥546) | 7.80% | 6.07% | 4.96% | 4.20% | 3.64% |
| 25 min (¥683) | 9.75% | 7.59% | 6.21% | 5.25% | 4.55% |
| 30 min (¥819) | 11.70% | 9.10% | 7.45% | 6.30% | 5.46% |
Source: HotelBank Editorial Team estimates
Reading the intersection of your own per-room cleaning time and estimated settled ADR tells you where you stand. Note that the same 5-minute cut lowers the ratio more in markets with lower ADR. In the ¥7,000 ADR column, going from 25 to 20 minutes lowers the ratio by 1.95 points, versus only 0.91 points at ¥15,000. Looking from the rate side instead, keeping 25 minutes but raising ADR from ¥7,000 to ¥9,000 lowers the ratio from 9.75% to 7.59%, a 2.16-point drop — more effective than a 5-minute process cut. Whether to move process design or rate design first can be compared by the distance traveled across this table.
This Revision Adds ¥31–38 per Room, or 0.2–0.3% of ADR
The impact of the fiscal 2026 increases (¥54–65) on housekeeping labor cost per room, calculated under the 25-minute scenario, is as follows.
Increase × (25 ÷ 60) × 1.16 × 1.20 = Increase × 0.58. That is +¥31 per room in Tokyo (+¥54) and +¥38 per room in Saga (+¥65). Because effective dates vary by prefecture between October and December 2026, we convert this to a full-year basis: for a property with 100 rooms and 75% annual occupancy (an assumed value for this estimate) selling 27,375 room nights a year, the annual increase comes to roughly ¥0.86–1.03 million.
Absorbing this through pricing would require an ADR increase of just 0.21% in Tokyo and 0.31% in Saga. A property with a ¥14,500 ADR could recover the same amount with a ¥31 increase per night, and one with a ¥12,100 ADR with ¥38. This is smaller than the ¥100-per-night increments in which normal rate changes move. In other words, the revision itself falls within a range that can be absorbed in pricing design.
What matters more is that revisions accumulate year after year. If increases of +¥50 a year continue, that is +¥250 over five years, raising housekeeping labor cost per room by ¥145 and the cost-to-ADR ratio of a ¥7,000-ADR property by 2.1 points. It is worth building this slope into medium-term rate plans. The increase across total labor costs, beyond housekeeping alone, and the prefecture-by-prefecture distribution of the price pass-through needed to absorb it are also worth tracking; the revised minimum wage by prefecture and effective date is summarized in Japan Minimum Wage 2026: Chiba & Aichi ¥1,195, Oct 1-15 Rollout.
Where to Draw the Line Between In-House and Outsourced Cleaning
According to publicly available market information, the per-room price for outsourced room cleaning generally ranges from ¥1,500 to ¥3,500; by room size and cleaning time, it is ¥800–1,000 for the 20-minute class, ¥1,200–1,500 for the 30-minute class and ¥1,600–2,000 for the 40-minute class. Some sources cite ¥900–1,000 per single room. Hourly contracts are said to run ¥1,500–2,500.
This article’s estimate of in-house direct labor cost is ¥630–742 under the 25-minute scenario and ¥756–891 under the 30-minute scenario. Compared with the ¥1,200–1,500 outsourcing price for the 30-minute class, the difference is roughly ¥310–740 per room. That difference is the price of the following elements that an operator takes on itself when cleaning in-house.
| Element borne in-house | Details |
|---|---|
| Recruiting and training | Job advertising, interview hours, and wages during initial training before staff become productive |
| Supervisor labor cost | Inspections, shift scheduling, quality control |
| Actual gap in paid leave and social insurance | Portion above this estimate’s 1.16 factor; replacement staff when paid leave is taken |
| Absorbing seasonal swings | Fixed staffing costs on low-occupancy days |
| Equipment, detergents and consumables | Procurement and replacement of cleaning tools |
Source: Compiled by HotelBank Editorial Team
The rule for drawing the line is simple: if the total of the five elements above is less than the gap between the outsourcing price and in-house direct labor cost (¥310–740 for the 30-minute class), in-house has the edge. In-house cleaning works best for properties large enough to have a dedicated supervisor and with small year-round swings in occupancy; conversely, for small properties with large seasonal swings, outsourcing tends to keep total cost per room more stable, because outsourcing prices already build in the absorption of seasonal swings and the recruiting function.
How Much Does Labor Saving Move the Needle? Sensitivity of Three Measures
Applying effect estimates available from public information to this article’s model gives the following for measures that improve cleaning efficiency. Each has a wide upside and downside range and none shows a guaranteed effect, but they are usable for initial screening of investment decisions. Labor-saving investment subsidies can also shorten the payback period of such equipment, and the room count at which a three-year payback becomes feasible depends on property scale.
| Measure | Basis of effect | Sensitivity to cleaning labor cost | Tokyo, 25-min baseline |
|---|---|---|---|
| IoT cleaning task management | Real-time occupancy and check-out notifications automatically assign cleaning order. Efficiency gains from reduced time spent searching for vacant rooms, moving and waiting have been reported | −20% | ¥742→¥594 |
| Opt-in skipped cleaning / eco plans for multi-night stays | Practices such as skipping cleaning for stays of 2+ nights and inserting a regular clean every 3 nights are established at several chains. If 20% of stays are multi-night and half of those opt out, cleaning frequency falls by 10% | −10% | ¥742→¥668 |
| Workflow design and standardized checklists | Standardizing task sequence and supply placement. Equivalent to cutting cleaning time from 25 to 20 minutes | −20% | ¥742→¥594 |
| All three measures combined (overlap deducted) | Because task management and workflow design overlap in effect, estimated as the larger of the two plus skipped multi-night cleaning, not as a simple sum | −28% | ¥742→¥534 |
Source: Estimates by HotelBank Editorial Team based on public information and published industry cases
The −28% case combining all three measures is equivalent to pushing the 25-minute cost-to-ADR ratio from the 6.64% national median down to 4.8%. That would move high-ratio prefectures to the level of the bottom 20. In other words, labor-saving investment has a bigger impact on the ratio in lower-rate markets. Achieving −28% would take Tokushima’s ratio from 9.84% to 7.08% and Kyoto’s from 4.16% to 3.00%, an improvement 2.4 times larger in the former.
For skipping cleaning on multi-night stays, several models are already established in the market: chains that run it on an opt-in basis, practices of no cleaning for stays of 2+ nights with a regular clean every 3 nights for stays of 4+ nights, and designs that offer drink vouchers or loyalty points in exchange for skipping cleaning. As a design that simultaneously delivers discounts or perks for guests and labor-hour savings for operators, it makes the most sense in high-ratio markets.
Conclusion — There Is Ample Room for Price Pass-Through
The fiscal 2026 minimum wage revision raises housekeeping labor cost per room by ¥31–38 under the 25-minute scenario, or 0.2–0.3% of ADR. On a full-year basis from October 2026, that is ¥0.86–1.03 million a year for a 100-room property at 75% occupancy. The amount is not negligible, but it stays below the smallest increment of a per-night rate change.
More fundamental is the structure: the cost-to-ADR ratio for housekeeping spans 2.4x, from 4.16% to 9.84%, and the spread is driven not by the wage gap (1.18x) but by the rate gap (2.5x). The biggest lever for moving the ratio is rates, followed by cleaning time (process design). Among the variables operators can choose, the local wage level has the least effect.
The prefectures with high ratios are also the markets with the most room for rate growth. Labor-saving investment pays off more in these markets as well, and by combining ADR increases with process improvements, their ratios could move to the level of today’s bottom 20. Using the fiscal 2026 revision as a starting point to switch to managing labor hours per room and rates on the same table will support medium-term profit growth.
Note on the estimates in this article: Housekeeping labor cost per room is an estimate that uses the regional minimum wage as a floor benchmark, multiplied by a statutory welfare cost factor of 1.16 and an indirect time factor of 1.20. Prevailing advertised hourly wages often exceed this, and supplies, linens, laundry and supervisor wages are not included. Cleaning time, factors and ADR all vary greatly by property, so please substitute your own actual figures. Estimated settled ADR is the average of finalized months from September 2025 to August 2026 and is an estimate.
Related Reading
References and Sources
■ Minimum Wages
- Ministry of Health, Labour and Welfare, “Nationwide List of Regional Minimum Wages” (Japanese)
- Ministry of Health, Labour and Welfare, “Revised Regional Minimum Wages Recommended for All Prefectures” (September 3, 2026; Japanese)
- Ministry of Health, Labour and Welfare, “FY2026 Regional Minimum Wage Recommendations” (revised amounts, increases and effective dates by prefecture; Japanese)
- Hojyokin Portal, “Minimum Wages in All 47 Prefectures: National Average ¥1,177, Increases and Effective Dates” (Japanese)
- HR Management Co., Ltd., “Nationwide Minimum Wage Table (Phased in from October 2026)” (Japanese)
■ Statutory Welfare Costs
- Gyomu Keisan Portal, “How to Calculate Statutory Welfare Costs: Five Components of the Employer Share (FY2026 Edition)” (Japanese)
- Kaonavi HR Glossary, “What Are Statutory Welfare Costs? Burden and Calculation” (Japanese)
- Japan Health Insurance Association (Kyokai Kenpo), “FY2026 Insurance Premium Rates” (Tokyo 9.85%; Japanese)
- Ministry of Health, Labour and Welfare, “FY2026 Employment Insurance Premium Rates” (general businesses, employer share 0.85%; Japanese)
■ Room Cleaning Time and Outsourcing Prices
- Hotel Cleaning Company Comparison Navi, “How Long Does Hotel Cleaning Take? Average Times and Efficiency Tips” (Japanese)
- Dot Homes, “Hotel Cleaning Efficiency Manual: Workflow Design and Checklists” (Japanese)
- tokonatsu, “Market Rates for Outsourced Hotel Room Cleaning: Latest Unit Prices” (Japanese)
- IRIS OHYAMA, “Market Rates for Outsourced Hotel Cleaning: Benefits and Costs” (Japanese)
- Gokinjo Work, “Hotel Cleaning Outsourcing Rates and How to Reduce Costs” (Japanese)
■ Labor Saving and Skipped Multi-Night Cleaning Cases
- Hotel & Ryokan AI Lab, “Latest Unmanned and Labor-Saving Cases in the Hotel Industry 2026” (Japanese)
- Hotel Associa Toyohashi, “ECO Multi-Night Plan” (Japanese)
- Richmond Hotels, “Eco Style” (Japanese)
■ Data Sources
Minimum wages and effective dates are from the FY2026 regional minimum wage recommendations (47 prefectures) published by the Ministry of Health, Labour and Welfare on September 3, 2026. Estimated settled ADR is aggregated by MetroEngines Research as the average of finalized months from September 2025 to August 2026 (11 months for Hyogo only). Statutory welfare cost component rates are the FY2026 Kyokai Kenpo (Japan Health Insurance Association) rate for Tokyo and the FY2026 employment insurance rate published by MHLW. Cleaning time, outsourcing prices and labor-saving effects are based on the public information listed below.
■ Estimation Assumptions
Housekeeping labor cost per room = Regional minimum wage × (Cleaning time ÷ 60) × statutory welfare cost factor 1.16 × indirect time factor 1.20. Three cleaning-time scenarios (20, 25 and 30 minutes) are used; prefecture-level figures in the text are for the 25-minute scenario. Cost-to-ADR ratio = housekeeping labor cost above ÷ estimated settled ADR. Annual figures assume a full year from October 2026 onward for a 100-room property at 75% occupancy = 27,375 room nights per year. The two-way sensitivity table uses the national weighted average of ¥1,177. All factors are values set for this article, not measured values.
■ Limitations and Caveats
The minimum wage is a floor benchmark, not the actual hourly wage paid, and prevailing advertised hourly wages often exceed it. Only labor costs are included; supplies, linens, laundry, supervisor wages and recruiting costs are excluded. Estimated settled ADR is an estimate based on publicly available price information and differs from each property’s actual transaction prices and accounting figures. Effective dates may change depending on objections filed after the recommendations are announced. Outsourcing prices and labor-saving effects are cited from public cases and vary greatly with property conditions.
■ Market Data
- MetroEngines Research — Estimated settled ADR (47 prefectures, finalized months from September 2025 to August 2026, N = number of covered properties per prefecture)