

Autumn is the season when a Japanese inn’s dinner becomes its strongest product. Pacific saury (sanma), autumn salmon, salmon roe (ikura), scallops and Japanese flying squid take turns as the centrepiece of the menu, and the value of a “two-meal” (half-board) plan jumps even for the very same room. Yet the wholesale prices of these star species swing sharply from year to year. This article compares monthly seafood wholesale prices at the Tokyo Metropolitan Central Wholesale Market with measured meal premiums — room-only vs. breakfast-included vs. half-board, compared within the same hotel — and quantifies, in the form of a conversion table, “if wholesale prices rise by X%, how many points must the half-board premium rise to hold the food-cost ratio?”
To be clear about where this piece sits: our earlier analyses covered the pass-through gap between rising dinner food costs and ADR at half-board ryokan by property type and region, and the cost upside opened by the reversal in rice prices, Japan’s staple. This article differs from both. It uses a separate data source — wholesale prices by seafood species — and limits the scope to the autumn season (September–November), examining how the differences in price movements across species affect pricing decisions.
Metric Definitions Used in This Article
- ADR (Average Daily Rate): An estimated transacted rate (tax-exclusive equivalent) calculated by applying a property-type-specific adjustment factor to the lowest-plan price level each property publishes on OTAs and other channels (2 guests per room, per-room rate, tax-inclusive). Checked against property-level results disclosed by listed hotel REITs (91 properties, most recent 3 months), the median error is about 7%. These are estimates and differ from each property’s actual transacted prices and accounting figures. Area-level ADR is the median of the covered properties (the level of a typical property in the area).
- Meal premium: A paired comparison that aggregates price differences within a property, covering only cases where the same hotel simultaneously sells room-only, breakfast-included and half-board plans (2 guests per room, per-room rate, tax-inclusive). It is not an average comparison across different hotels. In this article, the “half-board premium” means half-board vs. room-only, and the “dinner add-on” means half-board vs. breakfast-included.
- Wholesale price: Monthly average wholesale price (¥/kg) at the Tokyo Metropolitan Central Wholesale Market (Toyosu).
- Data sources: MetroEngines Research (meal premiums and ADR) / Tokyo Metropolitan Central Wholesale Market, Market Statistics (wholesale prices)
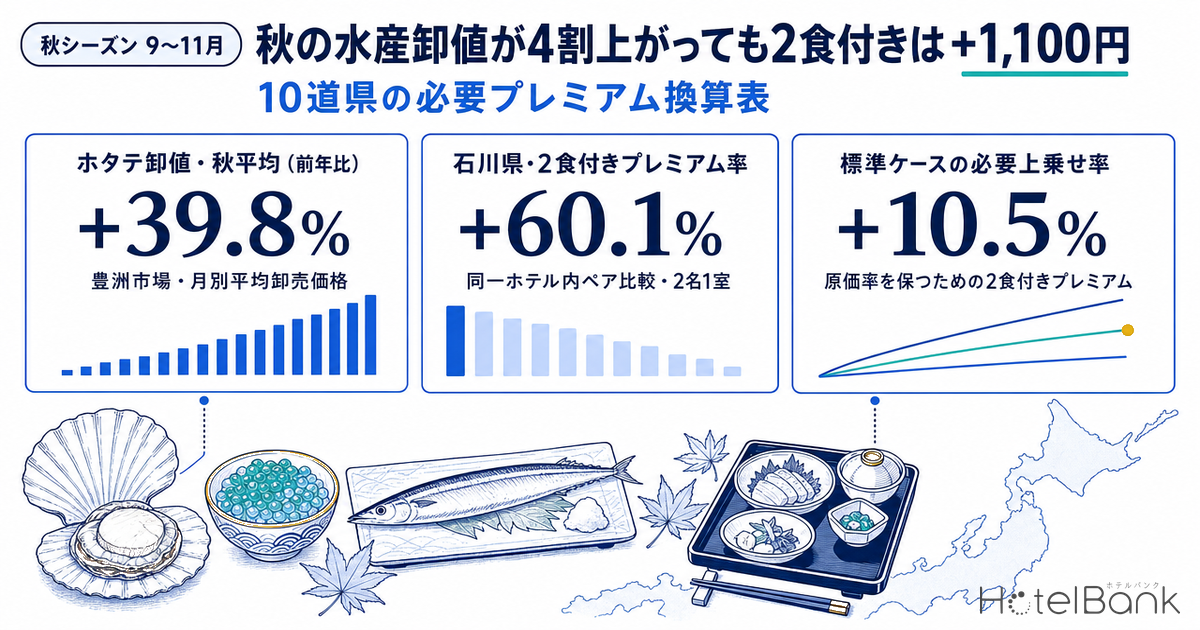
- — Autumn seafood wholesale prices diverge by species. Comparing autumn (September–November) averages from 2024 to 2025, scallops rose +39.8% and salmon roe +45.2%, while Pacific saury was nearly flat at +0.6%. Autumn ingredients are not “uniformly expensive.”
- — Even if the star species rises 40%, the half-board premium needs only ¥700–¥1,500 more (+3 to +6 pts). Because existing premiums already run ¥7,100–¥14,100, swings in ingredient cost are small relative to the denominator.
- — Half-board premiums across the 10 prefectures range from +28.9% to +60.1% (September 2026, paired comparison within the same hotel). Ishikawa (+60.1%), Fukui (+52.4%) and Shimane (+51.2%) lead, with the three Hokuriku prefectures and two San’in prefectures at the top.
- — Guest reviews react to species names, not to portion size. Mention rates for crab and seafood reach 17–46% at top properties, while mentions of portion size mostly sit at 2% to the low teens. Reworking the species mix protects the experience better than cutting portions.
- — Smaller runs of Pacific saury and autumn salmon in 2026 have already been announced (saury distribution 429,000 tonnes vs. 1,099,000 tonnes the previous year; autumn salmon −46.9% year on year). Costs for salmon and salmon-roe dishes are in a phase where they can move easily.
Autumn’s star species move completely differently, even within the same season
First, the wholesale price movements that underpin the analysis. Comparing the Tokyo Metropolitan Central Wholesale Market’s monthly average wholesale prices for the same months of 2024 and 2025 shows that the species that headline autumn menus diverge clearly in both the direction and the size of their price moves.
Scallops rose +60.1% year on year in September (¥710/kg → ¥1,137/kg), +27.9% in October and +31.3% in November, moving to a higher level throughout the autumn. Salmon roe showed the largest swing at +83.3% in October (¥4,134/kg → ¥7,579/kg), averaging +45.2% over September–November. Pacific saury, by contrast, was −19.7% in September, +16.7% in October and +4.8% in November, for a September–November average of +0.6% — essentially flat.
Source: Compiled by HotelBank Editorial Team from Tokyo Metropolitan Central Wholesale Market, “Market Statistics (Monthly Report)”
The key point here is that autumn seafood did not rise across the board. An inn whose menu leans heavily on salmon roe or scallops and one built around grilled saury or local fish can see food costs move by dozens of percentage points differently in the same autumn. If the pricing discussion starts from the generalisation that “autumn ingredients are expensive/cheap,” this difference disappears.
Supply-side outlook for autumn 2026 — published stock assessments
For autumn 2026, public agencies have already published several outlooks. For those setting prices, these are the inputs for deciding when to lock in the design of the autumn menu.
| Species | Published content | Publisher / date |
|---|---|---|
| Pacific saury | Arrivals in waters near Japan during the August–December 2026 season are expected to fall below the previous year. Estimated distribution is 429,000 tonnes (previous year: 1,099,000 tonnes), and the share of one-year-old fish, the main catch target, is 17.2% (previous year: 59.6%). Fish are expected to be smaller than last year | Fisheries Agency (published July 28, 2026) |
| Autumn salmon (Hokkaido) | 2026 return forecast of 3,644,700 fish, −46.9% vs. the previous year’s actual | Hokkaido Research Organization (2026) |
| Japanese flying squid | In the joint fishing-ground survey from late May to mid-July 2026, CPUE across the entire survey area was 0.20 squid per jigging machine per hour — below the previous year’s 0.30 and the lowest since the survey began | Japan Fisheries Research and Education Agency (published July 31, 2026) |
| Scallops | Growth and output are prone to swings due to changes in the marine environment, and domestic demand remains strong as export destinations diversify | Press reports and market statistics |
Source: Compiled by HotelBank Editorial Team from published materials of the Fisheries Agency, the Japan Fisheries Research and Education Agency and the Hokkaido Research Organization
Autumn salmon and Pacific saury are both expected to arrive in smaller numbers than last year, and because salmon roe is the eggs of autumn salmon, the two are linked. Scallops, on the other hand, swing more with export demand and growing conditions than with the stock itself. In other words, in autumn 2026 costs are likely to move separately for “salmon and salmon roe,” “scallops” and “other local fish.” Managing the whole menu under a single cost figure makes it impossible to reflect this difference in pricing.
Starting point — measured meal premiums in 10 seafood-led prefectures (September 2026)
So how much are properties currently able to charge for meals? MetroEngines Research’s meal premium data is a rolling window of the latest five months (May–September 2026), so autumn results have not yet been observed. We therefore present the measured values as of September 2026 as the “starting point just before autumn.” All figures below are paired comparisons that aggregate only cases where the same hotel sells multiple meal types at the same time.
| Prefecture | Half-board premium rate |
Premium amount |
Dinner add-on (half-board vs breakfast) |
Breakfast premium rate |
Properties (half-board pairs) |
|---|---|---|---|---|---|
| Ishikawa | +60.1% | ¥14,100 | +41.2% | +12.3% | 20 |
| Fukui | +52.4% | ¥9,900 | +28.9% | +13.6% | 15 |
| Shimane | +51.2% | ¥9,000 | +41.2% | +8.8% | 18 |
| Toyama | +49.6% | ¥10,500 | +31.7% | +11.9% | 17 |
| Tottori | +42.2% | ¥8,900 | +35.6% | +13.7% | 20 |
| Miyagi | +42.0% | ¥7,900 | +29.1% | +12.5% | 41 |
| Iwate | +37.1% | ¥7,200 | +29.3% | +9.3% | 33 |
| Hokkaido | +35.1% | ¥10,400 | +26.6% | +9.2% | 162 |
| Aomori | +30.0% | ¥7,100 | +23.9% | +7.5% | 31 |
| Niigata | +28.9% | ¥7,400 | +30.8% | +1.7% | 50 |
September 2026, all property types, 2 guests per room. Paired comparison within the same hotel. Source: Compiled by HotelBank Editorial Team from MetroEngines Research
Source: Compiled by HotelBank Editorial Team from MetroEngines Research
The three Hokuriku prefectures (Ishikawa, Fukui, Toyama) and the two San’in prefectures (Shimane, Tottori) rank at the top. Ishikawa’s half-board premium is +60.1% (¥14,100; N=20 properties), meaning ¥37,600 for half-board against ¥23,500 room-only. On the dinner add-on alone (half-board vs. breakfast-included), Ishikawa and Shimane are tied at +41.2%. In these areas, a structure of “selling dinner itself as a product” is already visible in prices.
Hokkaido, meanwhile, has a half-board premium of +35.1%, but with 162 properties it has by far the deepest sample, and in yen terms its ¥10,400 approaches the top group. Because the area-wide level can be observed so reliably, it is a convenient benchmark for the estimates that follow. Niigata has a high dinner add-on of +30.8% but a breakfast premium of only +1.7%, so its value is weighted toward dinner.
Conversion table — how many points the premium must rise to hold the food-cost ratio when wholesale prices rise
This is the core of the article. The logic is simple: if the food-cost ratio (= meal food cost ÷ meal premium) is held constant, the premium only needs to move by the same multiple as ingredient costs. The required increase can therefore be calculated without assuming the cost ratio itself.
■ Estimation assumptions
Required premium increase rate = s × f × g
s: dinner’s share of the ingredient cost for both meals (assumed at 75% in this article)
f: the target species’ share of dinner ingredient cost (three cases: 20% / 35% / 50%)
g: the rise in the target species’ wholesale price
Required increase (¥) = current half-board premium amount × s × f × g
Required increase (pts) = current half-board premium rate × s × f × g
| Target species’ share of dinner food cost |
Wholesale +10% | Wholesale +20% | Wholesale +30% | Wholesale +40% |
|---|---|---|---|---|
| 20% (menu using a broad range of local fish) | +1.5% | +3.0% | +4.5% | +6.0% |
| 35% (standard kaiseki with one star species) | +2.6% | +5.3% | +7.9% | +10.5% |
| 50% (single-species menus such as crab kaiseki or all-seafood courses) | +3.8% | +7.5% | +11.3% | +15.0% |
Estimates assuming a 75% dinner share. Source: HotelBank Editorial Team estimates
Source: HotelBank Editorial Team estimates
Now apply this to the measured premiums. The case that treats a scallop-level rise (autumn average +39.8%) as “+40%” with a standard species dependence of 35% is likely the most realistic scenario for many properties.
| Prefecture | Current half-board premium amount |
Wholesale +30%, 35% dependence required increase |
Wholesale +40%, 35% dependence required increase |
Effect on premium rate |
Wholesale +40%, 50% dependence required increase |
|---|---|---|---|---|---|
| Ishikawa | ¥14,100 | ¥1,100 | ¥1,500 | 60.1%→66.4% | ¥2,100 |
| Toyama | ¥10,500 | ¥800 | ¥1,100 | 49.6%→54.8% | ¥1,600 |
| Hokkaido | ¥10,400 | ¥800 | ¥1,100 | 35.1%→38.8% | ¥1,600 |
| Fukui | ¥9,900 | ¥800 | ¥1,000 | 52.4%→57.9% | ¥1,500 |
| Shimane | ¥9,000 | ¥700 | ¥900 | 51.2%→56.6% | ¥1,300 |
| Tottori | ¥8,900 | ¥700 | ¥900 | 42.2%→46.6% | ¥1,300 |
| Miyagi | ¥7,900 | ¥600 | ¥800 | 42.0%→46.4% | ¥1,200 |
| Niigata | ¥7,400 | ¥600 | ¥800 | 28.9%→31.9% | ¥1,100 |
| Iwate | ¥7,200 | ¥600 | ¥800 | 37.1%→41.0% | ¥1,100 |
| Aomori | ¥7,100 | ¥600 | ¥700 | 30.0%→33.2% | ¥1,100 |
The estimation formula above applied to measured premium amounts for September 2026. Source: HotelBank Editorial Team estimates based on MetroEngines Research
The conclusion is clear. Even if the wholesale price of the star species rises 40%, the half-board premium needs to rise by only ¥700–¥1,500 — +3 to +6 percentage points — to hold the food-cost ratio. With half-board premiums already at ¥7,000–¥14,000, swings in ingredient cost are small enough relative to the denominator. This means that “even when buying expensive autumn ingredients, the room to pass them through to rates lies within a realistic range.”
Put differently, autumn ingredients are an exceptionally easy reason to explain a price increase. An increase of around ¥1,000 equals about 5% of the room rate for an inn charging around ¥20,000 room-only, and if it is presented alongside a concrete reason such as “a menu featuring this year’s salmon roe/scallops,” it falls within a range guests can absorb while still finding it fair.
Three levers side by side — change the species, change the portions, raise the premium
There is more than one way to absorb rising costs. Going back to the conversion formula, the required increase rate is s × f × g, so the variables that can be moved are f (the species mix) and the premium itself. Adjusting portion sizes is effectively an operation that lowers f.
| Lever | What it changes in the formula | Effect in Hokkaido (premium ¥10,400) | How acceptable the price feels |
|---|---|---|---|
| 1. Rework the species mix | f from 35% → 20% | Required increase ¥1,100 → ¥600 (¥500 less) | The menu keeps a centrepiece. Swapping in a different local or seasonal species makes it easy to keep the appeal |
| 2. Adjust portions | f effectively × 0.85 | Required increase ¥1,100 → ¥900 (¥200 less) | At properties that sell on generous portions this touches the core of the experience, so its applicability is limited |
| 3. Raise the premium | Premium +10.5% | Half-board premium +¥1,100 (35.1% → 38.8%) | The menu stays as is. Easy to present together with an explanation that puts the species name front and centre |
Source: HotelBank Editorial Team estimates based on MetroEngines Research
On paper, lever 1 is the most efficient and lever 2 has only a small effect. So what do guests actually notice about the menu? Comparing mention rates for dinner-related topics in data from NLP analysis of guest reviews across 189 tags provides the evidence for that decision.
| Area / topic | Property | Mention rate | Mentions | Reviews analysed |
|---|---|---|---|---|
| Fukui — crab dishes | Ryori Ryokan Heisei (料理旅館 平成) | 46.3% | 125 | 270 |
| Mikuni Ocean Resort & Hotel (三国オーシャンリゾート&ホテル) | 23.4% | 108 | 461 | |
| Umi no Hotel Hirose (海のホテルひろせ) | 17.3% | 128 | 742 | |
| Tottori — crab dishes | Kaike Grand Hotel Tensui (皆生グランドホテル 天水) | 17.7% | 182 | 1,030 |
| Misasakan (三朝館) | 13.1% | 104 | 797 | |
| Iwate — seafood dishes | Ofunato Onsen (大船渡温泉) | 29.8% | 270 | 907 |
| Hotel Rogaso (ホテル羅賀荘) | 22.1% | 63 | 285 | |
| Tottori — portion size | Hamamura Onsen Uotoya (浜村温泉 魚と屋) | 14.7% | 39 | 265 |
| Kasuitei (華水亭) | 4.3% | 43 | 1,010 | |
| Fukui — portion size | Ryori Ryokan Heisei (料理旅館 平成) | 10.4% | 28 | 270 |
| Awara Onsen Mimatsu (あわら温泉美松) | 2.4% | 30 | 1,273 |
NLP analysis of guest reviews over the last 24 months. Mention rate = share of each property’s analysed reviews that mention the tag. Source: HotelBank Editorial Team research (NLP analysis)
The takeaway is clear. What guests leave in their reviews is “what was served,” not the quantity itself. Mention rates for species names such as crab and seafood reach 17–46% at top properties, whereas mentions of portion size stay at 2% to the low teens at most properties. In other words, guests’ memories of the menu are tied to the specific names of the fish.
There are exceptions, however. Hamamura Onsen Uotoya has a high portion-size mention rate of 14.7% (N=265 reviews), and together with a seafood mention rate of 29.4%, the image of “an inn that serves generous helpings of local fish” is firmly established in its reviews. For properties like this, portion size is part of the brand, not a variable to be moved. Conversely, at properties where quantity is not talked about, reworking the species mix protects the core of the experience better than adjusting portions.
Taking the three levers together, applying lever 1 (reworking the species mix) first and absorbing the rest with lever 3 (the premium) is the combination that best preserves how acceptable the price feels. In the Hokkaido example, shifting f from 35% to 20% and then adding ¥600 keeps the food-cost ratio intact. ¥600 is 1.5% of the ¥40,200 half-board total — a gap that can easily be filled by explaining the menu.
Autumn ADR levels — where is the base for the increase?
Finally, we check the autumn ADR levels that form the base for any increase. The figures below are estimated transacted ADRs for October and November 2026, all estimated from prices listed on OTAs and other channels at the time of the survey (forward snapshot).
October and November 2026, all property types. N=134–892 properties (varies by prefecture and month). Source: Compiled by HotelBank Editorial Team from MetroEngines Research
Ishikawa stands at ¥14,600 in October (N=238 properties) and ¥15,500 in November (N=230 properties); its November level is the highest of the 10 prefectures (in October, Aomori’s ¥14,900 is the highest). Shimane also rises toward November, from ¥13,600 in October to ¥14,500 in November. That November levels exceed October in the two San’in prefectures and in Ishikawa and Fukui can be read as prices already factoring in the start of the winter delicacy season. Room-rate movements on the Sea of Japan coast around the opening of the snow crab season are analysed port by port in Crab Season Opens Nov 6: Echizen Room Rates Jump 3.2x in One Month.
By contrast, Hokkaido falls from ¥12,400 in October to ¥11,200 in November, and Iwate from ¥10,600 to ¥9,900. These “areas where rates fall in November” are precisely where room remains to design premiums around autumn ingredients. Even if the room rate itself stays flat, adding ¥800–¥1,100 to the half-board premium secures revenue per room.
⚠ Note on ADR for future dates: The October and November 2026 ADRs in this article are estimates based on selling prices published on OTAs and other channels at the time of the survey, and they will change as check-in dates approach. Plan additions and price adjustments will move actual levels. In addition, 2025 actuals (based on settled months) and 2026 estimates (based on listed prices) are calculated on different bases, so this article does not present growth rates that directly compare the two.
Summary — autumn ingredients are a strong basis for pricing
To recap what this article established: first, autumn seafood wholesale prices diverge widely by species. From 2024 to 2025, scallops rose +39.8% and salmon roe +45.2% on an autumn-average basis, while Pacific saury was nearly flat at +0.6%. Second, for autumn 2026, public agencies have published outlooks that Pacific saury and autumn salmon arrivals will fall below the previous year, so costs for salmon and salmon-roe dishes are in a phase where they can move easily.
Third, even so, when the star species’ wholesale price rises 40%, the half-board premium needs to rise by only ¥700–¥1,500 (+3 to +6 pts) to hold the food-cost ratio. With premiums of ¥7,000–¥14,000 already established, swings in ingredient cost are small relative to the denominator. Fourth, guest reviews respond strongly to species names (17–46% mention rates at top properties), while mentions of quantity are relatively low. It is therefore easier to protect both the experience and the rate by reworking the species mix rather than cutting portions, and absorbing the rest through the premium.
Autumn ingredients are the easiest material there is to justify a price increase. The specificity of “this year we are serving this fish, prepared this way” makes the same ¥1,000 land completely differently. What the conversion table shows is that this ¥1,000 is well within reach.
For properties: plan-name hints that work for this theme
Common appeal elements in published autumn plan names (N=1,088) —
Kaiseki course 26%Seafood 16%Wagyu / branded beef 15%Half-board 15%Onsen / open-air bath 12%Crab 11%
Examples of actual names (anonymised, translated):
- Scenic sea-view observation bath and the bounty of Sanriku! Sanriku seafood ceramic-plate grill standard set meal (dinner & breakfast)
- [Couples] Crab kaiseki in a room with an open-air bath overlooking the sea | 11:00 check-out & private open-air bath | anniversaries
*Trends based on an aggregation of published plan names; they do not show that naming causes sales.
References and Sources
■ Data sources
Wholesale prices are monthly average wholesale prices at the Tokyo Metropolitan Central Wholesale Market (Toyosu) (¥/kg; same-month comparison of 2024 and 2025). Meal premiums are paired comparisons covering only cases where the same hotel simultaneously sells room-only, breakfast-included and half-board plans (September 2026, 2 guests per room, per-room rate, tax-inclusive, all property types, N=15–162 properties). Autumn ADR is the estimated transacted rate for October and November 2026 (forward snapshot based on listed prices at the time of the survey, N=134–892 properties). Reviews are guest posts from the last 24 months analysed with NLP on a 189-tag framework, calculating the share of each property’s analysed reviews that mention the tag.
■ Estimation assumptions
Required premium increase rate = s × f × g. s = dinner’s share of the ingredient cost for both meals (assumed at 75%); f = the target species’ share of dinner ingredient cost (three cases: 20% / 35% / 50%); g = the rise in the target species’ wholesale price (four cases: +10% to +40%). Because the food-cost ratio (meal food cost ÷ meal premium) is assumed to be held constant, the required increase rate is determined without assuming the absolute level of the cost ratio. Yen amounts apply the same rate to each prefecture’s measured premium amount for September 2026, rounded to the nearest ¥100.
■ Limitations and caveats
(1) s and f are assumptions that depend on menu composition, and actual cost structures differ by property. The conversion table should be read as showing a range of sensitivity rather than levels themselves. (2) Wholesale prices reflect the Tokyo Metropolitan Central Wholesale Market; properties that mainly buy direct from producing areas or through negotiated transactions may see procurement prices move differently. (3) Meal premiums are paired comparisons based on listed prices and differ from actual transacted prices, costs and margins. (4) ADRs for October and November 2026 are estimates based on listed levels for future dates and will change as check-in dates approach. (5) Resource and catch outlooks are as of their publication dates and do not guarantee that actual landings or wholesale prices will move accordingly. (6) Review mention rates are based on posted text, so a low mention rate does not mean the experience is absent.
■ Wholesale market statistics
- Tokyo Metropolitan Central Wholesale Market, “Market Statistics (Monthly and Annual Reports)” (Japanese)
- GD Freak!, “Toyosu Market Seafood Price Chart Portal” (Japanese; primary source: Tokyo Metropolitan Central Wholesale Market daily reports and Market Statistics (Monthly Report))
■ Public outlooks on fishery resources and catch conditions
- Japan Fisheries Research and Education Agency, “Pacific Saury Information” (Japanese) (includes the arrival forecast published by the Fisheries Agency on July 28, 2026)
- Japan Fisheries Research and Education Agency, “FY2026 Long-term Catch Forecast for Japanese Flying Squid in the Sea of Japan” (Japanese; published July 31, 2026)
- Hokkaido Research Organization, “Resource Status of Hokkaido Autumn Salmon (Return Forecast)” (Japanese)
- Hokkaido Government, Department of Fisheries and Forestry, “Hokkaido Autumn Salmon Catch Bulletin (Ten-day Report)” (Japanese)
■ Lodging market data
- MetroEngines Research — meal premiums from paired comparisons within the same hotel (September 2026, 2 guests per room); estimated transacted ADR (October and November 2026)
- HotelBank Editorial Team research (NLP analysis) — mention rates for dinner-related tags in guest reviews (last 24 months)