

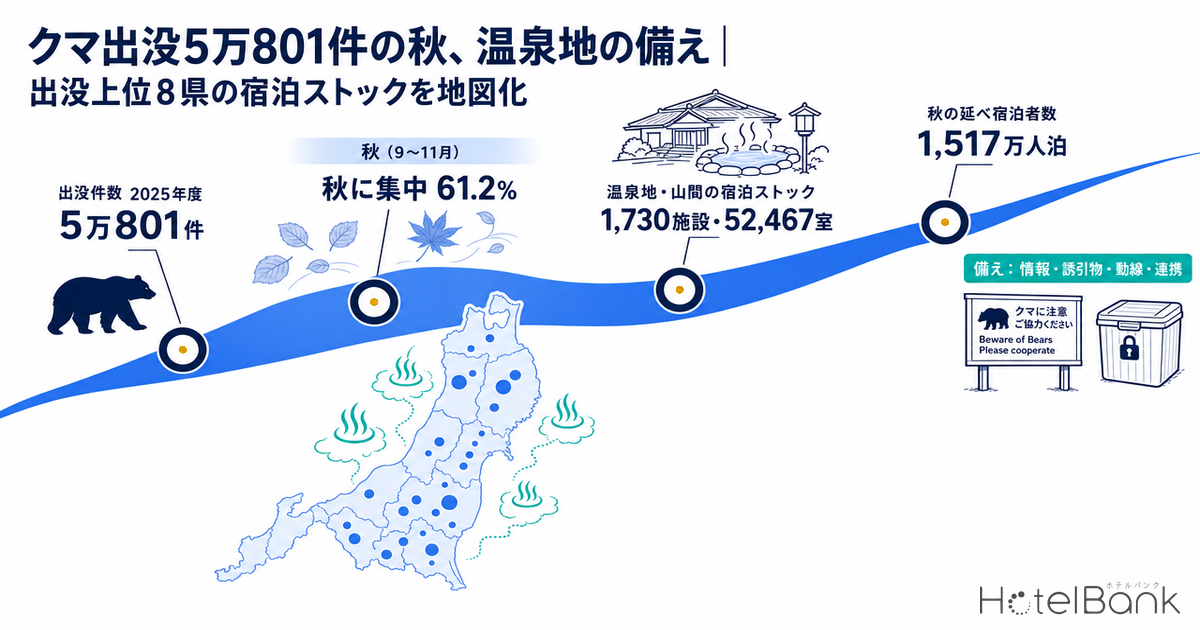
Bear sightings in Japan peak between September and November. According to Ministry of the Environment tallies, nationwide sighting reports for fiscal 2025 reached 50,801 — the highest in five years — with 31,102 of them, or 61.2% of the annual total, concentrated in the three months from September to November. Injuries reached 216 incidents involving 238 people, including 13 deaths. Because mountain onsen districts overlap geographically with sighting areas, autumn — when foliage, hiking and hot-spring demand converge — puts a hotel’s readiness to the test. This article first maps the distribution of sightings and injuries using Ministry of the Environment statistics, then uses our own data to measure how much lodging stock sits in the onsen and mountain municipalities of the eight prefectures with the most sightings, and finally sets out, in practical terms, the preparations inns and local governments can make this autumn.
Metric Definitions Used in This Article
- ADR (Average Daily Rate) = an estimated settled rate (tax-exclusive equivalent) calculated by applying a segment-specific adjustment coefficient to the lowest published plan level each property lists on major booking sites (double occupancy, per-room rate, tax-included). Cross-checked against property-level results disclosed by listed hotel REITs (91 properties, most recent three months), the median error is approximately 7%. These are estimates and differ from each property’s actual transacted rates and accounting figures. Municipality-level ADR is the median of the properties covered (the level of a typical property in that area).
- Sighting reports = preliminary figures the Ministry of the Environment collects from prefectures for bear species (brown bears and Asiatic black bears). Tallying methods (reports to police, information from municipalities, and so on) differ by prefecture, and multiple sightings of the same individual may be included. Hokkaido does not publish sighting counts and is therefore excluded from the national total. The eight prefectures of Kyushu and Okinawa have no bear population and are outside the survey.
- Guest nights = finalized annual figures from the Japan Tourism Agency’s Overnight Travel Statistics Survey (unit: person-nights).
- Data sources = Ministry of the Environment, Japan Tourism Agency, Tohoku Regional Forest Office, MetroEngines Research
- — 50,801 reports: nationwide bear sightings in fiscal 2025 (Ministry of the Environment preliminary figures). That is 2.5 times the prior year, and 61.2% of the annual total fell in September–November.
- — 68.1%: the share of fiscal 2025’s 216 injury incidents that occurred in September–November. The proportion occurring in inhabited areas — urban districts and the surroundings of homes — rose.
- — 1,730 properties, 52,467 rooms: the lodging stock in 41 onsen and mountain municipalities across the eight prefectures that account for 79.4% of national sightings (N=41 municipalities).
- — 15.17 million guest nights: September–November 2025 guest nights across the eight prefectures. The sighting peak coincides with the three months in which mountain inns earn the most all year.
- — Four no-cost starting points: posting sighting information, managing attractants, reviewing outdoor circulation routes, and setting up contact procedures with local government. Beech flowering in Tohoku recovered in 2026, but fruiting will not be confirmed until autumn.
50,801 Sightings in Fiscal 2025, With 61.2% Concentrated in September–November
According to the bear sighting data published by the Ministry of the Environment (preliminary figures, updated September 9, 2026), there were 50,801 nationwide sightings in fiscal 2025. That is 2.5 times the 20,513 recorded in fiscal 2024, and stands out even across the past five years. The seasonal distribution is the striking part: October alone accounted for 15,998 reports and November for 10,338, so those two autumn months made up 51.8% of the total. Adding September brings September–November to 31,102 reports, or 61.2% of the year.
This autumn concentration cannot be explained simply by “more people going into the mountains in autumn.” In an analysis presented at the interministerial liaison meeting of May 1, 2026, the Ministry of the Environment noted that the autumn increases in sightings in Tohoku in fiscal 2023 and fiscal 2025 may have been influenced by poor crops of beech-family nuts. In years when the nuts that bears feed on fail, bears widen their range in search of food, and the number of appearances in inhabited areas jumps as a result. The chart below shows how wide that year-to-year swing can be.
Source: Ministry of the Environment, “Bear Sighting Reports (preliminary figures)”; compiled by the HotelBank Editorial Team (updated September 9, 2026)
The fiscal 2026 picture is also worth noting. Sightings from April to July totaled 17,362 nationwide, 36.5% above the same period a year earlier (12,716) and the highest for that period in five years. “Staying elevated” is close to the felt reality. That said, the level for the full fiscal year will depend heavily on how the coming autumn unfolds.
68.1% of 216 Injury Incidents Fall in Autumn, and They Happen in Inhabited Areas
Injuries skew even more heavily toward autumn. Fiscal 2025 saw 216 incidents and 238 victims (including 13 deaths) for the year, of which September–November accounted for 147 incidents, 161 victims and 8 deaths. On an incident basis, 68.1% fell in those three autumn months. By month, October stands out with 78 incidents, 89 victims and 7 deaths.
Source: Ministry of the Environment, “Bear-Related Injury Incidents (preliminary figures)”; compiled by the HotelBank Editorial Team
What matters for hotel operations is the breakdown of where incidents occur. The Ministry of the Environment’s analysis found that from July of fiscal 2025 onward, the share of injuries occurring in “inhabited areas” — urban districts, the surroundings of homes, business premises, parks, farmland and roads — ran higher than in fiscal 2023 and fiscal 2024. In addition, in both fiscal 2023 and fiscal 2025, the years with heavy autumn sightings, the share occurring in inhabited areas rose from September onward. In other words, the places to prepare are not only trailheads and deep forest, but the route from the parking lot to the entrance, the back door staff use morning and evening, and the refuse storage area — “the property grounds and their immediate surroundings.”
By prefecture, both sightings and injuries center on Tohoku. In fiscal 2025, Akita led with 13,592 sightings, followed by Iwate with 9,739, Miyagi with 3,559, Niigata with 3,528, Aomori with 3,334 and Yamagata with 3,124. Injury incidents follow a similar order — Akita 59, Iwate 39, Fukushima 21 — so the top ranks overlap.
| Prefecture | Sightings FY2025 | Same, FY2024 | Of which Sep–Nov FY2025 | Injury incidents FY2025 | Victims (of which deaths) |
|---|---|---|---|---|---|
| Akita | 13,592 | 1,340 | 10,069 | 59 | 67 (4) |
| Iwate | 9,739 | 2,883 | 5,760 | 39 | 40 (5) |
| Miyagi | 3,559 | 800 | 2,449 | 5 | 5 (1) |
| Niigata | 3,528 | 925 | 2,454 | 16 | 17 (0) |
| Aomori | 3,334 | 725 | 1,629 | 10 | 10 (0) |
| Yamagata | 3,124 | 357 | 1,857 | 12 | 12 (0) |
| Fukushima | 2,047 | 618 | 1,234 | 21 | 24 (0) |
| Gunma | 1,398 | 678 | 925 | 10 | 12 (0) |
| 8-prefecture total | 40,321 | 8,326 | 26,377 | 172 | 187 (10) |
Source: Ministry of the Environment, “Bear Sighting Reports (preliminary figures)” and “Bear-Related Injury Incidents (preliminary figures)”; compiled by the HotelBank Editorial Team. Fiscal years run April through the following March.
These eight prefectures alone account for 79.4% (40,321) of all fiscal 2025 sightings nationwide. In the analysis that follows, we treat them as the “top sighting prefectures.”
Beech Flowering in Tohoku Recovered in 2026 — But Fruiting Is Confirmed Only in Autumn
One useful guide to the autumn outlook is the beech flowering and fruiting survey the Tohoku Regional Forest Office conducts at 145 fixed points across its jurisdiction. A crop index of 3.5 or above is judged a “good crop,” and below 1 a “severe crop failure.” In 2025, the flowering-stage indices were 0.5 in Aomori, 0.6 in Iwate, 0.3 in Miyagi, 0.4 in Akita and 0.4 in Yamagata — a severe failure forecast in all five prefectures (the autumn fruiting survey confirmed severe failure in all five) — and sightings duly surged that autumn.
By contrast, the 2026 flowering readings were 3.4 in Aomori, 3.5 in Iwate, 5.0 in Miyagi, 3.6 in Akita and 4.0 in Yamagata, putting Miyagi, Akita, Iwate and Yamagata in good-crop territory and returning Aomori to an average-crop range. Flowering is an early-summer forecast, and actual fruiting is confirmed by the autumn survey. So while there is no basis for assuming “2025’s mass sightings will simply repeat,” it is equally early to read the data as “no longer a concern.” The stance available right now is to enter autumn without lowering the level of preparation, then adjust operations as confirmed fruiting results and each prefecture’s sighting data come in.
Source: Tohoku Regional Forest Office, “Beech Flowering and Fruiting Survey”; compiled by the HotelBank Editorial Team. All years show the crop index at the flowering stage (2026 fruiting will be confirmed in autumn).
1,730 Properties and 52,467 Rooms Across 41 Onsen and Mountain Municipalities
So how much lodging stock sits in the areas with the most sightings? From the eight top sighting prefectures we extracted 41 municipalities that include onsen districts, highland resorts and mountain areas, and tallied the operating properties tracked by MetroEngines Research. The result: 1,730 properties and 52,467 rooms. That averages 42 properties and 1,280 rooms per municipality, and 21 of the municipalities have 1,000 rooms or more.
The map below plots the lodging stock of those 41 municipalities (circle size = number of rooms), color-coded by each prefecture’s fiscal 2025 sighting level. Clicking a circle shows the property count, room count and last autumn’s estimated settled ADR.
Source: MetroEngines Research and Ministry of the Environment, “Bear Sighting Reports (preliminary figures)”; compiled by the HotelBank Editorial Team (N=41 municipalities, 1,730 properties)
Looking at individual municipalities, the largest room stocks sit in onsen and highland resort clusters: Yuzawa Town with 3,899 rooms (108 properties), Myoko City with 2,610 rooms (143 properties), Kusatsu Town with 2,440 rooms (110 properties), Minamiuonuma City with 2,294 rooms (91 properties) and Minakami Town with 2,183 rooms (101 properties). Yamagata City (4,313 rooms), Aomori City (4,064 rooms) and Fukushima City (3,745 rooms) are citywide figures that include urban hotels, but each also contains mountain onsen districts within its boundaries — Zao Onsen, Sukayu and Takayu Onsen respectively.
For last autumn (September–November 2025), the estimated settled ADR was ¥11,700 at the median across the 36 municipalities covered (those with five or more properties). The upper end comprises areas dominated by ryokan offering one night with two meals: Obanazawa City at ¥34,400 (N=5), Kosaka Town at ¥21,200 (N=5), Zao Town at ¥18,300 (N=14), Nakanojo Town at ¥18,300 (N=33), Kusatsu Town at ¥17,900 (N=79) and Minakami Town at ¥17,400 (N=47). As our analysis of the municipal rate tiers within Gunma Prefecture showed, onsen districts such as Minakami and Kusatsu sit in a clearly higher range than the prefectural capital. Autumn is also one of the easiest times of year to hold rate, so the payoff from strengthening guest-reception readiness scales with rate multiplied by room count.
The table below lists the main municipalities in descending order of room count.
| Prefecture | Municipality | Properties | Rooms | Estimated settled ADR Sep–Nov 2025 | Properties covered by ADR |
|---|---|---|---|---|---|
| Yamagata | Yamagata City | 90 | 4,313 | ¥11,000 | 58 |
| Aomori | Aomori City | 45 | 4,064 | ¥11,000 | 38 |
| Niigata | Yuzawa Town | 108 | 3,899 | ¥12,700 | 36 |
| Fukushima | Fukushima City | 75 | 3,745 | ¥8,800 | 68 |
| Niigata | Myoko City | 143 | 2,610 | ¥8,900 | 41 |
| Miyagi | Osaki City | 54 | 2,542 | ¥10,400 | 37 |
| Gunma | Kusatsu Town | 110 | 2,440 | ¥17,900 | 79 |
| Yamagata | Tsuruoka City | 61 | 2,407 | ¥9,400 | 46 |
| Niigata | Minamiuonuma City | 91 | 2,294 | ¥11,000 | 24 |
| Gunma | Minakami Town | 101 | 2,183 | ¥17,400 | 47 |
| Aomori | Hirosaki City | 31 | 2,141 | ¥6,900 | 23 |
| Iwate | Hachimantai City | 62 | 1,654 | ¥12,100 | 13 |
| Gunma | Tsumagoi Village | 66 | 1,627 | ¥12,200 | 23 |
| Iwate | Hanamaki City | 34 | 1,499 | ¥13,900 | 31 |
| Fukushima | Inawashiro Town | 52 | 1,473 | ¥10,500 | 20 |
| Yamagata | Yonezawa City | 42 | 1,382 | ¥9,600 | 32 |
Source: MetroEngines Research; compiled by the HotelBank Editorial Team. Top 16 municipalities by room count (10 or more properties covered by ADR). ADR is the average of monthly medians for September–November, rounded to the nearest ¥100.
15.17 Million Guest Nights in September–November — Over a Quarter of Annual Demand
The sighting peak and the demand peak land on exactly the same months. According to the finalized 2025 figures from the Japan Tourism Agency’s Overnight Travel Statistics Survey, the eight top sighting prefectures recorded a combined 15.17 million guest nights in September–November. Nationwide the figure was 171.00 million guest nights, or 25.9% of the annual total of 661.10 million.
Many of these prefectures run above that national share. Akita at 28.6%, Aomori at 28.4%, Miyagi at 27.2%, Fukushima at 27.1% and Yamagata at 26.6% show that in Tohoku — where foliage, mushroom season and onsen demand overlap — between a quarter and just under 30% of annual demand falls in September–November. Gunma at 25.4%, Iwate at 25.4% and Niigata at 24.9% sit around the national level. Put simply, the three months when sightings rise the most are also the three months when mountain inns earn the most.
Source: Japan Tourism Agency, “Overnight Travel Statistics Survey” (finalized 2025 annual figures); compiled by the HotelBank Editorial Team
Note that year-to-year swings in lodging demand are determined by many factors — weather, events, transport, exchange rates and inbound trends among them. Nothing in the data presented here supports reading a causal relationship between sighting counts and guest nights. What this section is meant to show is simply the scale of demand that moves in autumn. On how to read the survey figures themselves, note that preliminary values in the Overnight Travel Statistics Survey are revised by up to 3.4% when finalized.
What Inns Can Do — Information, Attractants, Circulation Routes and Coordination
From here the discussion turns practical. National policy has also moved significantly since 2025. Under the amended Wildlife Protection and Management Act (Act No. 28 of 2025), which took effect on September 1, 2025, an “emergency firearm use” framework was established allowing a mayor to authorize the discharge of firearms, under conditions that ensure safety, when a bear or similar animal appears in an area of daily human activity. The Ministry of the Environment has published emergency firearm use guidelines for municipalities and revised them in April 2026. On November 14, 2025, a ministerial meeting also adopted a “Bear Damage Countermeasures Package,” advancing measures in three phases: emergency response, short term and medium term. The package explicitly includes coordination between the Ministry of the Environment and the Japan Tourism Agency to distribute sighting information and safety alerts in multiple languages to hikers and others, including inbound visitors.
The preparations available on the property side fall into four areas. Each can be started without new capital investment.
| Area | Specific measures for autumn |
|---|---|
| 1. Posting information | Check prefectural and municipal sighting maps and disaster-alert emails daily, and post them at the front desk, in elevator lobbies and in guest rooms. Avoid Japanese-only notices; include English, Chinese and Korean (the Ministry of the Environment and the Japan Tourism Agency are also advancing multilingual communication). Showing concretely “where a bear was sighted yesterday” changes how guests behave. |
| 2. Managing attractants | Stop storing food waste and kitchen refuse outdoors; switch to sealed containers or indoor storage. Increase collection frequency for the autumn months only. Consider harvesting or removing unmanaged fruit trees on the grounds (chestnut, persimmon, apple). Leftovers at outdoor barbecue areas and terraces, pet food and compost should be managed the same way. |
| 3. Circulation routes and outdoor operations | Identify outdoor routes — parking lot to entrance, covered walkways to detached buildings and open-air baths, shuttle pick-up and drop-off points, the staff back door — and add lighting and clear sightlines (cutting back undergrowth). Because injuries are more likely at dawn and dusk, review shuttle departure times and early-morning walking tours. Keep time-based operation (closing at night) as an option for outdoor facilities. The national Bear Damage Countermeasures Package likewise includes strengthened safety measures such as electric fences and food lockers at campgrounds in national parks. |
| 4. Coordination and procedures | Put the contact points for a sighting on or near the grounds (the municipal department in charge, police, the local hunting association) and what to report (time, location, number of animals, direction of travel) on a single-page procedure sheet and keep it at the front desk. Because the decision on emergency firearm use rests with the municipality, establishing a relationship with the relevant department in advance speeds up the initial response. For staff, share the basics of encountering a bear (do not run, do not turn your back, keep your distance) before autumn begins. |
Source: Ministry of the Environment, “Bear Damage Countermeasures Package,” “Emergency Firearm Use Guidelines” and related materials; compiled by the HotelBank Editorial Team
On the cost side, national support programs are available through local governments. The Ministry of the Environment’s grant program for designated wildlife management covers buffer-zone development, electric fence installation, driving animals away from inhabited areas, management of attractants such as unmanaged fruit trees, the purchase and maintenance of box traps, and the collection and distribution of sighting information using ICT and drones. Under the Ministry of Agriculture, Forestry and Fisheries’ comprehensive grant for preventing wildlife damage, bear deterrent spray has also been added as an eligible item. In both cases the recipients are prefectures, municipalities and joint councils — these are not programs a lodging operator applies to directly. Since the local government decides what gets built in the area, the fastest way to make these programs usable in practice is to raise “what needs to be done around the inn’s grounds” early, through the local onsen association or tourism association.
Where the decision involves hard investment, it is also worth reviewing land-use restrictions on onsen district sites. When considering relocating outdoor facilities or rebuilding, wildlife countermeasures and land regulation are best examined at the same table.
Conclusion — How to Approach the Three Autumn Months
To summarize: fiscal 2025 produced 50,801 sightings nationwide, 61.2% of them in September–November. Of the 216 injury incidents, 68.1% also occurred in those three months, and the share taking place in inhabited areas — urban districts and the surroundings of homes — has risen. The eight top prefectures account for 79.4% of the national count; their 41 onsen and mountain municipalities hold 1,730 properties and 52,467 rooms, and 15.17 million guest nights of demand move through the same three months.
At the same time, beech flowering indices in Tohoku recovered in 2026, and the precondition of a severe nut-crop failure like 2025’s is not, for now, in evidence. Fruiting is confirmed only in autumn, so nothing can be stated definitively — but this is not a moment for excessive alarm either. The realistic landing point is to have the four no-cost measures in place at the start of autumn: posting sighting information, managing attractants, reviewing outdoor circulation routes, and setting up contact procedures with local government. With the emergency firearm use framework now operating and national support menus available through local governments, this is also a favorable moment to build up preparations at the community level. For an inn that lives alongside the mountains, autumn readiness is the very foundation that supports its guest business.
Related Reading
References and Sources
■ Government statistics and public materials
- Ministry of the Environment, “Bear-Related Information and Initiatives” — Bear Sighting Reports (preliminary) / Bear-Related Injury Incidents (preliminary) (updated September 9, 2026; injuries through August 2026, sightings through July 2026, preliminary figures)
- Ministry of the Environment, materials for the first FY2026 interministerial liaison meeting on bear damage countermeasures (May 1, 2026) — analysis of sighting conditions and breakdown of injury locations
- Ministry of the Environment, “Bear Damage Countermeasures Package” (adopted by the ministerial meeting on bear damage countermeasures, November 14, 2025)
- Ministry of the Environment, “Bear Damage Countermeasures Roadmap” (March 27, 2026)
- Ministry of the Environment, “Emergency Firearm Use” — Emergency Firearm Use Guidelines (revised April 2026)
- Ministry of the Environment, “Grant Program for Designated Wildlife Management Projects”
- Forestry Agency, Tohoku Regional Forest Office, “Beech Flowering and Fruiting Survey”
- Japan Tourism Agency, “Overnight Travel Statistics Survey” (finalized annual figures for 2024 and 2025, e-Stat)
- Ministry of the Environment, “Cabinet decision on the bill to partially amend the Act on Wildlife Protection, Control and Hunting Management” (Act No. 28 of 2025, effective September 1, 2025)
■ Market data
- MetroEngines Research — property and room counts (operating-status basis) and municipality-level estimated settled ADR (September–November 2025)