

How far does the weak yen actually reach inbound travel? By MUFG Bank’s published mid rate (TTM), the dollar stood at ¥160.02 at the end of August 2026 and ¥157.35 at the end of September, meaning the yen was more than 10% weaker at end-August and nearly 9% weaker at end-September than at the end of August 2024 (¥144.80). Meanwhile, the nationwide estimated transacted hotel ADR compiled by MetroEngines Research (the median of each of the 47 prefectures, weighted by the number of covered properties; 17,112 properties) was ¥11,500 in August 2026, just +0.9% versus August 2024. A room rate that is nearly flat in yen — how much of a price increase, or a cut, does it look like when re-measured in the currency in a visitor’s wallet? This article lines up 33 months of estimated transacted ADR, from January 2024 to September 2026, for Japan as a whole and five major areas (Tokyo, Osaka, Kyoto, Fukuoka and Hokkaido), converts each month at the month-end exchange rate into a currency-based ADR index (base = the same month of 2024), and overlays it on the Japan Tourism Agency (JTA)’s Overnight Travel Statistics Survey and JNTO’s visitor arrivals by nationality to identify which countries’ guests still leave room on price.
Metric Definitions Used in This Article
- ADR (Average Daily Rate): an estimated transacted rate (tax-exclusive equivalent), calculated by applying category-specific adjustment factors to the lowest published plan level on OTAs (per room, two guests per room, tax included). Checked against property-level results disclosed by listed hotel REITs (most recent three months), the median error is about 7%. It is an estimate and differs from each property’s actual transacted prices and accounting figures. Area-level ADR is the median of the covered properties (the level of a typical property in the area). “Japan (nationwide)” is our own aggregate: the median of each of the 47 prefectures weighted by each prefecture’s number of covered properties. Coverage is limited to verified categories — business, city, resort, ryokan and capsule — and the monthly number of covered properties nationwide ranges from 15,793 to 17,209.
- Currency-based ADR index: each month’s estimated transacted ADR (yen) is divided by that month-end’s exchange rate against the yen to convert it into the local currency, and indexed with the same month of 2024 = 100. The yen-based index is the index of the yen ADR itself, with no currency conversion. Exchange rates are MUFG Bank’s published mid rate (TTM, the midpoint of TTS and TTB, on the last business day of the month). Because MUFG does not publish a Taiwan dollar rate, the Taiwan dollar is a cross rate calculated from the USD/JPY mid rate and the USD/TWD inter-bank closing rate published by Central Bank of the Republic of China (Taiwan).
- Correlation coefficient (r): the Pearson correlation between monthly year-on-year changes over the 20 months from January 2025 to August 2026. Correlation does not imply causation.
- Data sources: MetroEngines Research (ADR); MUFG Bank and Central Bank of the Republic of China (Taiwan) (FX); Japan Tourism Agency (JTA), Overnight Travel Statistics Survey; JNTO, Visitor Arrivals Statistics
- — +2.1% in yen: the nationwide estimated transacted hotel ADR averaged +2.1% versus the same months of 2024 over January–September 2026; August alone was ¥11,500, +0.9% (17,112 properties) — essentially flat.
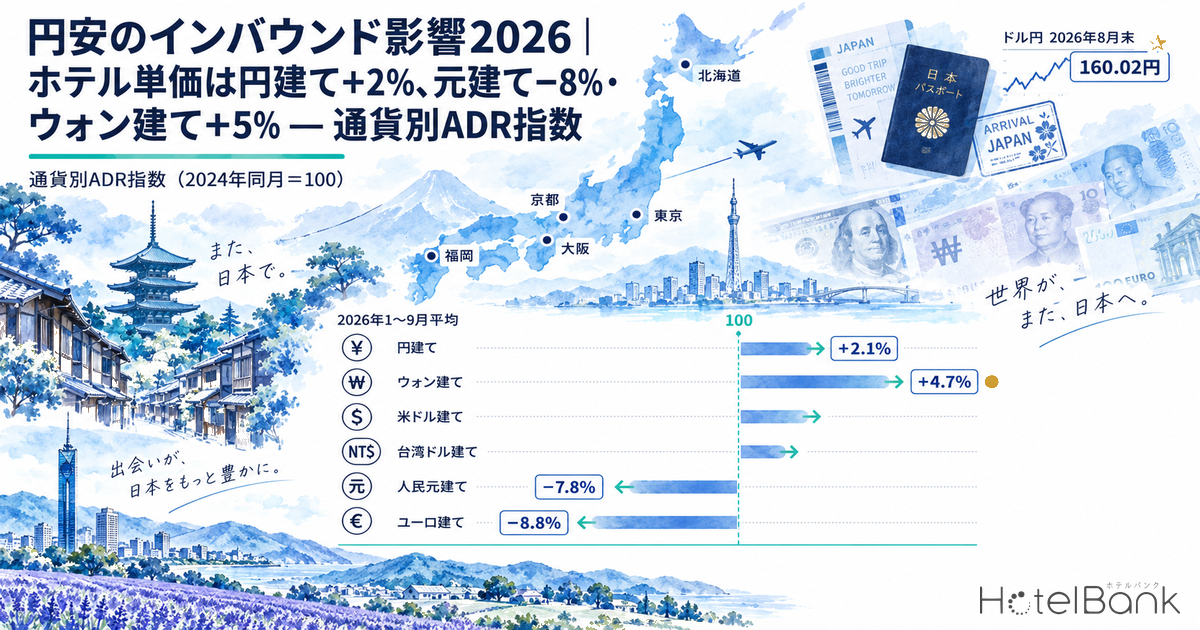
- — −9% to +5% when measured in other currencies: over the same period the index was −2.6% in USD, −7.8% in CNY, −3.8% in TWD and −8.8% in EUR; only the KRW index was up, at +4.7%.
- — The KRW index reversed in three months: from +12.0% in May 2026, the stronger won in July–August pushed August to −5.7%. In August, all five currencies other than the yen were below the same month of 2024.
- — Area differences: the January–September average yen-based index was 117.2 in Fukuoka, 114.4 in Tokyo and 110.0 in Hokkaido, versus 101.8 in Osaka and 101.1 in Kyoto. Even Fukuoka is only +6.0% in CNY.
- — Only Korea shows FX and visitor numbers moving with the expected signs (r1 = +0.68, r2 = −0.50; 20 months from January 2025 to August 2026). Correlation does not imply causation.
Yen ADR is up 2% on 2024, but measured in other currencies it ranges from −9% to +5%
Start with the yen. The nationwide estimated transacted ADR was ¥11,400 in August 2024, ¥12,000 in August 2025 during the Osaka Expo, and ¥11,500 in August 2026 — so August 2026 was −4.1% year on year and +0.9% versus two years earlier. September recovered to ¥11,000, +4.9% year on year and +10.7% versus two years earlier, and on a January–September 2026 average the yen-based index is 102.1, i.e. +2.1% over the same months of 2024. Yen hotel rates built up once in 2025 and then settled back to roughly 2024 levels in 2026. The same currency conversion using 2019 as the base is covered in Japan Hotels 7.9% Cheaper in USD Than 2019 — But +38.3% in Yen.
Re-measure the same ADR in visitors’ currencies, however, and the picture changes. The January–September 2026 average index was −2.6% in USD, −7.8% in CNY, −3.8% in TWD and −8.8% in EUR: a rate that should have risen in yen is cheaper than in 2024 in four currencies. The only exception is the won, at +4.7%, above the yen figure. Because the won was weak against the yen into 2024, KRW prices in the first half of 2026 looked even higher than yen prices. Here lies the asymmetry this article is about: the same fact — +2% in yen — reaches Korean guests as a 5% price increase and mainland Chinese guests as an 8% price cut.
Source: Compiled by HotelBank Editorial Team from MetroEngines Research data (nationwide = median estimated transacted ADR of the 47 prefectures weighted by the number of covered properties; 15,793–17,209 covered properties per month)
21 months of currency-based ADR indices — every currency fell below 100 in summer 2026, and the won dropped sharply
Tracking the index month by month shows how much exchange rates move the way hotel rates “look.” In spring 2025, as the yen strengthened, the USD, CNY and KRW indices all rose to around 110 — Japanese hotels looked 10% more expensive in local currency than in 2024. From autumn 2025, as the yen fell to the high ¥150s against the dollar and the ¥180s against the euro, the indices were marked down, and by February 2026 the CNY index had fallen to 90.6 and the EUR index to 87.5. As of August 2026, against +0.9% in yen, the index was −8.7% in USD, −5.7% in KRW, −13.4% in CNY, −9.5% in TWD and −12.7% in EUR — all five currencies other than the yen below the same month of 2024.
The won deserves attention. The rate for ₩100 against the yen stayed weak at ¥10.64 at the end of May 2026 and ¥10.48 at the end of June, but swung quickly toward a stronger won and weaker yen: ¥11.22 at the end of July and ¥11.62 at the end of August. As a result, Japanese hotels — which in May looked most expensive to Korean guests, at +12.0% in KRW against +4.7% in yen — had in just three months turned cheaper than in 2024 by August, at −5.7% in KRW against +0.9% in yen. The stronger-won, weaker-yen relationship held even after the Japanese and US governments carried out coordinated yen-buying intervention on July 31, and the rate was still ¥11.58 at the end of September. For the Korean market alone, summer 2026 was a phase in which “the exchange rate cut prices for you.”
Source: Compiled by HotelBank Editorial Team from MetroEngines Research (ADR); MUFG Bank published TTM rates and Central Bank of the Republic of China (Taiwan) (FX)
It is worth setting out the exchange-rate levels themselves. Comparing end-August 2024 with end-August 2026, the yen weakened by 10.5% against the US dollar, 15.6% against the euro, 16.6% against the yuan, 11.5% against the Taiwan dollar and 7.0% against the won (each expressed as the currency’s rise against the yen). The yen fell least against the won and most against the yuan and the euro. In other words, even with the same +2% yen ADR, the price cut is largest for guests from the euro area and mainland China and smallest for Korean guests. As shown later, this order does not necessarily match the growth of visitors by country.
| Date | USD | EUR | CNY | KRW 100 | TWD |
|---|---|---|---|---|---|
| End-Aug 2024 | ¥144.80 | ¥160.44 | ¥20.40 | ¥10.86 | ¥4.53 |
| End-Aug 2025 | ¥146.92 | ¥171.47 | ¥20.63 | ¥10.62 | ¥4.80 |
| End-May 2026 | ¥159.39 | ¥185.66 | ¥23.52 | ¥10.64 | ¥5.08 |
| End-Aug 2026 | ¥160.02 | ¥185.50 | ¥23.78 | ¥11.62 | ¥5.05 |
| End-Sep 2026 | ¥157.35 | ¥178.34 | ¥23.45 | ¥11.58 | ¥4.94 |
Source: MUFG Bank published mid rate (midpoint of TTS and TTB, last business day of the month); the Taiwan dollar is a cross rate using Central Bank of the Republic of China (Taiwan)’s USD/TWD inter-bank closing rate. Compiled by HotelBank Editorial Team
Currency-based indices for five major areas — Fukuoka and Tokyo are about +15% in yen but only +4–6% in CNY
By area, the larger the rise in yen, the larger the currency asymmetry. The January–September 2026 average yen-based index was 117.2 in Fukuoka, 114.4 in Tokyo and 110.0 in Hokkaido — more than 10% above 2024 — while Osaka (101.8) and Kyoto (101.1) were back to 2024 levels. Osaka rose to an annual average of 129.3 in 2025, the year of the Expo, and the rebound means it is sharply down year on year in 2026 but flat versus two years earlier.
The table below breaks this yen-based index out by currency. Despite a 17.2% rise in yen, Fukuoka is only +6.0% in CNY and +4.7% in EUR. Tokyo, at +14.4% in yen, is +3.5% in CNY and +2.2% in EUR — to guests from Europe and mainland China, prices are almost the same as in 2024. Conversely, the KRW index is +20.6% in Fukuoka and +17.7% in Tokyo, above the yen figures: for Korean guests, hotels in Kyushu and the Tokyo area were clearly more expensive in the first half of 2026. Even so, visitors from Korea kept growing, reaching 850,500 in August 2026 (+28.7% year on year), which suggests that Korean demand is supported by factors other than the exchange rate.
| Area | Aug 2026 estimated transacted ADR (¥) | Yen | USD | KRW | CNY | TWD | EUR |
|---|---|---|---|---|---|---|---|
| Japan | 11,538 | 102.1 (+2.1%) | 97.4 (−2.6%) | 104.7 (+4.7%) | 92.2 (−7.8%) | 96.2 (−3.8%) | 91.2 (−8.8%) |
| Tokyo | 11,810 | 114.4 (+14.4%) | 109.3 (+9.3%) | 117.7 (+17.7%) | 103.5 (+3.5%) | 108.0 (+8.0%) | 102.2 (+2.2%) |
| Osaka | 9,058 | 101.8 (+1.8%) | 97.2 (−2.8%) | 104.6 (+4.6%) | 92.0 (−8.0%) | 96.0 (−4.0%) | 90.9 (−9.1%) |
| Kyoto | 13,099 | 101.1 (+1.1%) | 96.5 (−3.5%) | 103.9 (+3.9%) | 91.4 (−8.6%) | 95.4 (−4.6%) | 90.4 (−9.6%) |
| Fukuoka | 11,308 | 117.2 (+17.2%) | 111.9 (+11.9%) | 120.6 (+20.6%) | 106.0 (+6.0%) | 110.6 (+10.6%) | 104.7 (+4.7%) |
| Hokkaido | 12,230 | 110.0 (+10.0%) | 104.9 (+4.9%) | 113.0 (+13.0%) | 99.4 (−0.6%) | 103.8 (+3.8%) | 98.2 (−1.8%) |
Source: Compiled by HotelBank Editorial Team from MetroEngines Research data (simple average of monthly indices for January–September 2026; figures in red are below the same-month 2024 average)
Source: Compiled by HotelBank Editorial Team from MetroEngines Research data
Narrowing to the single month of August 2026 makes the asymmetry even sharper. Tokyo, Osaka and Kyoto were below August 2024 even in yen (−2.8%, −4.0% and −2.8% respectively), equivalent to price cuts of 16–18% in CNY and 16–17% in EUR. Fukuoka and Hokkaido held +4–5% in yen, but were still cheaper than in 2024 in all five non-yen currencies. August was also a month in which visitors from mainland China fell sharply, and the fact that urban hotels gave up rate in yen can be read against a shift in market mix that kept the currency tailwind from fully taking effect.
| Area | N (covered properties) | Yen | USD | KRW | CNY | TWD | EUR |
|---|---|---|---|---|---|---|---|
| Japan | 17,112 | +0.9% | −8.7% | −5.7% | −13.4% | −9.5% | −12.7% |
| Tokyo | 1,140 | −2.8% | −12.0% | −9.1% | −16.6% | −12.8% | −15.9% |
| Osaka | 653 | −4.0% | −13.1% | −10.3% | −17.6% | −13.9% | −16.9% |
| Kyoto | 605 | −2.8% | −12.1% | −9.2% | −16.6% | −12.8% | −16.0% |
| Fukuoka | 476 | +4.3% | −5.6% | −2.5% | −10.5% | −6.4% | −9.8% |
| Hokkaido | 960 | +5.2% | −4.8% | −1.7% | −9.8% | −5.6% | −9.0% |
Source: Compiled by HotelBank Editorial Team from MetroEngines Research data (August 2026; difference from August 2024 = 100. N is the number of properties covered by the month’s estimated transacted ADR)
Overlaying JTA and JNTO statistics — foreign guest-nights fell 6.5% in July, and the winners and losers by country do not follow the currency order
Let us check the demand-side figures. According to the second preliminary release of the Japan Tourism Agency (JTA)’s Overnight Travel Statistics Survey, foreign guest-nights in July 2026 totaled 13.31 million, −6.5% year on year (the first preliminary release on August 31 had put them at 13.58 million, −4.6%, before the second preliminary release on September 30 revised them down). The first preliminary release for August 2026 showed 12.64 million guest-nights, −10.3%, a wider decline. By nationality (properties with 20 or more rooms), July’s top five were Taiwan with 2,127,160 guest-nights (+24.7%), China with 1,771,610 (−44.7%), Korea with 1,545,430 (+28.4%), the US with 1,347,120 (−3.2%) and Hong Kong with 609,630 (+49.3%); together these five countries and regions accounted for 63.4% of the total.
JNTO’s visitor arrivals (August estimate) show the same pattern. The total was 3,098,900 (−9.6% year on year), the first decline in two months, but nearby East Asian markets grew — Korea at 850,500 (+28.7%), the largest of 23 markets, Taiwan at 666,000 (+7.3%) and Hong Kong at 247,300 (+9.4%) — while China fell sharply to 418,000 (−59.0%) and the US edged up to 197,400 (+1.5%). JNTO referred to the impact of the Chinese government’s travel advisory for Japan in explaining China’s decline.
| Country/region | July foreign guest-nights | YoY | August visitor arrivals | YoY | August currency-based ADR index (nationwide, same month of 2024 = 100) |
|---|---|---|---|---|---|
| Taiwan | 2,127,160 | +24.7% | 666,000 | +7.3% | 90.5 (TWD) |
| China | 1,771,610 | −44.7% | 418,000 | −59.0% | 86.6 (CNY) |
| Korea | 1,545,430 | +28.4% | 850,500 | +28.7% | 94.3 (KRW) |
| US | 1,347,120 | −3.2% | 197,400 | +1.5% | 91.3 (USD) |
| Hong Kong | 609,630 | +49.3% | 247,300 | +9.4% | 91.3 (USD) |
Source: Japan Tourism Agency (JTA), Overnight Travel Statistics Survey July 2026 (second preliminary release), foreign guest-nights by nationality; JNTO, Visitor Arrivals August 2026 estimate; currency-based ADR index compiled by HotelBank Editorial Team from MetroEngines Research, MUFG Bank and Central Bank of the Republic of China (Taiwan) data
Set the currency order against the demand order and the relationship is not straightforward. The currencies in which hotels became “cheapest” were the yuan (August index 86.6) and the euro (87.3), yet guest-nights from China were −44.7%, and those from Europe — France +8.9%, Germany +5.3%, Spain +10.8% — were firm but well short of Korea (+28.4%) and Taiwan (+24.7%). Korea, whose won index (94.3) showed the smallest price cut, grew the most. The first thing confirmed is the obvious fact that exchange rates are not the main driver of inbound demand.
The currency tailwind seen through correlation — only Korea’s signs line up
So do exchange rates have no effect at all? For the 20 months from January 2025 to August 2026, we computed the correlation coefficient r1 between each currency’s rise against the yen (year on year) and the year-on-year change in visitors from that country. We also show r2, the correlation between the year-on-year change in local-currency ADR and visitor YoY. In a price-sensitive market, r1 should be positive (the stronger the currency, the more people come) and r2 negative (the more expensive in local currency, the fewer come).
| Country | Currency | r1: currency’s rise vs. yen × visitor YoY | r2: local-currency ADR YoY × visitor YoY | Average visitor YoY |
|---|---|---|---|---|
| Korea | KRW | +0.68 | −0.50 | +12.8% |
| Taiwan | TWD | +0.34 | −0.04 | +15.4% |
| Hong Kong | USD (HKD is pegged to USD) | +0.32 | −0.46 | +2.0% |
| US | USD | −0.64 | +0.38 | +16.0% |
| China | CNY | −0.72 | +0.38 | −2.1% |
| France | EUR | +0.02 | +0.62 | +15.7% |
| Germany | EUR | −0.28 | +0.78 | +23.1% |
| Italy | EUR | −0.45 | +0.69 | +25.9% |
| Spain | EUR | −0.65 | +0.67 | +29.3% |
Source: Compiled by HotelBank Editorial Team from JNTO Visitor Arrivals Statistics, MetroEngines Research, MUFG Bank and Central Bank of the Republic of China (Taiwan) data (n = 20 months, January 2025–August 2026, using nationwide estimated transacted ADR)
Source: Compiled by HotelBank Editorial Team from JNTO Visitor Arrivals Statistics, MetroEngines Research, MUFG Bank and Central Bank of the Republic of China (Taiwan) data
The result is clear: only Korea had both signs consistent with the price-sensitivity hypothesis (r1 = +0.68, r2 = −0.50). The stronger the won against the yen in a given month, the more Korean visitors came, and the more KRW hotel rates rose, the slower the growth. Taiwan and Hong Kong show weak positive r1 (+0.34 and +0.32): the direction is consistent but explanatory power is limited. China has a strongly negative r1 of −0.72, but this is an artifact of coincidence — the yuan was strengthening against the yen at the same time as visitors fell by nearly 60% following the travel advisory from autumn 2025 — and should not be read as exchange rates reducing demand. The US is also negative at −0.64, implying fewer Americans in months of a stronger dollar, but this largely reflects overlapping trends: US visitors grew by double digits during the weak-dollar phase of 2025, and growth slowed in 2026 as the dollar strengthened. The four European countries show positive r2 of +0.6 to +0.8 — the unnatural sign of “the more expensive in euros, the more people come” — and the natural interpretation is that structural growth in long-haul markets overrides price changes.
In sum, exchange rates are statistically visible against monthly demand swings only for Korea — a short-haul market with short stays and a high repeat rate — and even there the correlation is moderate. In the other markets, variables other than FX dominate: policy (China), income and airline seat capacity (Europe and the US), and holiday systems (Taiwan and Hong Kong). It is closer to reality to think that the currency tailwind affects “how much those who come can pay for lodging” more than “whether they come.”
Source: Compiled by HotelBank Editorial Team from MUFG Bank published mid rate (₩100 against the yen, month-end) and JNTO Visitor Arrivals Statistics
Which countries’ guests still leave room on price — pricing considerations by currency
Let us reread these figures from the perspective of a property operator. What the 2026 currency-based indices show is that even if rates are held flat in yen, depending on the guest’s currency they amount to a price cut of around 10% versus 2024. That is where pricing room — upside — lies.
Korea (KRW index: 94.3 in August, 104.6 in September). In the first half of 2026, despite looking more expensive in KRW than in yen — +2–12% versus 2024 — Korean visitors kept growing at +8–28% year on year, and from summer the stronger won pulled the index down sharply. Because this market is relatively price-sensitive, even taking into account the pause in the won’s strength in September (¥11.58 at end-September), properties in Kyushu, Kansai and the Tokyo area with a high share of Korean guests this autumn and winter have an opportunity to revisit rates now that effective KRW prices are back to 2024 levels. As a guide, at the August nationwide level there is about 6% of yen upside before the KRW index returns to 100.
Taiwan (TWD index: 90.5 in August, 96.2 January–September average). July guest-nights were +24.7%, the top nationality, and August visitors kept growing at +7.3%, yet prices in TWD are nearly 10% cheaper than in 2024. r1 is +0.34, showing some consistency with FX. In areas with a high Taiwanese share — Hokkaido, Kyushu and Kansai — simply returning to 2024 levels in TWD implies, on paper, roughly 10% of yen upside.
Europe (EUR index: 87.3 in August, 91.2 January–September average). Despite the largest price decline, visitors keep growing by double digits, and the correlations show almost no price sensitivity. This market has many long-stay, high-spending guests, and on a currency basis it has the most room. Regional ryokan and resorts with a rising share of euro-area guests can take advantage of the fact that a rate increase in yen looks like a flat price in euros.
US (USD index: 91.3 in August). In USD terms hotels are 9% cheaper than in 2024, but visitor growth has slowed to +1.5%, so the issue is a plateau in demand rather than price. There is room, but this is a market where increases easily come without volume, and it should be handled with care.
Mainland China (CNY index: 86.6 in August). By currency it is the cheapest, but demand is being determined by policy, and this is not the moment to load FX room onto price. When demand recovers, a “stored-up tailwind” of more than 10% cheaper in CNY could take effect all at once, so there is value in preparing pricing for that point now. Even when Chinese visitors fell by about 60%, ADR in some major cities still rose, according to our measurements across four cities during the 2026 Labor Day holiday.
Whether to reflect currency-side room in yen pricing depends on each property’s guest mix and competitive environment. But judging only by “flat year on year in yen” means continuing to give most guests what is effectively a price cut. Checking FX outlooks as of September 2026, Mitsubishi UFJ Research and Consulting, in its short-term economic outlook published on September 8, assumed USD/JPY of ¥159.4 for July–September 2026, ¥156.0 for October–December and ¥153.8 on average for fiscal 2027, while Nomura Securities, in an August 26 report, expected an adjustment to the mid-¥150s toward year-end (as of July 8 its view had been around ¥155 at year-end, with a summer peak in a ¥160–165 range). If a gradual yen appreciation toward year-end is the central scenario for these firms, the price cut seen by currency will narrow. Now is the time to decide how far to reflect it for guests in each currency while the tailwind is still blowing.
Summary
The nationwide estimated transacted hotel ADR was +2.1% versus the same months of 2024 on a January–September 2026 average and +0.9% in August 2026 alone — nearly flat in yen. Converted into local currencies at each month-end’s exchange rate, the January–September 2026 average equals price cuts of 2.6% in USD, 7.8% in CNY, 3.8% in TWD and 8.8% in EUR, while only the KRW figure looked like a 4.7% increase. Even the won turned to −5.7% in August after strengthening in July–August, creating the asymmetry of “+0.9% in yen but −5.7% in won.” On the demand side, foreign guest-nights fell to 13.31 million in July 2026 (−6.5%) and 12.64 million in August (−10.3%), with growth from Korea, Taiwan and Hong Kong contrasting with a sharp decline from China. Only Korea showed correlations between FX and visitor arrivals with the hypothesized signs; in other markets, factors other than FX dominate. The implication for operators is that, by currency, the most pricing room lies with Europe and Taiwan, followed by Korea, while the US (slowing demand) and China (policy factors) call for a different order in loading FX room onto price. ADR in this article is an estimate, and because September 2026 is the most recently finalized month, it may change slightly as covered properties are added.
Frequently Asked Questions
Q. Has the weak yen raised or lowered hotel prices for foreign visitors?
The estimated transacted ADR in yen averaged +2.1% versus the same months of 2024 over January–September 2026 — nearly flat — but converted into local currencies at each month-end’s exchange rate, it is equivalent to declines of 2.6% in USD, 7.8% in CNY and 8.8% in EUR. Only in KRW did prices look 2–12% higher in the first half of 2026, and that turned to −5.7% in August as the won strengthened in July–August. In other words, prices “rose” only in yen and, for part of the period, in won; in most guests’ currencies they fell.
Q. In which country is the currency tailwind working most?
Only Korea showed monthly correlations between FX and visitor arrivals with consistent signs (correlation of +0.68 between the currency’s rise against the yen and visitor YoY). Taiwan and Hong Kong showed weak positive correlations, while in China, the US and Europe factors other than FX dominate, and no tailwind could be read from the correlations. Correlation does not imply causation.
Q. How is the currency-based ADR index calculated?
Each month’s estimated transacted ADR (yen) is divided by that month-end’s MUFG Bank published mid rate (for the Taiwan dollar, a cross rate using Central Bank of the Republic of China (Taiwan)’s USD/TWD closing rate) to convert it into the local currency, and indexed with the same month of 2024 = 100. Using the same month as the base removes the effect of seasonality.
Q. By area, where have hotels become more expensive when measured by currency?
The January–September 2026 average yen-based index (same month of 2024 = 100) was 117.2 in Fukuoka, 114.4 in Tokyo and 110.0 in Hokkaido, and Fukuoka and Tokyo were above 100 even in CNY and EUR (Fukuoka 106.0 in CNY and 104.7 in EUR; Tokyo 103.5 and 102.2). Osaka (101.8) and Kyoto (101.1) were at 2024 levels in yen and below 2024 in the four currencies other than the won.
Related Articles
- Japan Hotels 7.9% Cheaper in USD Than 2019 — But +38.3% in Yen
- US Now Tops Japan Inbound at 13.5% — Prefecture Host Map 2026
References and Sources
■ Data sources
Estimated transacted ADR is the monthly value for the 47 prefectures compiled by MetroEngines Research (33 months from January 2024 to September 2026; 15,793–17,209 covered properties nationwide per month). FX uses MUFG Bank’s published mid rate (last business day of the month) and Central Bank of the Republic of China (Taiwan)’s USD/TWD inter-bank closing rate; the demand side uses the Japan Tourism Agency (JTA)’s Overnight Travel Statistics Survey (July 2026 second preliminary and August 2026 first preliminary releases) and JNTO Visitor Arrivals Statistics (through the August 2026 estimate).
■ Calculation assumptions
The currency-based ADR index divides each month’s estimated transacted ADR (yen) by that month-end’s exchange rate against the yen, with the same month of 2024 = 100. The January–September average is a simple average of the monthly indices. Hong Kong uses the USD index because the Hong Kong dollar is pegged to the US dollar. Correlation coefficients are Pearson correlations between year-on-year changes over the 20 months from January 2025 to August 2026. “Yen upside” is a mechanically calculated guide to the yen increase needed for the local-currency index to return to 100.
■ Limitations and caveats
ADR is an estimate covering all guests, not a transacted rate by nationality (median error of about 7% against disclosed results of listed hotel REITs). FX is a single month-end rate and differs from intra-month averages or rates at the time of booking. Correlations are based on 20 months of monthly data and do not indicate causation. Preliminary figures in the Overnight Travel Statistics Survey may be revised when final figures are published. FX outlooks reflect each firm’s view at the time of publication.
■ Sources
- MetroEngines Research — estimated transacted ADR (47 prefectures, January 2024–September 2026; 15,793–17,209 covered properties nationwide per month)
- MUFG Bank, Foreign Exchange Rates: Historical Rates (published mid rate, last business day of each month)
- Central Bank of the Republic of China (Taiwan), NTD/USD Inter-bank Closing Rate
- Japan Tourism Agency (JTA), Overnight Travel Statistics Survey (August 2026 first preliminary release, July 2026 second preliminary release; published September 30, 2026)
- Japan Tourism Agency (JTA), Overnight Travel Statistics Survey July 2026 second preliminary release, foreign guest-nights by nationality (place of origin) (PDF)
- JNTO, Visitor Arrivals Statistics: monthly visitor arrivals by nationality (2003–2026, updated September 16, 2026)
- Visitors to Japan fell 9.6% to 3.1 million in August 2026 (Travel Voice, September 16, 2026)
- Mitsubishi UFJ Research and Consulting, Short-Term Economic Outlook for FY2026/2027 (September 2026) (September 8, 2026)
- Nomura Securities, “Renewed wariness of a move away from the US dollar: will the yen become a destination for dollar selling?” (August 26, 2026)
- Nomura Securities, “Japan–US coordinated intervention takes yen-weakness correction into a new phase” (August 3, 2026)
- Nomura Securities, “Possible turn to yen strength toward year-end” (July 8, 2026)