

Two contradictory developments around Chinese group travel were reported in June 2026: a resumption of tour sales ahead of the summer holiday season, and — almost immediately afterward — a suspension of those same sales. The situation remains fluid, but for hotel operators the question narrows to one thing: when groups do come back, where in Japan are the rooms that can absorb them? This article sets aside demand-side visitor share and instead takes stock of the supply side — where the room inventory held by “large-format” properties of more than 150 rooms is thick, and where it is thin — using actual data.
Metric Definitions Used in This Article
- Large-format property (150+ rooms): an operating lodging facility with 150 or more guest rooms. This is a working threshold we set as a rough marker for the ability to absorb a group of one to three coaches at a single property. It is not an official definition.
- ADR (average daily rate): an estimated settled rate (tax-exclusive equivalent) calculated by applying category-specific adjustment coefficients to the lowest published plan rate each property lists on OTAs and similar channels (double occupancy, per-room rate, tax-inclusive). Cross-checked against property-level results disclosed by listed hotel REITs, the median error is approximately 7%. These are estimates and differ from each property’s actual transacted rates or accounting figures. Area-level ADR is the median across the target properties (the level of a typical property in that area).
- Data coverage: approximately 27,000 properties and approximately 1.26 million rooms confirmed to be operating, out of the facilities tracked by MetroEngines Research (as of August 2026). The population consists of properties listed on major OTAs and similar channels; this is not a complete census. Ryokan, minshuku, and simple lodging houses not listed on OTAs are excluded.
- Data source: MetroEngines Research
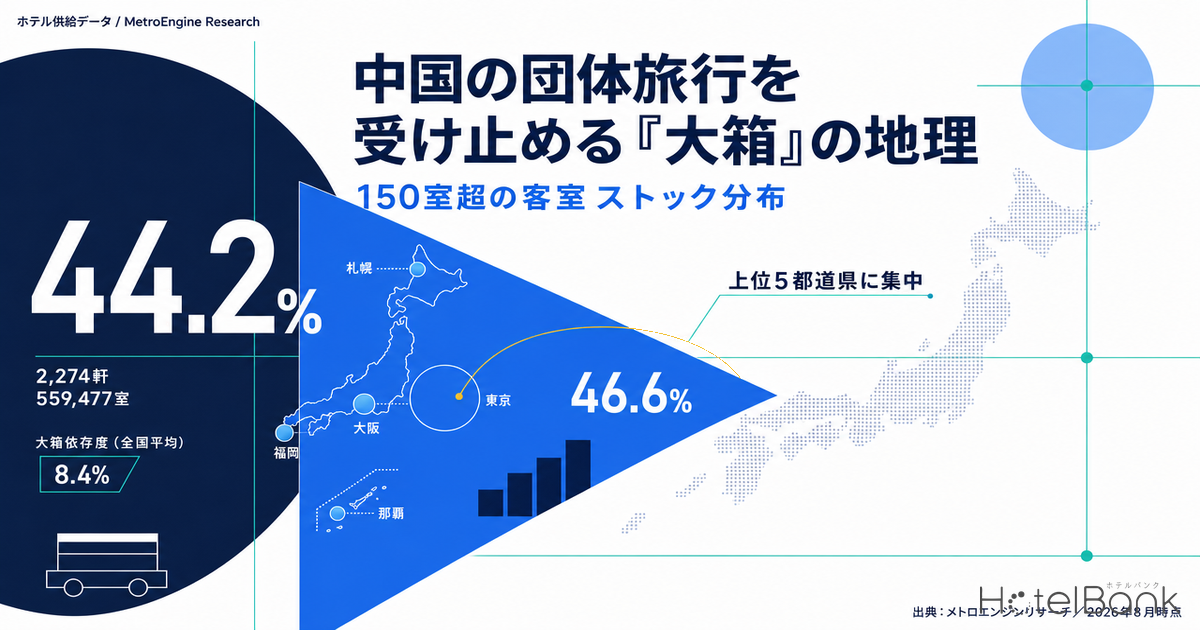
- — Japan’s large-format properties (150+ rooms, operating) number 2,274 properties and 559,477 rooms. They account for just 8.4% of properties but 44.2% of rooms.
- — The top five prefectures (Tokyo, Osaka, Hokkaido, Fukuoka, Chiba) hold 46.6% of large-format rooms; the top ten reach 64.9%.
- — Of the four prefectures on the reported group itinerary, Kyoto has 18,190 rooms, while Nara has just 5 properties and 1,154 rooms (17.3% of the prefecture’s rooms).
- — The 150+ room pipeline visible in building plans is 46 projects and 12,962 rooms. Tokyo, Chiba, Hokkaido, and Osaka account for roughly 60% — overlapping the existing clusters.
- — Ten prefectures have no property of 300+ rooms at all. Area-wide multi-property bookings, capturing the mid-trip night, and inventory designed to switch between group and FIT become the realistic options.
First, the facts — what was reported in June 2026
Let us lay out the reporting that forms the premise of this article, with dates and actors made explicit. No evaluation is added; only the reported facts are listed.
From November 2025 onward, multiple media outlets reported that calls to refrain from travel to Japan were being issued on the Chinese side, and that major local travel agencies had been instructed to curtail their Japan-bound business. Group travel remained effectively halted.
That situation shifted in June 2026. By June 19, it emerged that an affiliate of China Tourism Group, the state-owned tourism major, had resumed recruiting for Japan-bound group tours (Nippon TV NEWS NNN / distributed by Kyodo News). The reported package was a seven-day, six-night itinerary covering Tokyo, Kyoto, Osaka, and Nara, with departures said to begin in mid-July. Several private travel agencies had reportedly also been expanding group tour operations since May of the same year.
At the same time, there were reports that on that very same June 19, a different state-affiliated travel company suspended sales of Japan-bound group tours (Record China, via Taiwanese media). It has been suggested that the wide attention the reporting attracted may have led to renewed tightening of oversight of travel agencies.
In other words, what can be said at this point is neither that “group travel has fully resumed” nor that “it remains completely halted,” but that we are in a fluid phase in which a resumption of recruitment and a suspension of sales are reported simultaneously. What operators need, therefore, is not to predict whether a resumption will occur, but to understand where the receiving capacity sits so they can respond whenever movement comes.
The demand-side numbers are worth confirming as well. According to the Japan National Tourism Organization (JNTO), inbound visitors in June 2026 totaled 3,148,600, down 6.8% year on year. Of these, China accounted for 340,700 (down 57.3% year on year). In the same month, South Korea at 787,100 (+7.8%), Taiwan at 670,400 (+14.6%), and the United States at 354,500 (+2.7%) all set records for the month of June, while the first-half cumulative total came to 21,084,800 (down 2.0% year on year). Other markets have filled the Chinese gap to a considerable degree, but demand in the form of groups — which consume a large number of rooms at once — is not easily substituted by FIT (independent) travel from other markets. That is precisely why the geography of large-format stock matters. On how far this gap was offset in regional ADR and guest numbers, Did Non-China Inbound Fill China’s -58% Gap? examines the question using accommodation statistics and area-level rates.
Japan has 2,274 large-format properties and 559,000 rooms — 8% of properties hold 44% of rooms
We aggregated the 27,161 operating properties and 1,267,037 rooms for which room counts are known among the facilities tracked by MetroEngines Research. Properties with 150 or more rooms number 2,274 with 559,477 rooms. They represent only 8.4% of all properties, yet 44.2% of all rooms. Narrowing further, properties with 300 or more rooms number 403 with 184,775 rooms — 14.6% of all rooms.
This structure, in which rooms concentrate in a small number of properties, is exactly what governs the reality of group acceptance. A single coach of around 40 passengers requires roughly 20 rooms; three coaches require roughly 60 rooms on the same date at the same property. Absorbing multiple coaches at a property of fewer than 100 rooms is physically difficult, and in practice properties of 150 rooms or more — preferably 300 or more — become the starting point for negotiation.
Source: Compiled by the HotelBank Editorial Team from MetroEngines Research (N=2,274 properties / 559,477 rooms)
The top five prefectures alone (Tokyo, Osaka, Hokkaido, Fukuoka, Chiba) account for 260,443 rooms, or 46.6% of Japan’s large-format rooms. Extending to the top ten prefectures brings the figure to 64.9%. By contrast, the bottom 20 prefectures combined do not reach even 10% of the national total. This is the outcome of a history in which Japan’s hotel supply has concentrated large properties in a limited set of locations: cities, airports, and major resorts.
| Prefecture | 150+ rooms | Rooms | National share | Of which 300+ rooms | Share of prefecture’s rooms |
|---|---|---|---|---|---|
| Tokyo | 369 | 101,278 | 18.1% | 89 / 44,592 rooms | 63.2% |
| Osaka | 204 | 58,348 | 10.4% | 69 / 30,605 rooms | 62.7% |
| Hokkaido | 180 | 44,371 | 7.9% | 38 / 15,620 rooms | 53.6% |
| Fukuoka | 123 | 29,646 | 5.3% | 19 / 8,433 rooms | 60.3% |
| Chiba | 73 | 26,800 | 4.8% | 28 / 17,778 rooms | 60.6% |
| Aichi | 102 | 25,792 | 4.6% | 17 / 8,051 rooms | 52.5% |
| Kanagawa | 95 | 22,257 | 4.0% | 13 / 5,957 rooms | 51.8% |
| Okinawa | 81 | 21,217 | 3.8% | 24 / 9,392 rooms | 49.8% |
| Kyoto | 72 | 18,190 | 3.3% | 16 / 6,991 rooms | 41.4% |
| Miyagi | 67 | 14,951 | 2.7% | 5 / 2,133 rooms | 54.3% |
| Hyogo | 62 | 14,797 | 2.6% | 9 / 3,894 rooms | 41.6% |
| Hiroshima | 50 | 12,505 | 2.2% | 8 / 3,642 rooms | 49.3% |
| Shizuoka | 57 | 11,544 | 2.1% | 6 / 2,259 rooms | 24.4% |
| Niigata | 42 | 10,389 | 1.9% | 9 / 4,056 rooms | 37.1% |
| Fukushima | 41 | 8,241 | 1.5% | 2 / 732 rooms | 33.4% |
Source: Compiled by the HotelBank Editorial Team from MetroEngines Research (operating properties with known room counts, N=27,161)
Even inside the Golden Route the density varies — Nara has 5 properties and 1,154 rooms
The reported itinerary was Tokyo, Kyoto, Osaka, and Nara. Summing the large-format stock of these four prefectures gives 650 properties and 178,970 rooms, or 32.0% of the national total. On the headline numbers the receiving capacity looks ample, but the picture changes once the breakdown is opened up.
Against Tokyo’s 101,278 rooms and Osaka’s 58,348, Kyoto has 18,190 rooms, and Nara has only 5 properties and 1,154 rooms. Nara’s large-format rooms represent 0.2% of the national total and just 17.3% of the prefecture’s own 6,675 total rooms. Nara is a fixture on group itineraries, yet it barely counts as accommodation capacity. In practice, the structure forces an itinerary in which groups stay in Kyoto or Osaka and visit Nara as a day trip.
For Nara this means clear headroom. The destination is reliably on the itinerary while the lodging demand flows to other prefectures; if more properties capable of handling groups — even mid-sized ones — were added, those room nights could be captured directly. The same structure applies to other areas that are easily built into itineraries yet thin on large-format stock, such as the Mount Fuji area (Yamanashi, 16.6%) and the Central Japan mountains (Nagano, 11.9%; Gifu, 22.6%).
Source: Compiled by the HotelBank Editorial Team from MetroEngines Research
The chart above lines up the share of each prefecture’s total rooms held by properties of 150 rooms or more — a kind of “large-format dependency.” The national average is 44.2%. Tokyo at 63.2%, Osaka at 62.7%, Chiba at 60.6%, and Fukuoka at 60.3% sit at the top, while Nagano at 11.9%, Yamanashi at 16.6%, Nara at 17.3%, and Yamagata at 21.7% remain around 20%. The latter are areas where small ryokan and pensions are the mainstay of room supply, and they are not designed to absorb a group at a single property.
That said, this is not a weakness so much as the flip side of a different strength. Areas rich in varied lodging for individuals and small parties are well positioned in a market shifting toward FIT. For those that do want to target group business, the realistic option is area-wide booking — bundling several properties to distribute a single group across them, with a DMO or ryokan association acting as a single point of contact and coach routing and dining venues designed jointly.
Clustering at the city level — Minato, Chuo Osaka, Chuo Sapporo, and Hakata
At a finer grain than the prefecture, the “towns” where large-format properties gather are even more limited. Aggregating properties of 150+ rooms by municipality, the leaders are Minato Ward, Tokyo (63 properties, 18,572 rooms), Chuo Ward, Osaka (69 properties, 18,003 rooms), Chuo Ward, Sapporo, Hokkaido (64 properties, 16,330 rooms), and Hakata Ward, Fukuoka (59 properties, 14,241 rooms).
Source: Compiled by the HotelBank Editorial Team from MetroEngines Research (circle size represents the number of rooms in properties of 150+ rooms within the municipality)
The map shows that the clustering of large-format properties takes an extremely simple form: the urban corridor along the Pacific side of Honshu, plus Sapporo, Fukuoka, and Naha. On the Sea of Japan side, only Kanazawa (23 properties, 6,018 rooms) and Chuo Ward, Niigata (21 properties, 4,621 rooms) stand out, while the San’in region and Shikoku remain at a level of roughly a dozen properties in each prefectural capital.
| Area | 150+ rooms | Rooms | Estimated settled ADR | Properties in ADR calculation |
|---|---|---|---|---|
| Minato, Tokyo | 63 | 18,572 | ¥15,000 | N=131 |
| Chuo, Osaka | 69 | 18,003 | ¥9,300 | N=194 |
| Chuo, Sapporo, Hokkaido | 64 | 16,330 | ¥13,800 | N=136 |
| Hakata, Fukuoka | 59 | 14,241 | ¥12,800 | N=147 |
| Chuo, Tokyo | 60 | 13,983 | ¥15,700 | N=152 |
| Shinjuku, Tokyo | 36 | 12,725 | ¥12,900 | N=100 |
| Naka, Nagoya, Aichi | 43 | 11,319 | ¥8,300 | N=87 |
| Urayasu, Chiba | 19 | 9,843 | — | — |
| Naha, Okinawa | 40 | 9,334 | ¥9,600 | N=141 |
| Shimogyo, Kyoto | 29 | 7,653 | ¥11,100 | N=165 |
| Narita, Chiba | 16 | 7,312 | — | — |
| Aoba, Sendai, Miyagi | 30 | 6,972 | ¥8,500 | N=71 |
| Kanazawa, Ishikawa | 23 | 6,018 | ¥7,900 | N=115 |
| Naka, Hiroshima | 25 | 6,352 | ¥8,000 | N=62 |
Source: Compiled by the HotelBank Editorial Team from MetroEngines Research (estimated settled ADR is the June 2026 final figure. “Properties in ADR calculation” is the number of estimation-target properties in each area. Urayasu and Narita are not shown because their estimation-target counts, at N=29 each, are the lowest in the table and cannot be compared on the same footing as the other cities)
Overlaying price levels reveals differences in the character of the receiving capacity. Between central Tokyo (Minato at ¥15,000, Chuo at ¥15,700) and Chuo Osaka (¥9,300) or Naka Nagoya (¥8,300), estimated settled ADR differs by a factor of 1.6 to 1.9. Even among “towns that have large-format properties,” the room for negotiating group rates and the design of the group-versus-individual mix are entirely different problems. Cities such as Kanazawa (¥7,900) and Naka Ward, Hiroshima (¥8,000), where the cluster is mid-sized but the price band is moderate, are well positioned to be built into an itinerary as a mid-trip overnight stop.
Gateway areas as a second layer of capacity
The geography of large-format properties includes clusters formed by a logic different from that of city centers: the areas around airport and port gateways.
Narita in Chiba has 16 properties and 7,312 rooms. Given the city’s population, that is an outsized density of large-format supply, and the location is entirely defined by international connecting demand. Within the same prefecture, Urayasu has 19 properties and 9,843 rooms, and Mihama Ward (Makuhari) has 6 properties and 3,396 rooms — large facilities tied to theme parks and exhibition halls. Chiba’s prefecture-wide total of 28 properties and 17,778 rooms at 300+ rooms owes much to the contribution of these three areas.
In the Kansai region, Konohana Ward, Osaka has 6 properties and 3,015 rooms, and Yodogawa Ward has 21 properties and 6,051 rooms — the former large bayside facilities, the latter defined by its Shin-Osaka Station connection. In Central Japan, as symbolized by Toyoko Inn Chubu International Airport No. 1 (1,001 rooms), substantial lodging capacity has also been placed around Centrair.
From the standpoint of group itineraries, these gateway locations function as capacity for the first and last nights. Even when downtown large-format properties are full, it is not unusual to be able to secure 60 to 100 rooms together near an airport. Conversely, for operators holding these areas, the ramp-up in a group-recovery phase may come early.
The distribution of Chinese-language reviews — how far do capacity and track record overlap?
Having looked at the geography of supply, let us confirm where Chinese-speaking guests have actually stayed in volume to date. Among the guest reviews compiled by the HotelBank Editorial Team (most recent 24 months), we calculated the share of posts written in Simplified Chinese and Traditional Chinese by prefecture.
Source: HotelBank Editorial Team research (most recent 24 months; shares calculated against all-language posts as the denominator / Tokyo N=462,957 posts, Osaka N=228,598, Hokkaido N=222,927, Kyoto N=159,051, Chiba N=131,306, Fukuoka N=116,168, Okinawa N=103,429, Aichi N=97,907)
Simplified Chinese posts were led by Kyoto at 1.75%, Okinawa at 1.53%, Fukuoka at 1.46%, and Osaka at 1.45%, while Tokyo stood at 1.21% and Chiba at 0.67%. Traditional Chinese posts stand out in Okinawa at 8.98%, Fukuoka at 6.45%, and Hokkaido at 4.58% — geographic proximity reflected directly in the numbers.
Two caveats matter here: the language of a post reflects the writer’s working language, not nationality, and mention share is a separate thing from evaluation scores. These figures should be read only as a rough proxy for which areas have a track record of hosting Chinese-speaking guests.
Even so, there are implications. Fukuoka ranks fourth nationally in large-format stock (29,646 rooms) and also shows a high track record with Chinese-speaking guests in both Simplified and Traditional Chinese. It is one of the few areas where capacity and track record overlap, and can be expected to respond quickly in a group-recovery phase (how Fukuoka’s room supply builds from here is set out in Fukuoka Hotel Supply 2026-2028). Hokkaido likewise combines thick stock of 44,371 rooms with a track record of 4.58% in Traditional Chinese. Chiba, by contrast, ranks fifth nationally in large-format stock yet has the lowest Chinese-language post share — which can be read as headroom not yet pursued.
Arranging capacity and track record on two axes
Crossing the two axes covered so far — large-format room stock (capacity) and Simplified Chinese review share (track record to date) — organizes where each area stands. Only the six prefectures for which both values were confirmed in this article are placed.
| Large-format room stock \ Simplified Chinese share | High (1.50% or more) | Medium (1.20–1.49%) | Low (below 1.20%) |
|---|---|---|---|
| Thick (50,000+ rooms) | — | Tokyo (101,278 rooms / 1.21%) Osaka (58,348 rooms / 1.45%) | — |
| Medium (20,000–50,000 rooms) | Okinawa (21,217 rooms / 1.53%) | Fukuoka (29,646 rooms / 1.46%) | Chiba (26,800 rooms / 0.67%) |
| Thin (below 20,000 rooms) | Kyoto (18,190 rooms / 1.75%) | — | — |
Source: Compiled from MetroEngines Research (large-format stock) and HotelBank Editorial Team research (Simplified Chinese review share, most recent 24 months) / Hokkaido and Aichi are not placed because their Simplified Chinese shares were not confirmed in this article
There are three ways to read this. Fukuoka sits in the same position on both axes — medium stock matched by a medium track record, the type where a group recovery translates most directly into a ramp-up. Chiba’s track record is thin relative to its capacity — it holds the fifth-largest stock nationally yet has the lowest Simplified Chinese share among the six prefectures, which reads less as a weakness than as untouched headroom. Kyoto is the reverse, with track record running ahead — its share is the highest while its large-format stock is 18,190 rooms, a structure in which capacity constrains demand. Nara falls outside both axes in this article, but at 1,154 rooms while sitting on the itinerary, it represents an even more acute version of the Kyoto-type constraint.
Where will large-format supply grow next — the pipeline from building plans
Extracting lodging projects of 150 or more rooms from building plan data based on the Ministry of Land, Infrastructure, Transport and Tourism (MLIT) “Building Construction Statistics Survey” identifies 46 projects and 12,962 rooms. By location, Tokyo is the largest at 13 projects and 3,116 rooms, followed by Chiba (3 projects, 1,988 rooms), Hokkaido (7 projects, 1,614 rooms), and Osaka (3 projects, 925 rooms).
Source: Compiled by MetroEngines Research & Consulting from MLIT “Building Construction Statistics Survey” (N=46 projects / 12,962 rooms)
An important note applies here. This data is based on building confirmation applications, and applications are normally filed one to two years before opening. Project counts for 2027 and beyond are therefore certain to rise as further applications are added, and should be read as a floor for the confirmed pipeline as of now. Reading it as “plans dry up from 2028” would be a mistake.
With that premise in place, what can be confirmed is the tendency for newly supplied large-format properties to be built on top of the existing clusters. The four prefectures of Tokyo, Chiba, Hokkaido, and Osaka account for roughly 60% of the total. What can be confirmed in regional areas runs at the level of Okayama (2 projects, 490 rooms), Hiroshima (1 project, 380 rooms), Tochigi (1 project, 300 rooms), and Shizuoka (1 project, 277 rooms) — so it is natural to expect the geographic skew of large-format stock to persist for some time.
Options for thin areas — the ten prefectures with no 300+ room property
Shifting perspective, let us confirm the areas with no large-format capacity at all. The prefectures where not a single property of 300 or more rooms can be confirmed are Mie, Gunma, Aomori, Ibaraki, Gifu, Yamagata, Yamanashi, Saga, Kochi, and Tokushima — ten in all. Each does have between 8 and 27 properties of 150+ rooms, so it is not that they cannot receive groups; but designing to consolidate three or more coaches at a single property is difficult.
There are three directions these areas can take.
First, area-wide booking across multiple properties. Bundling two or three properties in the 150–250 room class within the same area yields capacity equivalent to a single 300-room property. Joint design of dining venues and coach routing, and standardization of rates and cancellation terms, are the practical keys. Frameworks in which a DMO or tourism association takes on the point-of-contact function are already in operation in some areas.
Second, designing to capture the mid-trip night. On the Golden Route, demand for the first and last nights in the major cities is firm and prices are high. Proposing that one mid-trip night be redirected to a regional area lowers the total cost of the itinerary while differentiating the stay experience, which also benefits the travel agency. Cities such as Kanazawa and Naka Ward, Hiroshima, with estimated settled ADR around ¥8,000 and a degree of clustering, are easy to build in within this framing.
Third, designing on the premise that group and FIT coexist. As the first-half 2026 results show, the Chinese market is in a phase where independent and group travel run in parallel. As analyzed in Chinese FIT Shift to High-ADR Hotels, the shrinking group share and the shift to FIT are advancing steadily; rather than targeting groups alone, inventory designed to switch between group blocks and individual sales according to peaks and troughs offers greater revenue opportunity. The 150–250 room class is also a size at which that switching is easy to execute.
Conclusion — the geography of capacity will not change, which is why you can act now
Let us summarize what this article has confirmed.
Japan’s large-format properties (150+ rooms) number 2,274 with 559,477 rooms. They are 8.4% of properties but 44.2% of rooms, and 46.6% is concentrated in the top five prefectures. Among the four prefectures on the reported group itinerary, Tokyo and Osaka have thick stock, while Kyoto stands at 18,190 rooms and Nara at 1,154. At the city level, the four areas of Minato, Chuo Osaka, Chuo Sapporo, and Hakata alone reach 67,146 rooms, and the geography of large-format properties takes the simple form of the urban corridor along the Pacific side of Honshu plus Sapporo, Fukuoka, and Naha. The pipeline visible in building plans — 46 projects and 12,962 rooms — likewise overlaps the existing clusters, and this structure will not change for some time.
The situation around Chinese group travel is fluid, and neither the timing nor the scale of a resumption can be read at this point. But the geography of capacity does not change in a matter of months. That is precisely why what should be done in the current phase is clear. Operators in areas with thick stock should advance inventory design that can switch between group blocks and individual sales, and re-examine their Chinese-language readiness. Operators and DMOs in thin areas should prepare an area-wide booking framework and a “one mid-trip night” proposal package. Neither is preparation that can be started once demand begins to move.
Note on the data: The property and room counts in this article are aggregations based on facilities confirmed to be operating within the scope tracked by MetroEngines Research, and do not constitute a complete census. Properties not listed on major OTAs and similar channels are excluded. Building plan data is based on confirmation applications as of the survey date, and project and room counts are expected to increase as further applications are added. Please treat it as a floor for the confirmed pipeline as of now.
Related reading
- Chinese FIT Shift to High-ADR Hotels: 30% Group Tours → 95%+ FIT
- China-Dependency Proxy: An Inbound ADR Resilience Map
- Did Non-China Inbound Fill China’s -58% Gap? April 2026 Stats & Regional ADR
- Fukuoka Hotel Supply 2026-2028: ~1,000 Rooms/Year in Hakata & Tenjin
- JNTO April -5.5% (3.69M): China -56.8% Yet Regional ADR Rises as 9 Markets Hit Records
References and Sources
■ Data sources
Property and room counts are aggregations of the 27,161 properties and 1,267,037 rooms tracked by MetroEngines Research that are operating and have known room counts (as of August 2026). Estimated settled ADR is the company’s June 2026 final figure, taken as the median at the municipality level. Chinese-language review shares are composition ratios calculated by the HotelBank Editorial Team against posts from the most recent 24 months as the denominator. Building plans are lodging projects of 150 or more rooms extracted from the MLIT “Building Construction Statistics Survey.” Demand-side inbound visitor figures are published values from the Japan National Tourism Organization (JNTO).
■ Calculation assumptions
“Large-format” means 150 or more guest rooms, and “300+ rooms” is a higher tier this article sets as a working convenience; neither is an official definition. The conversion of one coach to roughly 20 rooms and three coaches to roughly 60 rooms is a rough marker drawn from typical group itineraries. National shares and within-prefecture ratios are all room-count based, with the denominator standardized to the same population (operating properties with known room counts). Estimated settled ADR is an estimate derived by applying category-specific adjustment coefficients to the lowest published plan rate; cross-checked against property-level disclosures by listed hotel REITs, the median error is approximately 7%.
■ Limitations and caveats
The population consists of properties listed on major OTAs and similar channels and is not a complete census. Ryokan, minshuku, and simple lodging houses not listed on OTAs, as well as properties whose room counts are unknown, fall outside the aggregation, so actual stock exceeds the figures in this article. Building plan data is based on building confirmation applications, and because applications are normally filed one to two years before opening, counts appear understated the further out the year (a floor for the confirmed pipeline). The language of a review post reflects the writer’s working language rather than nationality, and mention share is a separate thing from evaluation scores, so it should be treated as a rough proxy for stay track record. The status of any resumption of group travel is fluid, and this article takes as its premise only the facts reported as of June 2026.
■ Market data
- MetroEngines Research — room count distribution of operating properties, city-level clustering, estimated settled ADR (June 2026 final figures)
- HotelBank Editorial Team research — composition of guest reviews by posting language (most recent 24 months)
■ Government statistics and public data
- Japan National Tourism Organization (JNTO), “Foreign Visitors to Japan”
- Ministry of Land, Infrastructure, Transport and Tourism, “Building Construction Statistics Survey” (building plan data for lodging facilities)
■ News
- [Exclusive] Chinese group travel to Japan shows signs of resuming amid de facto ban over deteriorating Japan-China relations (Nippon TV NEWS NNN, June 19, 2026 / distribution page no longer public)
- China to resume group travel to Japan; state-owned enterprise begins recruiting (distributed by Kyodo News / Ehime Shimbun Digital, June 19, 2026)
- China resumes recruiting for Japan group tours, then halts them immediately — Taiwanese media (Record China, June 2026)
- June 2026 inbound visitors reach 3.15 million; first-half cumulative total of 21.08 million, down 2.0% year on year (yamatogokoro.jp)