

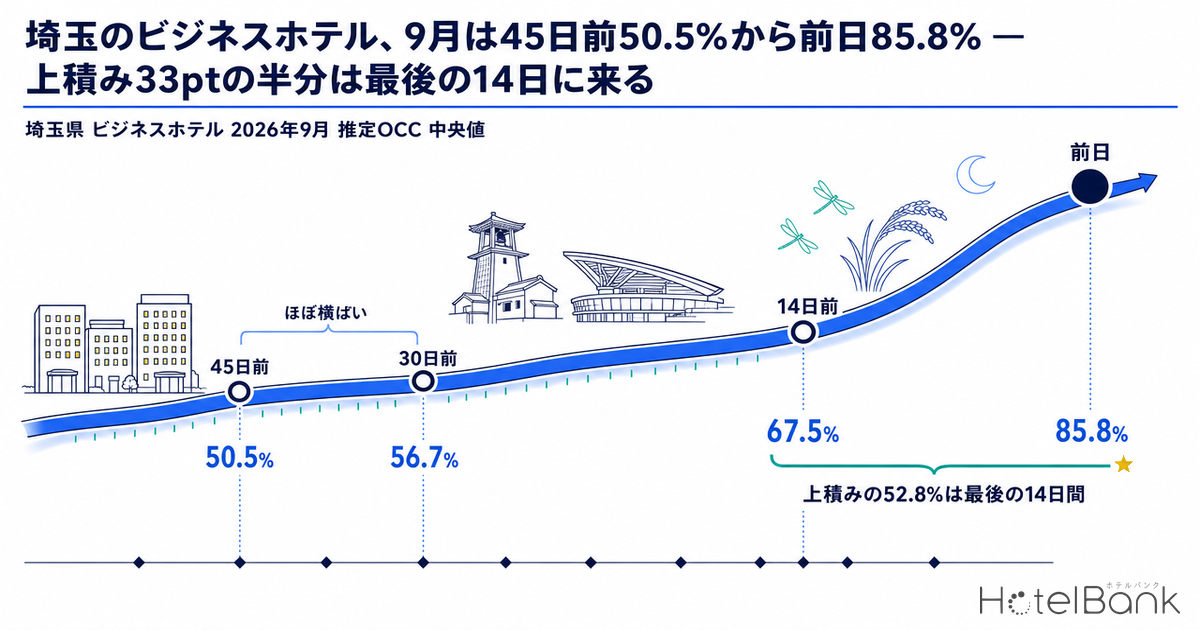
Tracking the booking curves of Saitama business hotels for all 30 stay nights of September 2026, from 45 days before each stay date (T-45) to the day before (T-1), the median estimated OCC (based on OTA-listed inventory) rose from 50.5% at T-45 to 85.8% at T-1. The median gain per night was +33.2pt (minimum +21.9pt, maximum +41.9pt). Slightly more than half of that gain (median 52.8%) was concentrated in the final two weeks, from 14 days out to the day before; at 30 days out the median stood at 56.7%, and the per-night gain from T-45 was a mere +4.8pt (median). Day-of-week differences were large: Sunday nights started and finished low (48.8% at T-45, 73.3% at T-1), while Tuesday nights climbed from 50.2% to 90.2%. Using the 30 observed nights, this article lays out the relationship between the T-45 level and the final pick-up, and offers a yardstick for estimating where a night will land from its T-45 number and how long a hotel can hold off on tightening or loosening rates.
Scope: Saitama Prefecture business hotels, N=59–66 properties (5,740–6,684 rooms; fixed cohort based on listings on major booking sites; property count varies by stay date). Occupancy figures in this article are estimates based on OTA-listed inventory; price levels are not covered. Definitions are at the end of the article. Data as of October 14, 2026.
• Estimated OCC (occupancy) = rooms sold as a share of total rooms in the area (an estimate based on OTA sales inventory). This article builds a fixed cohort of Saitama business hotels that list at least 30% of their total rooms on OTAs and tracks the movement from 45 days before the stay date to the day before. The definition differs from actual room occupancy; because rooms not listed on OTAs are counted as already consumed, it tends to read higher.
• This article does not cover price levels (ADR).
• Source: MetroEngines Research (continuous tracking of public OTA prices for approximately 168,000 properties, of which approximately 27,000 have confirmed occupancy data)
- — 50.5% at T-45 → 85.8% at T-1: median estimated OCC across all 30 nights of September 2026 (N=59–66 properties). Median gain per night +33.2pt (range +21.9 to +41.9pt).
- — 52.8% of the gain comes in the last 14 days: over the 15 days from T-45 to T-30, the per-night median gain was only +4.8pt, so the T-30 number alone is weak grounds for loosening rates.
- — Same 50% at T-45, 17pt apart by day of week: T-1 landing points were 90.2% for Tuesdays and 73.3% for Sundays. Adjust estimates by the day-of-week gain (Tue–Thu +35–38pt, Sun +24pt).
- — The most last-minute market among the four Tokyo-area prefectures: the share of the gain booked from T-14 onward was 52.8% in Saitama, above Tokyo (46.1%), Kanagawa (49.0%) and Chiba (47.3%).
- — Silver Week days 1–2 were already at 73–74% at T-45: by contrast, the last day of the holiday (Sep 23) and Sunday nights stalled at 72–74% at T-1 — late pick-up was not enough to fill them.
T-45, T-30, T-14, T-1 — Half of the Gain Arrives in the Final Two Weeks
First, pooling the 30 nights, let us look at how the median estimated OCC moved by days remaining before the stay date. The T-45 median was 50.5%, with the 30 nights ranging from 45.9% (Sep 1 and Sep 27) to 74.4% (Sep 19). Over the next 15 days to T-30 the median advanced only +4.8pt to 56.7% — movement that can fairly be called “nearly flat.” In the 16 days from T-30 to T-14 it rose +10.1pt to 67.5%, from T-14 to T-7 it rose +6.9pt to 75.3%, and in the final 7 days it rose +10.2pt to 85.8%. This is the classic upward-sloping shape in which daily accumulation speeds up as the stay date approaches. Note that the gain for each interval here is the median of differences calculated night by night, so it does not match the difference between checkpoint medians (e.g., 56.7 − 50.5 = 6.2pt).
| Checkpoint | Median | Min | Max | Gain to T-1 (median) |
|---|---|---|---|---|
| T-45 | 50.5% | 45.9% | 74.4% | +33.2pt(+21.9 to +41.9) |
| T-30 | 56.7% | 49.6% | 83.6% | +27.0pt(+13.3 to +37.7) |
| T-14 | 67.5% | 55.6% | 94.8% | +17.3pt(+0.5 to +24.0) |
| T-7 | 75.3% | 62.1% | 98.3% | +10.2pt(−3.0 to +15.1) |
| T-1 | 85.8% | 71.9% | 96.9% | — |
30 nights of September 2026; estimated OCC (based on OTA-listed inventory). N=59–66 properties. Source: MetroEngines Research; compiled by HotelBank Editorial Team
What deserves attention here is the share of the T-45-to-T-1 gain (median +33.2pt) that was booked between T-14 and T-1. Calculated night by night, the median was 52.8%, and the final 7 days alone accounted for 31.5%. In other words, in September the market standard for Saitama business hotels was to be “only half filled” even two weeks before the stay date. The chart below overlays the median curve for all 30 nights with the median curves for Saturday and Sunday nights, plus the actual curve for the first day of Silver Week (Sep 19), the night that filled earliest.
Booking curves: observations from 45 days before the stay date to the day before. Estimated OCC (based on OTA-listed inventory). N=59–66 properties. Source: MetroEngines Research; compiled by HotelBank Editorial Team
So how much does the T-45 number foretell the landing point? Across the 30 nights, the correlation coefficient between T-45 and T-1 estimated OCC was 0.67 and the regression slope was 0.62 — there is indeed a tendency for a night that is 1pt higher at T-45 to land about 0.6pt higher at T-1. However, looking only at the 18 nights that were in the 45–52% band at T-45, the T-1 landing points were scattered over a range of about 21pt, from 71.9% to 92.8%, with a median of 83.8%. The T-45 level alone narrows the landing point only to a 20pt range, and the keys to narrowing it further are the day of week and the calendar, examined next.
Is this shape unique to Saitama? Comparing the business hotel segments of neighboring Tokyo, Kanagawa and Chiba on the same definition and the same 30 nights of September 2026, the T-45 starting points of all four prefectures fall within the 50–54% band, with no major differences. The differences lie in the landing point and in when the gain arrives. T-1 medians were Tokyo 90.3%, Kanagawa 87.0%, Chiba 86.1% and Saitama 85.8%, and the share of the gain booked from T-14 onward (per-night median) was highest in Saitama at 52.8%, above Tokyo (46.1%), Kanagawa (49.0%) and Chiba (47.3%). Even with a starting point similar to its neighbors, Saitama is a market that closes the distance to its landing point later. The T-1 median for the three non-Silver Week Sunday nights (Sep 6, 13 and 27) was also about 12pt lower in Saitama (73.0%) than in Tokyo (85.2%), making the depth of the Sunday trough stand out in Saitama.
| Prefecture | N (properties) | T-45 | T-30 | T-14 | T-1 | Gain (pt) | Share from T-14 onward |
|---|---|---|---|---|---|---|---|
| Saitama | 59–66 | 50.5 | 56.7 | 67.5 | 85.8 | +33.2 | 52.8% |
| Tokyo | 539–561 | 50.4 | 58.9 | 72.7 | 90.3 | +39.5 | 46.1% |
| Kanagawa | 115–124 | 52.7 | 60.1 | 69.6 | 87.0 | +33.8 | 49.0% |
| Chiba | 85–96 | 54.1 | 61.4 | 70.8 | 86.1 | +30.1 | 47.3% |
30 nights, September 1–30, 2026; estimated OCC (based on OTA-listed inventory). Fixed business hotel cohort for each prefecture (N varies by stay date). Gains and shares are medians of values calculated night by night. Source: MetroEngines Research; compiled by HotelBank Editorial Team
Night-by-Night Build-Up — Silver Week Was Decided by T-45; the Last Holiday Day and Sundays Were the Troughs
Next, lining up the 30 nights one by one, we stack the gains booked in three intervals — T-45→T-30, T-30→T-14 and T-14→T-1 — on top of each night’s T-45 level. September 19 (Sat) to 23 (Wed, Autumnal Equinox Day) formed a five-day holiday, with September 22 a “citizens’ holiday.” The entry night, Sep 19 (Sat), had already reached 74.4% at T-45, 83.6% at T-30 and 93.4% at T-14, landing at 96.9% at T-1. The next night, Sep 20 (Sun), went from 73.4% at T-45 to 95.3% at T-1; Sep 21 (Mon) from 63.5% to 91.9%; and Sep 22 (Tue) from 57.1% to 92.6% — all four holiday nights topped 90% at T-1. Sep 19 and Sep 20 in particular started out at 73–74% at T-45, more than 10pt above the highest non-holiday night (Sep 12 at 63.1%), so it is fair to say they were “decided by T-45.” Sep 20 and Sep 21 dipped slightly between T-7 (98.3% and 92.7%) and T-1, which reads as listed inventory returning after last-minute cancellations. In addition, the estimated share of properties with no listed inventory on Sep 19 was 58.1% at T-1 (N=62 properties), down from a peak of 71.0% at T-4, suggesting some properties put inventory back on sale at the last minute.
Each night’s T-45 estimated OCC with the gains of the three intervals stacked on top. Estimated OCC (based on OTA-listed inventory). N=59–66 properties. Source: MetroEngines Research; compiled by HotelBank Editorial Team
In contrast were the last day of the holiday and Sunday nights. Sep 23 (Wed, Autumnal Equinox Day), the final day of the holiday with a weekday following, stopped at 46.8% at T-45 and 72.9% at T-1 — the second-lowest landing point of the month. Sunday nights lined up in the 72–74% band at T-1 for all three: Sep 6 at 73.6%, Sep 13 at 73.0% and Sep 27 at 71.9%. Midweek nights, meanwhile, were strong: Sep 16 (Wed) 92.8%, Sep 9 (Wed) 92.0%, Sep 17 (Thu) 91.3%, Sep 15 (Tue) 90.4% and Sep 8 (Tue) 90.2%; including the holiday nights of Sep 21 and 22, seven weekday nights exceeded 90% at T-1. Sep 1 (Tue), at the start of the month, came in at 79.6%, low for a Tuesday — likely not a post-holiday effect but a slow ramp-up of business travel demand at the turn of the month. The checkpoints for all 30 nights are shown below (* = Silver Week; shaded rows = Sunday nights).
| Stay date | T-45 | T-30 | T-14 | T-1 | T-45→T-1 | T-14→T-1 |
|---|---|---|---|---|---|---|
| Sep 1 (Tue) | 45.9 | 49.6 | 55.6 | 79.6 | +33.7 | +24.0 |
| Sep 2 (Wed) | 50.5 | 54.9 | 64.3 | 87.4 | +36.9 | +23.1 |
| Sep 3 (Thu) | 52.7 | 57.9 | 65.9 | 86.6 | +33.9 | +20.7 |
| Sep 4 (Fri) | 53.0 | 56.3 | 64.6 | 81.2 | +28.2 | +16.6 |
| Sep 5 (Sat) | 58.6 | 65.3 | 73.1 | 89.0 | +30.4 | +15.9 |
| Sep 6 (Sun) | 51.4 | 54.6 | 61.0 | 73.6 | +22.2 | +12.6 |
| Sep 7 (Mon) | 49.3 | 54.9 | 64.3 | 83.0 | +33.7 | +18.7 |
| Sep 8 (Tue) | 50.2 | 58.4 | 68.6 | 90.2 | +40.0 | +21.6 |
| Sep 9 (Wed) | 50.6 | 59.1 | 70.1 | 92.0 | +41.4 | +21.9 |
| Sep 10 (Thu) | 49.4 | 57.1 | 68.9 | 87.5 | +38.1 | +18.6 |
| Sep 11 (Fri) | 56.2 | 59.9 | 68.6 | 85.7 | +29.5 | +17.1 |
| Sep 12 (Sat) | 63.1 | 67.8 | 76.7 | 91.2 | +28.1 | +14.5 |
| Sep 13 (Sun) | 46.2 | 49.9 | 58.4 | 73.0 | +26.8 | +14.6 |
| Sep 14 (Mon) | 48.6 | 52.3 | 64.8 | 84.8 | +36.2 | +20.0 |
| Sep 15 (Tue) | 50.4 | 54.2 | 69.8 | 90.4 | +40.0 | +20.6 |
| Sep 16 (Wed) | 50.9 | 55.1 | 70.7 | 92.8 | +41.9 | +22.1 |
| Sep 17 (Thu) | 54.3 | 58.3 | 71.8 | 91.3 | +37.0 | +19.5 |
| Sep 18 (Fri) | 53.8 | 57.2 | 68.3 | 82.6 | +28.8 | +14.3 |
| Sep 19 (Sat)* | 74.4 | 83.6 | 93.4 | 96.9 | +22.5 | +3.5 |
| Sep 20 (Sun)* | 73.4 | 81.8 | 94.8 | 95.3 | +21.9 | +0.5 |
| Sep 21 (Mon)* | 63.5 | 73.0 | 87.4 | 91.9 | +28.4 | +4.5 |
| Sep 22 (Tue)* | 57.1 | 63.4 | 76.4 | 92.6 | +35.5 | +16.2 |
| Sep 23 (Wed)* | 46.8 | 50.8 | 58.5 | 72.9 | +26.1 | +14.4 |
| Sep 24 (Thu) | 47.4 | 52.1 | 62.6 | 80.1 | +32.7 | +17.5 |
| Sep 25 (Fri) | 50.0 | 54.6 | 66.1 | 80.2 | +30.2 | +14.1 |
| Sep 26 (Sat) | 53.2 | 60.0 | 71.1 | 86.0 | +32.8 | +14.9 |
| Sep 27 (Sun) | 45.9 | 50.7 | 59.1 | 71.9 | +26.0 | +12.8 |
| Sep 28 (Mon) | 48.4 | 53.8 | 64.3 | 82.8 | +34.4 | +18.5 |
| Sep 29 (Tue) | 48.1 | 59.3 | 66.8 | 84.5 | +36.4 | +17.7 |
| Sep 30 (Wed) | 46.7 | 54.1 | 64.0 | 85.1 | +38.4 | +21.1 |
Estimated OCC (based on OTA-listed inventory, %). N=59–66 properties. Source: MetroEngines Research; compiled by HotelBank Editorial Team
By Day of Week — Nearly Level at T-45, but T-1 Landing Points Spread 17pt Apart
Recomputing medians by day of week, the T-45 levels were nearly level — Monday 49.0%, Tuesday 50.2%, Wednesday 50.5%, Thursday 51.0%, Friday 53.4% and Sunday 48.8% — with only Saturday a head above at 60.9%. Yet the T-1 landing points spread by up to nearly 17pt: Tuesday 90.2%, Saturday 90.1%, Wednesday 87.4%, Thursday 87.0%, Monday 83.9%, Friday 81.9% and Sunday 73.3%. In terms of gain from T-45, midweek nights were largest — Wednesday +38.4pt, Tuesday +36.4pt, Thursday +35.4pt — followed by Friday +29.1pt, Saturday +29.2pt and Sunday +24.1pt. Saturdays start early but gain less in the final stretch than weekdays, while Sundays have both the lowest starting point and the smallest gain.
Median estimated OCC at each checkpoint by day of week (all 30 nights, including Silver Week). Estimated OCC (based on OTA-listed inventory). N=59–66 properties. Source: MetroEngines Research; compiled by HotelBank Editorial Team
| Day of week (nights) | T-45 | T-30 | T-14 | T-1 | Gain |
|---|---|---|---|---|---|
| Monday (4 nights) | 49.0 | 54.3 | 64.5 | 83.9 | +34.0 |
| Tuesday (5 nights) | 50.2 | 58.4 | 68.6 | 90.2 | +36.4 |
| Wednesday (5 nights) | 50.5 | 54.9 | 64.3 | 87.4 | +38.4 |
| Thursday (4 nights) | 51.0 | 57.5 | 67.4 | 87.0 | +35.4 |
| Friday (4 nights) | 53.4 | 56.8 | 67.2 | 81.9 | +29.1 |
| Saturday (4 nights) | 60.9 | 66.5 | 74.9 | 90.1 | +29.2 |
| Sunday (4 nights) | 48.8 | 52.7 | 60.0 | 73.3 | +24.1 |
Median for each day of week (%; gain in pt). Estimated OCC (based on OTA-listed inventory). N=59–66 properties. Source: MetroEngines Research; compiled by HotelBank Editorial Team
Even recalculating without the five Silver Week nights, Sunday nights came to 46.2% at T-45, 73.0% at T-1 and a gain of +26.0pt, so the gap with midweek nights (Tuesday +38.2pt, Wednesday +39.9pt) does not change. Put differently, two nights that look alike at T-45 — “Tuesday and Sunday both around 50%” — typically land at around 90% and around 73% respectively in this market in September. When estimating the landing point from a T-45 number, it has to be translated using the gain for each day of week. Our analysis of Saitama business hotels’ day-of-week occupancy — the “Saturday spike plus weekday plateau” and the Sunday–Monday double trough, which compares nights at the same lead time, also supports this adjustment.
For Revenue Managers Running Business Hotels in Saitama — Implications and Action Plan
Operational insights
1. Compare your T-45 booking rate with the market at “50%, adjusted for day of week.” In September the market started at a median of 50.5% at T-45: 49–51% for Monday through Thursday, 53.4% for Friday, 60.9% for Saturday and 48.8% for Sunday. Setting your own T-45 booking rate against these day-of-week starting points lets you judge whether a night is ahead of or behind the market before you move price.
2. Build landing-point estimates as “T-45 level + day-of-week gain.” Market gains were +35–38pt for Tuesday through Thursday, +29pt for Friday and Saturday, and +24pt for Sunday (all medians). A Tuesday night at 50% at T-45 typically lands around 86% at T-1 in the market, and a Sunday night at the same 50% around 74%; only nights where your actual results fall well below this estimate need action.
3. Being “behind” at T-30 is usually not yet being behind. The market moved only +4.8pt in the 15 days from T-45 to T-30, and slightly more than half the gain (median 52.8%) came from T-14 onward. Even if your numbers look low at T-30, the standard is for the market to add another +27.0pt afterward (+17.3pt of it within 14 days); loosening rates at this stage means taking the final two weeks of demand at a lower price.
4. Sunday nights and the last day of a holiday do not fill with late pick-up. All three Sunday nights landed at 72–74% at T-1 and the final holiday night, Sep 23, at 72.9%, with gains from T-14 of only +12.6–14.6pt. Because the “it will fill at the last minute” assumption does not hold for these nights, there is room to consider, early on, designs that capture multi-night stays or nearby weekday demand.
Action plan (with timeline)
| Timing | Action | Decision trigger (figures from this article) | Aim |
|---|---|---|---|
| T-45 | Check day-of-week starting points | Flag nights where your T-45 booking rate is well below about 50% on weekdays, about 61% on Saturdays or about 49% on Sundays | Confirm whether you are “in line with the market” before touching price |
| T-45 | Early check of holiday and event nights | Nights where the market is already high, as with Silver Week (74% at T-45), and your hotel is not keeping pace | Avoid selling out early-filling nights cheaply too early |
| T-30 | Formalize the “wait” decision | If your hotel is roughly level with the market T-30 median of 56.7% (+4.8pt from T-45), hold price | Take the +17.3pt gain that arrives within 14 days at the right price |
| T-30 | Separate design for Sundays and final holiday nights | Nights of the type that stall at 72–74% at T-1 (Sundays, Sep 23 type) | Consider lifting them with multi-night conditions or nearby demand |
| T-14 | Re-estimate landing points | Against the market T-14 median of 67.5%, nights unlikely to reach your day-of-week estimate (87–90% at T-1 for Tue–Thu) | Focus final-two-week actions night by night |
| T-7 to T-1 | Monitor inventory returning at the last minute | Nights where market estimated OCC falls between T-7 and T-1, as on Sep 20 and 21 | Keep selling capacity for the final 7 days, anticipating cancellations coming back |
Compiled by HotelBank Editorial Team from the figures in this article. Results are not guaranteed.
Summary — Three Yardsticks for Reading Your T-45 Number
In September 2026, Saitama business hotels filled in the shape of 50.5% at T-45, 56.7% at T-30, 67.5% at T-14 and 85.8% at T-1 (all medians), with slightly more than half of the +33.2pt gain arriving in the last 14 days. Three reusable yardsticks follow. First, around 50% at T-45 is not “behind” but the average starting point for September. Second, movement up to T-30 is typically only about +5pt, so the number at that point is weak grounds for loosening rates. Third, even with the same 50% at T-45, landing points spread 17pt by day of week — 90% for Tuesday versus 73% for Sunday — so estimates must apply the day-of-week gain. Nights that exceed 70% at T-45, like Silver Week, can be identified early as exceptions, and nights that late pick-up cannot fill, like Sundays and the final day of a holiday, should be designed separately. Applying these three points to your own curves for the coming months makes it possible to sort “nights to wait on” from “nights to act on” by the numbers. The framework of running booking curves on three checkpoints — T-45, T-30 and the final days — is set out in Booking curves need only three checkpoints — an operating framework from measured data in Okayama.
About the Data
| Item | Details |
|---|---|
| Estimated OCC definition | Occupancy based on OTA-listed inventory = 100 − 100 × OTA-listed rooms remaining ÷ total rooms. Covers a fixed cohort of properties listing at least 30% of total rooms on OTAs (the same set of properties for each stay date; the property count is that set). This is an estimate based on the depletion of inventory sold on OTAs and differs in definition from actual room occupancy (it reads higher because rooms not listed are counted as consumed). |
| Booking curve | Based on observations from 45 days before the stay date to the most recent. Checkpoints are T-45, T-30, T-14, T-7 and T-1 (observations on the stay date itself are not used). |
| Estimated settled ADR definition | This article does not cover price levels. For reference, HotelBank’s estimated settled ADR is an estimate of the transacted price level (tax-exclusive equivalent) derived from OTA and other sales data (lowest-plan level × segment coefficient, ensemble of multiple channels); past months are final values and current/future months are estimates based on current sales. Median error against published operating results is 6.6%. |
| Scope | Saitama Prefecture, business hotel segment; all 30 nights from September 1 to 30, 2026. Fixed cohort N=59–66 properties / 5,740–6,684 rooms (based on listings on major booking sites; 59 properties / 5,740 rooms for Sep 1–3, 66 properties / 6,684 rooms for Sep 27–30). Medians, minimums and maximums are calculated from the values of the 30 nights at each checkpoint. Day-of-week figures are medians of 4–5 nights per day. |
| Data as of | Data as of October 14, 2026. Sales status and inventory change daily, so the figures in this article are a snapshot at the time of retrieval. |
Source: MetroEngines Research; compiled by HotelBank Editorial Team
References and Sources
■ Data source
Booking-curve aggregation by MetroEngines Research (continuous tracking of public OTA prices and listed inventory for approximately 168,000 properties). For the business hotel segments of Saitama, Tokyo, Kanagawa and Chiba, a fixed cohort of properties listing at least 30% of total rooms on OTAs is built for each stay date (Saitama N=59–66 properties / 5,740–6,684 rooms). Data as of October 14, 2026.
■ Calculation assumptions
Estimated OCC = 100 − 100 × OTA-listed rooms remaining ÷ total rooms. Checkpoints are T-45, T-30, T-14, T-7 and T-1; observations on the stay date and beyond 45 days are not used. Interval gains and the share from T-14 onward are medians of values calculated night by night; day-of-week figures are medians of 4–5 nights per day. The T-45 vs. T-1 relationship is a simple regression over 30 nights (correlation 0.67, slope 0.62). Price levels are not covered.
■ Limitations and caveats
Estimated OCC is an estimate based on OTA-listed inventory and reads higher than actual room occupancy because rooms not listed are counted as consumed. Some nights decline due to last-minute cancellations or inventory being returned. Observations cover only one month (30 nights) of September 2026 and include calendar effects such as Silver Week. Day-of-week figures are medians of 4–5 nights and are sensitive to a single outlier night.
Cabinet Office, “About National Holidays” (in 2026, Autumnal Equinox Day is September 23 and September 22 is a citizens’ holiday): https://www8.cao.go.jp/chosei/shukujitsu/gaiyou.html