

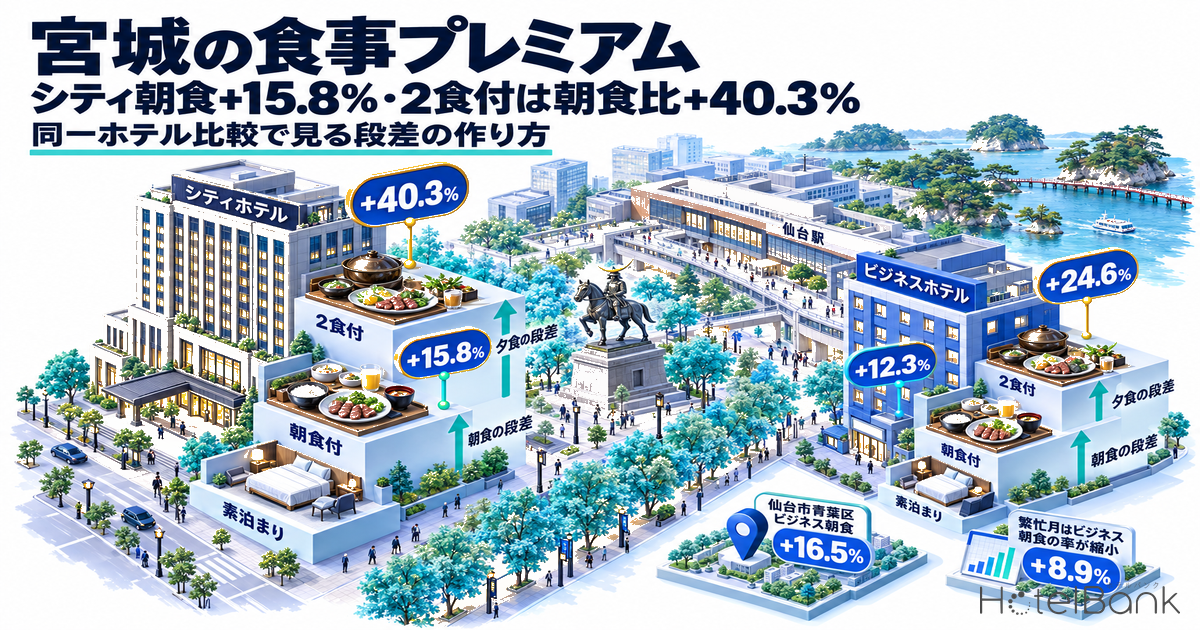
Comparing the room-only and breakfast-included plans that the same hotel sells for the same stay date in Miyagi Prefecture, the breakfast markup for September 2026 stays was +15.8% (N=17) at city hotels and +12.3% (N=78) at business hotels. The step from breakfast-included to two-meal (breakfast and dinner) plans was +40.3% (N=9) at city hotels and +24.6% (N=29) at business hotels. The business-hotel breakfast step ranks 13th highest among Japan’s 47 prefectures, and narrowing the view to Aoba Ward in Sendai widens it to +16.5% (N=34). Ahead of autumn–winter rate and plan revisions, this article lays out how Miyagi’s “meal steps” are structured and turns them into a yardstick for reviewing your own property’s step design.
Scope: city hotels and business hotels in Miyagi Prefecture (meal premiums cover only properties that sell both meal types within the same hotel; city N=17, business N=78 for breakfast-included vs room-only. Estimated settled ADR: city N=21, business N=142 for August 2026). The price metric in this article is the estimated settled ADR (the settled price level estimated from OTA and other sales data, tax-exclusive equivalent); occupancy is an estimate based on OTA-listed inventory. Both are defined at the end of the article. Data as of September 29, 2026.
- — The breakfast step (September 2026 stays) is +15.8% for city hotels (N=17) and +12.3% for business hotels (N=78). In a same-hotel, same-stay-date paired comparison, the gap between segments is only 3.5 points.
- — Two-meal vs breakfast-included is +40.3% for city hotels (N=9) and +24.6% for business hotels (N=29). Dinner pricing widens the segment gap to 15.7 points, and the level held nearly constant from May through September 2026.
- — The +12.3% business-hotel breakfast step exceeds the national median of +10.0% and ranks 13th of 47 prefectures. Limited to Aoba Ward in Sendai, it widens to +16.5% (N=34).
- — In the peak month of August 2026, the business-hotel breakfast step narrowed to +8.9% (N=79, difference ¥1,499). Holding the yen markup flat while room-only rates rise makes the percentage shrink.
- — Estimated settled ADR (August 2026) was ¥8,642 for business hotels (+6.5% YoY, N=142) and ¥10,903 for city hotels (+7.7% YoY, N=21). When revising room rates, review the meal-step table at the same time.
Miyagi Meal Premiums Compared Within the Same Hotel (September 2026)
If meal premiums are measured by averaging room-only and breakfast-included rates separately for each hotel group and then comparing them, a difference in property mix creeps in: breakfast-included plans tend to be sold by higher-grade properties. This article aggregates only the difference between room-only and breakfast-included within the same hotel. In other words, it pairs only cases where the same hotel sells both plans for the same stay date, so the difference directly reflects “the value of the meal.” Ryokan are excluded, since they are typically sold on a one-night, two-meal basis and pairs with room-only plans rarely form.
The results for September 2026 stays are shown in the chart and table below. The breakfast step is +15.8% for city hotels and +12.3% for business hotels, a gap of only 3.5 points between segments. The step from breakfast-included to two-meal plans, however, is +40.3% for city hotels versus +24.6% for business hotels, a gap that widens to 15.7 points. How dinner is priced is where the difference between segments shows most clearly.
Source: MetroEngines Research, compiled by the HotelBank Editorial Team
| Comparison pair (Sep 2026) | City markup | City difference | City N= | Business markup | Business difference | Business N= |
|---|---|---|---|---|---|---|
| Breakfast-included vs room-only | +15.8% | ¥3,059 | 17 | +12.3% | ¥1,941 | 78 |
| Two-meal vs breakfast-included | +40.3% | ¥10,409 | 9 | +24.6% | ¥4,100 | 29 |
| Two-meal vs room-only | +65.9% | ¥14,393 | 9 | +34.3% | ¥5,295 | 29 |
| Dinner-included vs room-only | +102.4% | ¥20,849 | 5 | +30.4% | ¥4,853 | 6 |
Source: MetroEngines Research, compiled by the HotelBank Editorial Team (differences are the gap in selling rates within the same hotel for the same stay date, shown per room for two guests. N= is the number of properties with a valid pair selling both plans. Because the set of properties differs by pair, differences in different rows cannot be added together.)
Converted to a per-person basis, the breakfast markup is roughly ¥1,500 at city hotels and roughly ¥1,000 at business hotels. The dinner markup for moving up to a two-meal plan is roughly ¥5,200 per person at city hotels and roughly ¥2,100 at business hotels. This suggests that many business hotels build dinner at the price point of an “affordable set meal or bento,” while city hotels layer on restaurant dinners priced closer to a course meal. Dinner-included (no breakfast) pairs are few — city N=5, business N=6 — so this article treats them as reference values only.
Monthly Trend in the Breakfast Step — Only August Sees the Percentage Shrink
Lining up the same paired comparison for stay months May through September 2026, the city-hotel breakfast step ranged from +14.1% to +15.8% and the business-hotel step from +8.9% to +13.4%. What stands out is August for business hotels, when the markup shrank to +8.9% (N=79). In yen terms the difference was ¥1,500, also smaller than the ¥1,800–¥1,900 range seen in other months.
In August 2026, estimated OCC (based on OTA-listed inventory) for business hotels in Miyagi Prefecture averaged a high 92.3% for the month (the modal count within the month was 58 properties / 8,464 rooms, based on listings on major booking sites), and room-only rates themselves were pushed up. When many properties hold their breakfast markup flat (or even compress it) while room-only rates rise, the percentage naturally shrinks. City hotels, by contrast, stayed nearly flat in August on both rate and yen, at +14.1% and a ¥2,900 difference. Whether to fix the breakfast step “in yen” or link it “as a percentage” in peak months appears to be handled differently depending on the segment.
Source: MetroEngines Research, compiled by the HotelBank Editorial Team
| Stay month (2026) | City breakfast markup | City difference | N= | Business breakfast markup | Business difference | N= |
|---|---|---|---|---|---|---|
| May | +14.3% | ¥2,747 | 17 | +13.0% | ¥1,920 | 79 |
| June | +15.5% | ¥2,777 | 17 | +13.4% | ¥1,884 | 81 |
| July | +15.3% | ¥2,872 | 17 | +12.3% | ¥1,837 | 80 |
| August | +14.1% | ¥2,896 | 17 | +8.9% | ¥1,499 | 79 |
| September | +15.8% | ¥3,059 | 17 | +12.3% | ¥1,941 | 78 |
Source: MetroEngines Research, compiled by the HotelBank Editorial Team (same-hotel paired comparison; differences are per room for two guests)
The step from breakfast-included to two-meal plans also barely moves from month to month. City hotels were +41.4% in May, +44.8% in June, +43.3% in July, +40.5% in August and +40.3% in September (N=9 each month); business hotels were +27.5% in May (N=30), +26.0% in June (N=30), +25.5% in July (N=29), +24.0% in August (N=29) and +24.6% in September (N=29). This indicates that the dinner markup is, in many cases, run as a fixed price schedule rather than adjusted by season.
Where Miyagi Stands Nationally and Within Sendai
Ranking all 47 prefectures for September 2026 with the same method (only prefectures with N=5 or more valid pairs), the median business-hotel breakfast step is +10.0% (47 prefectures), and Miyagi’s +12.3% ranks 13th. For city hotels the median is +15.45% (44 prefectures), and Miyagi’s +15.8% ranks 21st — almost exactly the middle of the country. Miyagi is a market where business hotels are able to charge a relatively high breakfast markup. For how the breakfast step varies by prefecture in Japan’s 10 major markets, see our same-hotel comparison of business-hotel breakfast premiums across 10 major prefectures.
| Prefecture (Sep 2026) | Business breakfast markup | N= | City breakfast markup | N= |
|---|---|---|---|---|
| Miyagi | +12.3% | 78 | +15.8% | 17 |
| Tokyo | +11.3% | 358 | +16.6% | 65 |
| Osaka | +11.3% | 162 | +16.8% | 57 |
| Hokkaido | +10.0% | 194 | +18.0% | 50 |
| Hiroshima | +10.0% | 65 | +15.4% | 22 |
| Fukuoka | +8.0% | 145 | +16.2% | 30 |
| Fukushima | +9.2% | 55 | +20.0% | 11 |
| Iwate | +8.9% | 39 | +15.4% | 12 |
| Yamagata | +8.2% | 34 | +17.0% | 8 |
Source: MetroEngines Research, compiled by the HotelBank Editorial Team (same-hotel paired comparison of breakfast-included vs room-only)
Splitting the prefecture further by municipality (N=5 or more valid pairs), the September 2026 breakfast step was +16.5% for business hotels in Aoba Ward, Sendai (N=34, difference ¥2,700), +15.2% for business hotels in Miyagino Ward (N=10, difference ¥2,600) and +25.2% for city hotels in Aoba Ward (N=6, difference ¥4,900). Central Sendai carries a larger step than the prefecture-wide business figure of +12.3%, showing that the room for a breakfast markup varies substantially by location. Even within Miyagi, the appropriate benchmark differs between the Sendai Station and Kokubuncho area and suburban or coastal locations.
The Foundation: Estimated Settled ADR Levels (City and Business)
Meal steps sit on top of the room-rate foundation. By estimated settled ADR, business hotels in Miyagi Prefecture beat the prior-year month in every finalized month from January to August 2026 (e.g., August ¥8,600, +6.5% YoY, N=142). City hotels fell below the prior year in June (−3.7%) and July (−11.5%) out of January–August, but rose above the prior year in August at ¥10,900 (+7.7% YoY, N=21). On a simple January–August average, business hotels were ¥7,700 (prior year ¥7,000) and city hotels ¥9,700 (prior year ¥8,800). City and business hotels moved in opposite directions in July, with city hotels down −11.5% and business hotels up +8.5% year on year.
Source: MetroEngines Research, compiled by the HotelBank Editorial Team (solid lines = finalized values; dotted lines from September 2026 = estimates based on current sales status)
| Stay month | Business 2026 | Business 2025 | YoY | City 2026 | City 2025 | YoY |
|---|---|---|---|---|---|---|
| January | ¥7,601 | ¥6,111 | +24.4% | ¥11,362 | ¥7,618 | +49.1% |
| February | ¥7,267 | ¥6,646 | +9.3% | ¥8,758 | ¥8,032 | +9.0% |
| March | ¥7,211 | ¥6,482 | +11.2% | ¥8,919 | ¥7,968 | +11.9% |
| April | ¥7,564 | ¥6,973 | +8.5% | ¥9,459 | ¥8,503 | +11.2% |
| May | ¥8,027 | ¥7,454 | +7.7% | ¥10,648 | ¥9,237 | +15.3% |
| June | ¥7,107 | ¥6,990 | +1.7% | ¥8,312 | ¥8,632 | −3.7% |
| July | ¥7,952 | ¥7,331 | +8.5% | ¥9,303 | ¥10,517 | −11.5% |
| August | ¥8,642 | ¥8,116 | +6.5% | ¥10,903 | ¥10,120 | +7.7% |
| September (est.) | ¥10,182 | ¥7,288 | — | ¥12,299 | ¥8,720 | — |
| October (est.) | ¥10,938 | ¥7,130 | — | ¥13,314 | ¥9,342 | — |
| November (est.) | ¥10,489 | ¥8,148 | — | ¥12,807 | ¥9,955 | — |
| December (est.) | ¥10,234 | ¥6,873 | — | ¥11,476 | ¥8,902 | — |
Source: MetroEngines Research, compiled by the HotelBank Editorial Team (N=: business 2025 139–143, 2026 Jan–Aug 139–142, 2026 Sep–Dec 135–137; city 2025 20, 2026 20–21. Values from September 2026 onward are estimates based on current sales status and may change. Wait for month-end finalization before comparing directly with finalized values.)
September–December 2026 values are estimates based on current sales status: ¥10,200–¥10,900 for business hotels (N=135–137) and ¥11,500–¥13,300 for city hotels (N=21). Because they are calculated on a different basis from the prior-year finalized values, year-on-year judgments should wait until each month is finalized. Still, the fact that the room-rate foundation for autumn and winter moves month by month bears directly on the decision discussed in the next section: whether to hold the breakfast step in yen or as a percentage.
For Revenue Managers Running City and Business Hotels in Miyagi — Implications and Action Plan
1. Know “the middle of the market” before setting the breakfast step. The breakfast step for business hotels in Miyagi is +12.3% (N=78), and +16.5% (N=34) in Aoba Ward, Sendai. Lining up your own room-only and breakfast-included rates for the same dates and checking where you fall in this band shows whether your breakfast pricing is conservative or ahead of the market for your location. For a suburban location the prefecture average is the natural yardstick; for central Sendai, the Aoba Ward figure.
2. The percentage tends to shrink in peak months. In August, the business-hotel breakfast step narrowed to +8.9% (difference ¥1,500). Holding the breakfast markup flat while raising room-only rates makes breakfast-included plans look relatively cheap and tends to skew bookings toward them. The less headroom a property has in breakfast cost and serving capacity (seats and turnover), the more it should consider a design that links the step to the room-only rate as a percentage on peak dates.
3. Two-meal plans follow different logic by segment. The step from breakfast-included to two-meal plans is +40.3% for city hotels (N=9) and +24.6% for business hotels (N=29), with little movement from month to month. Rather than being adjusted by season, the dinner markup appears to be set by the “product type” — course-style versus set-meal-style. Which type your dinner is closer to determines which step you should benchmark against.
4. Recheck the steps precisely when the base ADR moves. In estimated settled ADR, business hotels beat the prior year in every finalized month from January to August 2026, and current estimates point to a ¥10,000-plus level in autumn and winter. If meal steps are left untouched when room rates are revised, the result can be the same as an unintended price cut on breakfast-included plans.
| Timing | Action | Decision trigger (figures from this article) | Aim |
|---|---|---|---|
| This week | List the rate difference between room-only and breakfast-included for dates on sale in October–December | If dates keep falling well below the prefecture +12.3% / Aoba Ward +16.5% (business) or the prefecture +15.8% (city) | Identify breakfast steps that are set too low |
| This week | Check your per-person breakfast markup against the market guide (about ¥1,000 for business, about ¥1,500 for city) | If your markup is below the market guide relative to your breakfast’s content and cost | Confirm room to price breakfast in line with its value |
| Within 2 weeks | Prepare a rule for peak dates that grows the breakfast markup in line with the room-only rate | If your property also has months or dates where the step shrinks to around +8.9%, as in August | Prevent bookings from skewing to breakfast-included and straining serving capacity |
| Within 2 weeks | Check the dinner portion of your two-meal plan markup against the segment guide | If it deviates significantly from +40.3% (city) / +24.6% (business) vs breakfast-included | Align dinner product type with price |
| Toward next month | Make it standard practice to revise the meal-step table at the same time as autumn–winter room rates | When your autumn–winter settings move relative to the estimated settled ADR ranges of ¥10,182–¥10,938 (business) / ¥11,476–¥13,314 (city) | Prevent room-rate changes from unintentionally breaking the steps |
| Toward next month | Record the sales mix of breakfast-included vs room-only monthly and compare before and after step changes | If the breakfast-included share changes significantly after moving the step toward the market level | Validate the effect of the step design with your own data |
Summary — Three Yardsticks for Measuring Meal Steps
| Yardstick | Miyagi today (Sep 2026) | How to read it |
|---|---|---|
| Breakfast step (percentage) | City +15.8% (N=17) / Business +12.3% (N=78) | Business exceeds the national median of +10.0%. Use different yardsticks by location (Aoba Ward +16.5%) |
| Dinner step (two-meal vs breakfast-included) | City +40.3% (N=9) / Business +24.6% (N=29) | Set by product type rather than season. Benchmark against the segment whose dinner type is closest to yours |
| Shrinking percentage in peak months | Business, August +8.9% (N=79) | Decide in advance whether to revise the breakfast markup when raising room-only rates |
Meal premiums are reviewed less often than room rates, but comparing within the same hotel shows that in Miyagi the steps split clearly by segment and location. Managing room rates and meal steps on a single table at the time of the autumn–winter rate revision is the shortest path to keeping the overall plan structure consistent.
Frequently Asked Questions
Q. At business hotels in Miyagi, how much more expensive is breakfast-included than room-only?
A. In a same-hotel, same-stay-date comparison, September 2026 stays showed +12.3% (N=78), a difference of about ¥1,900 per room for two guests. Limited to Aoba Ward, Sendai, it is +16.5% (N=34).
Q. At city hotels, how much more expensive is a two-meal plan than breakfast-included?
A. For September 2026 stays it was +40.3% (N=9), a difference of about ¥10,400 per room. The markup is larger than the +24.6% (N=29) at business hotels.
Q. Why not compare the averages across all hotels?
A. Hotels that sell breakfast-included plans and hotels that sell only room-only plans differ in guest mix and grade, so a difference between averages mixes in differences in property class. This article aggregates only the within-hotel difference at properties that sell both plans.
About the Data
| Estimated OCC | OTA-listed-inventory-based occupancy = 100 − 100 × OTA-listed remaining rooms ÷ total rooms. Covers properties that list at least 30% of their total rooms on OTAs (the number of properties varies slightly by stay date; property and room counts in the text are the modal values within the month). It is an estimate based on how inventory sold on OTAs is being absorbed and is defined differently from actual room occupancy (rooms not listed are counted as sold, so it runs higher). This article uses it only for business hotels in Miyagi Prefecture in August 2026 (actuals for an elapsed month; 56–58 properties per day, modal value 58 properties / 8,464 rooms). |
|---|---|
| Booking curve | Based on observations from 45 days before the stay date up to the most recent date. |
| Estimated settled ADR | The settled price level (tax-exclusive equivalent) estimated from OTA and other sales data (lowest-plan level × segment-specific coefficient, ensembled across multiple channels). Past months are finalized values; current and future months are estimates based on current sales status. Median error of 6.6% against published operating results. |
| Meal premium | Covering only properties that sell both of the two meal types being compared within the same hotel (e.g., room-only and breakfast-included), the difference in selling rates for the same stay date is aggregated per room for two guests and averaged by stay month and segment. The markup rate is the difference ÷ the base rate. Ryokan are excluded. N= is the number of properties with a valid pair; values with N below 5 are not cited. |
| Coverage N= | Meal premiums (September 2026, Miyagi Prefecture): city — breakfast-included vs room-only 17 properties, two-meal pairs 9, dinner-included pairs 5; business — breakfast-included vs room-only 78 properties, two-meal pairs 29, dinner-included pairs 6. Municipalities: Aoba Ward business 34, city 6; Miyagino Ward business 10. Estimated settled ADR: city 20–21 properties, business 135–143 properties (varies by month; see table notes). |
| Data as of | Data as of September 29, 2026. Sales status and inventory change daily, so the figures in this article are a snapshot at the time of retrieval. |
Source: MetroEngines Research, compiled by the HotelBank Editorial Team
References and Sources
■ Data sources
MetroEngines Research lodging sales data (daily observations of public selling rates and listed inventory on major booking sites), aggregated by the HotelBank Editorial Team. Meal premiums use pairs of city and business hotels in Miyagi Prefecture selling room-only / breakfast-included / two-meal / dinner-included plans for the same stay date (May–September 2026 stays); estimated settled ADR uses monthly series for business and city hotels in Miyagi Prefecture (January 2025–December 2026); estimated OCC uses August 2026 actuals for business hotels in Miyagi Prefecture. Data as of September 29, 2026.
■ Calculation assumptions
All differences and markup rates compare selling rates per room for two guests; the markup rate is the difference ÷ the base rate. Per-person amounts are approximations obtained by dividing the per-room difference by two. N= is the number of properties with a valid pair; values with N below 5 are not cited. Estimated settled ADR is tax-exclusive equivalent; values from September 2026 onward are estimates based on current sales status.
■ Limitations and caveats
Selling rates are not settled prices, and differences in meal content (buffet / set meal, course content) and room type are not adjusted for. Because the set of properties differs by pair, differences in different rows cannot be added together. Ryokan are excluded. Estimated OCC is an OTA-listed-inventory-based estimate defined differently from actual room occupancy, and estimated settled ADR has a median error of 6.6% against published operating results.
Source: MetroEngines Research, compiled by the HotelBank Editorial Team