

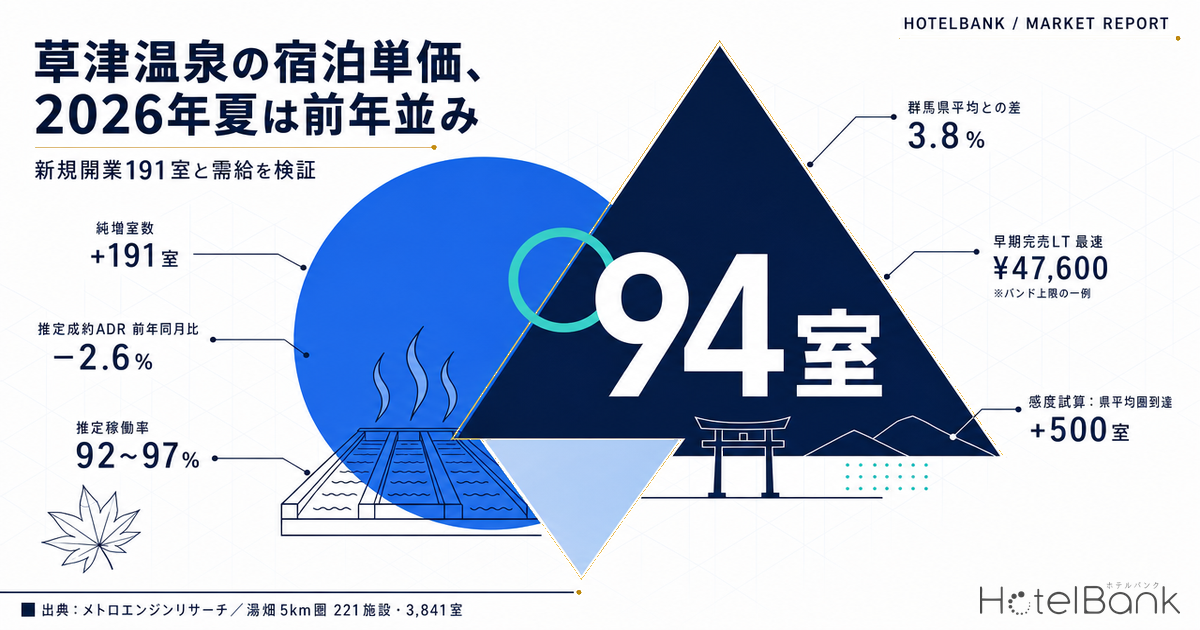
In Kusatsu Onsen, Gunma, two lodging properties with more than 90 rooms each opened between June and July 2026, adding 191 rooms in total. For an onsen town of roughly 6,000 residents, that is an unusual amount of supply to absorb at once. The intuitive expectation is that a sudden supply increase pushes rates down — yet MetroEngines Research data shows Kusatsu Town posted the smallest ADR decline of any major onsen destination in Gunma. This article examines what actually happened in Kusatsu during summer 2026, cross-referencing the true room count added, year-on-year ADR movement, and the speed of inventory sell-through across the 221 properties and 3,841 rooms within a 5km radius of the Yubatake hot spring field.
Metric Definitions Used in This Article
- ADR (Average Daily Rate): An estimated settled rate (tax-excluded equivalent) derived by applying a property-type correction factor to the lowest advertised plan level published on OTAs (double occupancy, per-room rate, tax included). Cross-checking against property-level results disclosed by listed hotel REITs (91 properties, most recent three months) shows a median error of roughly 7%. These are estimates and differ from each property’s actual transacted rates and accounting figures. Area-level ADR is the median of the properties covered (the level of a typical property in that area).
- Advertised price (all-plan average): The average price across all plans published on OTAs (from room-only through half-board). Per-room rate at double occupancy, tax included. This uses a different basis from the ADR above, so the two should not be compared directly.
- OCC (occupancy rate): The share of sold rooms against total rooms in the area (an estimate based on OTA sales inventory).
- LT (lead time): Days remaining until check-in. LT0 = same day. Early sell-out LT = the lead time at which remaining rooms first reached zero (a larger value means it sold out earlier).
- Data source: MetroEngines Research
- — 191 rooms opened, but the net addition is about 94 — 97 of those rooms are a conversion and refurbishment of an existing 100-room property. Against the area’s 2,474 rooms (August 2026, OTA-confirmed active basis), that is an increase of just 3.8%.
- — Kusatsu Town’s estimated settled ADR was -2.6% YoY on the June-July average — the smallest decline among Gunma’s five major onsen destinations, outperforming the prefecture overall (-4.5%) and Shibukawa City (-19.0%).
- — Estimated occupancy ran 92-97% through June to August (estimate based on OTA-listed inventory) — 11 to 15 points above the Gunma average of around 81%, indicating the added inventory was absorbed.
- — It takes roughly 300-500 net rooms to pull occupancy down to the prefectural average — in a sensitivity test holding actual demand fixed, 94 rooms still leaves 92.0%. Only a net addition three to five times larger brings the area into the Gunma-average band (around 81%).
- — What moved was not the average but the “60+ rooms x above ¥35,000” band — a player entered a price band that had been all but empty, and the competitive environment changed discontinuously in that band alone.
191 New Rooms Opened, but the Net Addition Is 94
Start with the actual supply figures. Two properties with more than 90 rooms opened in the Kusatsu Onsen area in 2026.
| Property | Rooms | Opening | Type | Net addition to area rooms |
|---|---|---|---|---|
| KAI Kusatsu (界 草津) | 94 rooms | June 7, 2026 | New build | +94 rooms |
| B/C HOTEL Kusatsu (B/C HOTEL 草津) | 97 rooms | July 6, 2026 | Refurbishment and conversion of an existing 100-room property | Effectively flat |
| Total | 191 rooms | — | — | approx. +94 rooms |
Source: MetroEngines Research (OTA-listing-confirmed basis) and public disclosures from each property and operator, compiled by the HotelBank Editorial Team. The 94 rooms and June 7, 2026 opening for KAI Kusatsu are confirmed in the operator’s official release. The 97 rooms and July 6, 2026 pre-opening for B/C HOTEL Kusatsu are values that agree across multiple third-party booking sites; the room count and opening date are not explicitly stated on the operator’s official site. The business transfer of the predecessor property (July 31, 2025) is confirmed in the former operator’s public disclosure.
This is the first point to settle. The headline number is 191 rooms, but B/C HOTEL Kusatsu is a fully refurbished reopening of an existing 100-room property transferred in July 2025, and the two locations are effectively identical at the coordinate level. The net addition to the area’s total room stock therefore comes to just 94 rooms.
Compare that against the denominator. As of August 2026, MetroEngines Research confirmed OTA-active inventory in Kusatsu Town of 107 properties and 2,474 rooms. Ninety-four rooms is 3.8% of that. At the level of the area as a whole, this is not the kind of scale that flips supply and demand overnight. How far new supply pushes an area’s ADR down depends on the size of each prefecture’s room stock, as confirmed in our analysis covering all 47 prefectures. Narrow the view to a single price band, however, and the story changes — a point taken up in the positioning analysis further below.
Lodging Supply Map Within 5km of the Yubatake — 221 Properties, 3,841 Rooms
Next, the geographic spread of supply. Within a 5km radius of the Yubatake hot spring field, MetroEngines Research tracks 221 properties totaling 3,841 rooms. Of these, 42 mid- to large-scale properties with 20 or more rooms account for 2,465 rooms, or 64% of the area on a room-count basis. Put the other way round, eight in ten properties have fewer than 20 rooms. Kusatsu Onsen is not a “big hotel town” but a town of many small inns with large properties scattered among them.
Source: MetroEngines Research. Circle size = room count; color = estimated settled ADR band (N=42 properties with 20 or more rooms).
The map shows that most mid- to large-scale properties cluster in the onsen town center within 500m of the Yubatake, with large properties scattered further out on the eastern side toward Beruz no Mori and the ski area. Both of the 2026 openings sit in that central district within walking distance of the Yubatake, so the impact of the added supply is concentrated on the Yubatake walking radius rather than spread across the area as a whole.
Advertised Prices Rose, Estimated Settled ADR Held Flat — the Real Picture of Summer 2026
So how did rates actually move? Tracking Kusatsu Town’s estimated settled ADR monthly, June 2026 came in at roughly ¥14,600 (¥15,400 a year earlier, -5.4% YoY) and July at roughly ¥15,800 (¥15,700 a year earlier, +0.2%). June fell, but July returned to roughly the prior-year level.
Source: MetroEngines Research (Kusatsu Town, estimated settled ADR, N=77-96 properties). Figures from August 2026 onward are estimates based on advertised levels at the time of the survey.
Overlaying the years brings out the shape of Kusatsu’s rate curve. It is a twin-peak structure with clear highs in August and December and troughs in June and April. In 2025, December marked the annual peak at ¥21,300, and the full year ran clearly above 2024. In 2026, rates held above the prior year through May, dipped below it in June, then recovered to roughly the prior-year level in July.
Worth noting is that over the same period the advertised price (all-plan average) moved in the opposite direction. Kusatsu Town’s advertised price was roughly ¥31,500 in June 2026 (¥29,300 a year earlier, +7.6%) and roughly ¥34,200 in July (¥33,500 a year earlier, +2.0%) — both above the prior year. Pricing itself turned more aggressive, while the settled rate estimated from the lowest plan level stayed flat. That gap is the real picture of Kusatsu Onsen in summer 2026.
Source: MetroEngines Research (Kusatsu Town; listed property count is the number of properties for which prices were observable on OTAs).
At the same time, the number of properties with observable OTA prices rose from 126 to 142 in June, from 112 to 146 in July, and from 110 to 142 in August — increases of 12.7%, 30.4% and 29.1% respectively, all above the prior year. Two new openings cannot account for growth of that size; the natural reading is that existing inns simultaneously expanded their OTA listings and released more allocation. Sellers increased, advertised prices went up, and the level at which rooms actually sold settled at roughly the prior year.
Kusatsu Defended Its Rates Best Among Gunma’s Major Onsen Destinations
On its own, -5.4% and then +0.2% is hard to judge as good or bad. So compare it side by side with Gunma’s other major onsen destinations.
| Area (main onsen destination) | June YoY | July YoY | 2-month average | N (July 2026) |
|---|---|---|---|---|
| Kusatsu Town (Kusatsu Onsen) | -5.4% | +0.2% | -2.6% | 92 |
| Minakami Town (Minakami, Sarugakyo, etc.) | -8.3% | +0.2% | -4.1% | 49 |
| Tsumagoi Village (Manza, Kazawa, etc.) | -16.7% | +4.1% | -6.3% | 21 |
| Nakanojo Town (Shima Onsen, etc.) | -5.6% | -10.4% | -8.0% | 36 |
| Shibukawa City (Ikaho Onsen, etc.) | -21.2% | -16.7% | -19.0% | 46 |
| Gunma Prefecture overall | -5.4% | -3.5% | -4.5% | 438 |
Source: MetroEngines Research (year-on-year estimated settled ADR; N = number of properties covered in the July 2026 aggregation).
Source: MetroEngines Research; compiled by the HotelBank Editorial Team.
On the two-month June-July average, Kusatsu Town’s -2.6% is the smallest decline among the five onsen destinations compared, and it also beats Gunma’s -4.5% overall. Rate softening is not something specific to Kusatsu but a movement across the whole prefecture — and within that, the destination that added the most supply is the one that held its rates best. That is the order actually observed.
Behind the prefecture-wide softening are two things: the number of Gunma properties listed on OTAs rose more than 10%, from 696 in July 2025 to 791 in July 2026, and small-scale vacation-rental-style properties have become the center of new openings. Of the 34 lodging properties newly confirmed on OTAs in Gunma in 2026, 22 were vacation rentals and 23 had two rooms or fewer. Adding one- and two-room inventory to the sample works in the direction of moving the area median. This shift toward vacation rentals is not confined to Gunma: nationwide, vacation rentals account for 47% of 2026 openings by property count (for detail, see Japan 2026: 1,242 openings and 33,749 rooms). It is worth holding on to the point that the same “rate decline” means different things in an area where ryokan and hotels dominate the sample, as in Kusatsu Onsen, and in an area such as the Kita-Karuizawa surroundings where vacation rentals are growing sharply.
Occupancy at 92-97% — the Added Supply Is Being Absorbed
Were rates defended because demand absorbed the added supply? Occupancy (estimated, OTA-listed-inventory basis) offers corroborating evidence.
| Coverage | Properties | Rooms covered | Estimated occupancy |
|---|---|---|---|
| Kusatsu Town, June 2026 | 98 | 2,167 rooms | 93.7% |
| Kusatsu Town, July 2026 | 74 | 1,965 rooms | 97.2% |
| Kusatsu Town, August 2026 | 107 | 2,474 rooms | 92.0% |
| Gunma overall, June 2026 | 519 | 18,849 rooms | 80.6% |
| Gunma overall, July 2026 | 475 | 18,348 rooms | 81.8% |
Source: MetroEngines Research. Estimates based on the sell-through of inventory offered on OTAs; these differ from each property’s actual overall occupancy.
Kusatsu Town’s estimated occupancy ran between 92% and 97% from June through August, 11 to 15 points above Gunma overall (around 81%). What matters is that this level did not break across June and July, the months in which the two new properties and their 191 rooms (about 94 rooms on a net area basis) came to market. Inventory put on sale via OTAs was almost entirely absorbed, so the slight rate decline is better read as a combination of compositional change in the sample and advertised increases not fully feeding through to the lowest plan level — rather than as discounting in response to unsold rooms.
Kusatsu Town’s visitor count reached 4,053,223 in fiscal 2025, a record high for the third consecutive year (+0.84% year on year, per the town’s announcement). The underlying visitor base continuing to grow is the foundation on which the added supply was absorbed.
Sensitivity Test — How Many Net Rooms Would It Have Taken to Break Rates?
Everything above describes what actually happened. So how much added supply would it have taken for the market to loosen? Taking the sold rooms observed in Kusatsu Town in August 2026 (N=107 properties) — 2,474 total rooms x 92.0% estimated occupancy (OTA-listed-inventory basis) ≈ 2,276 room-equivalents — as fixed demand, we estimated occupancy under various net room additions on top of pre-opening-equivalent supply of 2,380 rooms. Demand is also varied so the result can be read on both a supply and a demand axis.
| Net rooms added | Total rooms | Demand -10% | Demand -5% | Demand flat | Demand +5% |
|---|---|---|---|---|---|
| ±0 rooms (pre-opening equivalent) | 2,380 rooms | 86.1% | 90.9% | 95.6% | reaches 100% |
| +94 rooms (2026 actual) | 2,474 rooms | 82.8% | 87.4% | 92.0% | 96.6% |
| +200 rooms | 2,580 rooms | 79.4% | 83.8% | 88.2% | 92.6% |
| +300 rooms | 2,680 rooms | 76.4% | 80.7% | 84.9% | 89.2% |
| +500 rooms | 2,880 rooms | 71.1% | 75.1% | 79.0% | 83.0% |
Source: Calculated by the HotelBank Editorial Team based on MetroEngines Research (August 2026, Kusatsu Town, N=107 properties, 2,474 rooms, 92.0% estimated occupancy). The demand side is a simple test holding sold-room equivalents fixed; it does not incorporate price elasticity, seasonality, or changes in channel mix. Figures in red fall below the Gunma average (80.6-81.8% in June-July 2026).
The reading is straightforward. At the actual +94 rooms, estimated occupancy of 92.0% (as of August 2026) holds. For occupancy to fall to the Gunma average (around 81%) with demand flat, the net addition would need to be roughly 500 rooms — more than five times the actual figure. Even in a scenario where demand falls 5%, it takes +300 rooms to enter the prefectural-average band. A net addition of 500 rooms in a single year is not a realistic prospect for an onsen town of about 6,000 residents, so the numbers confirm from their own side that the 191 rooms (94 net) were not on a scale capable of reversing the area’s supply-demand balance.
That said, this test speaks only to the area average. As the following sections show, the conclusion changes once the view narrows to a single price band. What is sensitive is not area-wide occupancy but competitive density within a specific price band.
Room Count x Rate Positioning — the “Mid-to-Large Scale x High Rate” White Space
On an area average, rates were defended. Break the price bands apart, however, and the band where the impact of added supply concentrates becomes visible. We plotted the 23 properties with 20 or more rooms for which an estimated settled ADR can be calculated, with room count on the horizontal axis and estimated settled ADR on the vertical.
Source: MetroEngines Research (N=23 properties, estimated settled ADR for July 2026). Circle size = number of guest reviews.
The plot has a clear structure. The six properties with more than 100 rooms fall into an estimated settled ADR band of ¥16,400 to ¥34,100, and none exceeds ¥35,000. The only property above ¥35,000 is the 36-room Naraya (奈良屋). In other words, Kusatsu Onsen has essentially never had a “mid-to-large scale yet high rate” position.
The 94-room property that opened in June 2026 is exactly the scale that fills this white space. Across the area as a whole it is a net addition of 94 rooms, or 3.8% — but confine the view to the “60+ rooms x high rate” segment and it means one operator entering a band that effectively had no competitor. Existing high-rate inns are mostly in the 30-60 room range; their price bands overlap, but scale and format differ, so whether the two become direct substitutes will need to be judged by following the sell-through data from here.
Ratings vs Rates — Headroom Remains at Highly Rated Small Inns
A second axis is the relationship between guest ratings and rates. The HotelBank Editorial Team compiled overall scores from 119,580 guest reviews across 25 properties in the Kusatsu Onsen area and matched them against the 23 properties for which an estimated settled ADR can be calculated.
Source: HotelBank Editorial Team research (overall review score) and MetroEngines Research (estimated settled ADR, July 2026). N=23 properties.
Six properties score 4.5 or above, and three of those sit below ¥23,000 in estimated settled ADR. Yuyado Miyuki Honkan (湯宿みゆき本館) (23 rooms, score 4.63) is around ¥17,500; Gensen Ichinoyu (源泉一乃湯) (44 rooms, 4.55) around ¥15,800; and Mukashigokoro no Yado Kanemidori (昔心の宿金みどり) (32 rooms, 4.53) around ¥22,500. All three are within walking distance of the Yubatake and all have more than 1,000 reviews.
At the top of the ratings, Naraya (奈良屋) (36 rooms, score 4.81) carries an estimated settled ADR of around ¥47,600 — the only property in the area above ¥35,000. Similarly highly rated, Boun (草津温泉 望雲) (42 rooms, 4.67) is around ¥31,300 and Yubatake Sensui (草津温泉 湯畑泉水) (33 rooms, 4.54) around ¥32,200. That a high-rating, high-rate position is viable has already been demonstrated inside the area (based on 119,580 reviews across 25 properties in the Kusatsu Onsen area, with the 23 properties for which an estimated settled ADR can be calculated used for the scatter plot; N=23). If so, the natural reading is that properties with comparable ratings but rates stuck between ¥15,000 and ¥23,000 still hold headroom on price.
Silver Week Sell-Through — Small Inns Fill First
In an area where supply increased, which segment fills first? We compiled property-level remaining-room trajectories in Kusatsu Town for the four-day holiday of September 19-22, 2026. The sample is the 85 properties, out of 116 with observable OTA inventory in Kusatsu Town, whose OTA-released allocation is at least 30% of total rooms. (Properties with an extremely small released allocation were excluded because sell-out cannot be judged from them — a direct-booking-led channel strategy, a sales-control approach that releases inventory in small increments, and OTA allocation settings are among several possible explanations.)
| Rank | Property | Total rooms | Avg. early sell-out LT | Days sold out | Current remaining-room rate |
|---|---|---|---|---|---|
| 1 | Naraya (奈良屋) | 36 rooms | 87.5 days out | 2 of 4 | 10.4% |
| 2 | Guest House Cedar Lodge (ゲストハウス シーダーロッジ) | 6 rooms | 86.5 days out | 4 of 4 | 0% |
| 3 | Urakusatsu Tou (裏草津 蕩) | 56 rooms | 83.5 days out | 4 of 4 | 6.2% |
| 4 | Uribo Ryokan Nakadori Urabo (うり房旅館仲通り うら房) | 5 rooms | 82.7 days out | 3 of 4 | 15.0% |
| 5 | New Izumi (ニューいずみ) | 6 rooms | 76.5 days out | 2 of 4 | 33.3% |
| 6 | Hotel Spax Kusatsu (ホテルスパックス草津) | 18 rooms | 71.8 days out | 4 of 4 | 1.4% |
| 7 | Matsumuraya Ryokan (松村屋旅館) | 10 rooms | 70.0 days out | 4 of 4 | 0% |
| 8 | Yunoyado Onga (湯の宿 音雅) | 12 rooms | 65.7 days out | 3 of 4 | 4.2% |
| 9 | Omame no Koyado Hana-Ingen (お豆の小宿 花いんげん) | 10 rooms | 65.0 days out | 3 of 4 | 5.0% |
| 10 | Kusatsu Yamamotokan (草津 山本館) | 11 rooms | 62.2 days out | 4 of 4 | 0% |
Source: MetroEngines Research. Check-in September 19-22, 2026, Kusatsu Town. Aggregated across the 85 of 116 covered properties whose OTA-released allocation is at least 30% of total rooms (N=85).
Eight of the top 10 have fewer than 20 rooms. Inns in the 5-12 room range are hitting zero remaining rooms as early as 60 to 87 days before check-in. Small inns fill first on holiday demand simply because their inventory is thin — structurally unsurprising, but it also means that among travelers who want to stay in Kusatsu over the September holiday, those whose first choice is a small inn finish deciding more than two months in advance.
Also notable is that the 36-room Naraya (奈良屋) produces sell-out days at an average of 87.5 days out, the fastest in the sample. It holds the area’s highest rating (4.81) and its highest rate (around ¥47,600), and still fills first — a good example of ratings supporting both rate and occupancy.
Implications for Revenue Management
From the data above, three revenue opportunities stand out for properties in Kusatsu Onsen. Each is presented as available headroom rather than as a current problem.
First, price upside in the high-rating, mid-rate band. Properties with an overall score of 4.5 or above but an estimated settled ADR below ¥23,000 have already demonstrated strong demand capture and guest satisfaction. The area contains properties achieving ¥31,000 to ¥47,600 with scores of 4.6 to 4.8, which confirms that no structural ceiling on price exists here. Raising rates in stages, starting from dates where demand is reliable — holidays, weekends, the autumn foliage season — is a way to convert proven ratings into revenue.
Second, designing the size of increases on dates that sell out early. Properties selling out 60 to 87 days ahead of the September holiday had demand exceeding price on at least those dates. The earlier the sell-out, the more likely the rooms would have cleared at a higher price. For the same period next year, it is straightforward to set the opening rate a notch higher and then adjust while watching the pace of sell-through. The fewer the rooms, the more directly a per-room rate improvement flows to GOP, so the effect shows up faster at small properties.
Third, the differentiation axis for mid-to-large properties. More players entering the “60+ rooms x above ¥35,000” band raises awareness of that price band itself. Once staying in Kusatsu Onsen at a high rate becomes a visible option, the ceiling on rates across the whole area rises. For mid-sized properties, there is more upside in articulating existing strengths — distance from the Yubatake, the hot spring source, cuisine, private baths — and being chosen on a different value axis while moving closer on price, than in competing head-on within the same band. With estimated area occupancy running at 92-97%, there is still slack on the demand side.
Conclusion — No Supply Shock, but One Band Did Move
To summarize what was observed in Kusatsu Onsen in summer 2026. First, the openings are reported as 191 rooms, but 97 of those are a refurbishment and conversion of an existing property, leaving a net area addition of about 94 rooms — 3.8% of the 2,474 rooms confirmed active on OTAs. Second, Kusatsu Town’s estimated settled ADR was -5.4% in June and +0.2% in July, and the June-July average of -2.6% was the smallest decline among Gunma’s five major onsen destinations. Third, estimated occupancy ran 92-97% from June through August, 11 to 15 points above the Gunma average, showing the added inventory was absorbed.
Taken at the level of the area as a whole, then, no supply-demand shock occurred. Break the price bands apart, however, and a different picture emerges. The “60+ rooms x above ¥35,000” band had been essentially empty, and a 94-room operator has now entered it. This does not show up in the area average, but the competitive environment in that band alone changed discontinuously in 2026.
The practical implication for mid-sized ryokan and hotels is not to compete head-on on price but to revisit the relationship between ratings and rates. The area contains several properties with an overall score of 4.5 or above yet an estimated settled ADR below ¥23,000, alongside properties in the same area combining scores of 4.6 to 4.8 with rates of ¥31,000 to ¥47,600. Demand has set a record high for three consecutive years (Kusatsu Town, “FY2025 Visitor Count Survey Results,” 4.05 million in fiscal 2025) and inventory is almost fully absorbed. The headroom on rates still lies inside the area.
⚠ Note on ADR for future dates: ADR figures for August 2026 onward in this article are estimates based on sale prices published on OTAs at the time of the survey and will move as the check-in date approaches. Note in particular that November and December 2026 cover fewer properties than other months (67 and 58 respectively), so the estimates have a wider margin of variation. Year-on-year comparisons focus on June and July 2026, where the calculation can be based on settled historical data.
Related Reading
- Gunma Hotel Market 2026: Four ADR Tiers and a ¥5,700 Upper-Mid Gap
- Autumn Onsen Ryokan ADR 2026: Hakone, Kusatsu & Yufuin YoY Trends
- Does New Hotel Supply Cut ADR? Only Below 13,000 Rooms, 47 Prefectures
- Japan 2026: 1,242 Openings, 33,749 Rooms — 47% Villas, 42% Business
- Estimated OCC vs Sell-Out Rate: Tokyo Business 77.7% vs Capsule 93.8%
- Autumn Leaves 2026: Hotel Price Peaks Land 14 Days Early in 10 Cities
- Japan’s 30 Ski Resorts: 40,419 Rooms Within 3km, Top 3 Hold 39%
References and Sources
■ Data sources
Estimated settled ADR and advertised prices are aggregated at the municipality level from the daily history of sale prices published on OTAs (Kusatsu Town N=77-96 properties; Gunma N=438 properties; June 2025 to August 2026). Estimated occupancy is calculated from the sell-through of inventory sold on OTAs (Kusatsu Town: June 2026 N=98 properties / 2,167 rooms; July N=74 / 1,965 rooms; August N=107 / 2,474 rooms). The supply map covers 221 properties and 3,841 rooms within a 5km radius of the Yubatake (36.6224°N, 138.5966°E), of which the 42 properties with 20 or more rooms (2,465 rooms) are plotted. Early sell-out lead times cover check-in on September 19-22, 2026, aggregated across the 85 of 116 properties with observable OTA inventory in Kusatsu Town whose released allocation is at least 30% of total rooms. Review scores cover 119,580 reviews across 25 properties in the Kusatsu Onsen area, of which the 23 with a calculable estimated settled ADR are used in the scatter plot.
■ Assumptions used in the estimates
Year-on-year comparisons use June and July 2026, the months for which settled history provides a basis (the two-month average is the simple mean of June and July). The sensitivity test (Table 5) is a simple calculation that holds demand fixed at August 2026’s 2,474 total rooms x 92.0% estimated occupancy ≈ 2,276 room-equivalents, then adds net rooms to pre-opening-equivalent supply of 2,380 rooms (2,474 minus the 94-room net addition) and recomputes estimated occupancy. It does not incorporate price elasticity, seasonality, changes in channel mix, or demand substitution between new and existing properties. Area-level ADR uses the median of the properties covered (the level of a typical property in that area).
■ Limitations and caveats
Estimated settled ADR carries a median error of roughly 7% when cross-checked against property-level results disclosed by listed hotel REITs (91 properties, most recent three months), and differs from each property’s actual transacted rates and accounting figures. Estimated occupancy is based on OTA sales inventory and does not match a property’s overall actual occupancy including direct, group, and travel-agency inventory. Because the number of properties covered varies month to month (74-107 in Kusatsu Town), monthly changes include the effect of sample variation. ADR from August 2026 onward is estimated from published prices at the time of the survey and will move as check-in approaches; November and December 2026 in particular cover few properties (67 and 58), so the estimates vary more widely. Room counts and opening dates for the two new properties are based on each property’s public disclosures and OTA listing confirmation.
■ Market data
- MetroEngines Research — estimated settled ADR, advertised prices, estimated occupancy, remaining-room trajectories (Kusatsu Town N=77-96 properties; Gunma N=438 properties)
- MetroEngines Research (OTA-listing-confirmed basis) — new opening data (Gunma, 2026, N=34)
- HotelBank Editorial Team research — overall guest review scores (25 properties in the Kusatsu Onsen area, 119,580 reviews)
■ Public statistics and municipal materials
- Kusatsu Town, “This Month’s Visitor Numbers” (tourist arrivals)
- Kusatsu Town, “Tourist Arrivals Set a Record High for the Third Consecutive Year,” FY2025 Visitor Count Survey Results (PDF)
■ News and property information
- “Tourist numbers in Kusatsu Town, Gunma hit a record 4.05 million in FY2025” (Nihon Keizai Shimbun, April 2026)
- Official release on the opening of KAI Kusatsu (Hoshino Resorts, 2026) — confirms 94 rooms, June 7, 2026 opening, and the guests-only tunnel
- B/C HOTEL Kusatsu property information (operator’s official site) — confirms location and property overview
- Notice of business transfer for Kusatsu Onsen Hotel New Momiji (former operator’s official site) — confirms the business was transferred as of July 31, 2025
- “B/C HOTEL Kusatsu opens on the former Hotel New Momiji site: pre-opening from July 6, 2026” (Ikou! Kusatsu Onsen)
- “Newly opened in Kusatsu Onsen: a new onsen inn connected to the hot spring town by a guests-only tunnel” (Co-Trip, 2026)
- “Kusatsu Onsen reached a record 3.27 million visitors in FY2019” (Kanko Keizai Shimbun)