

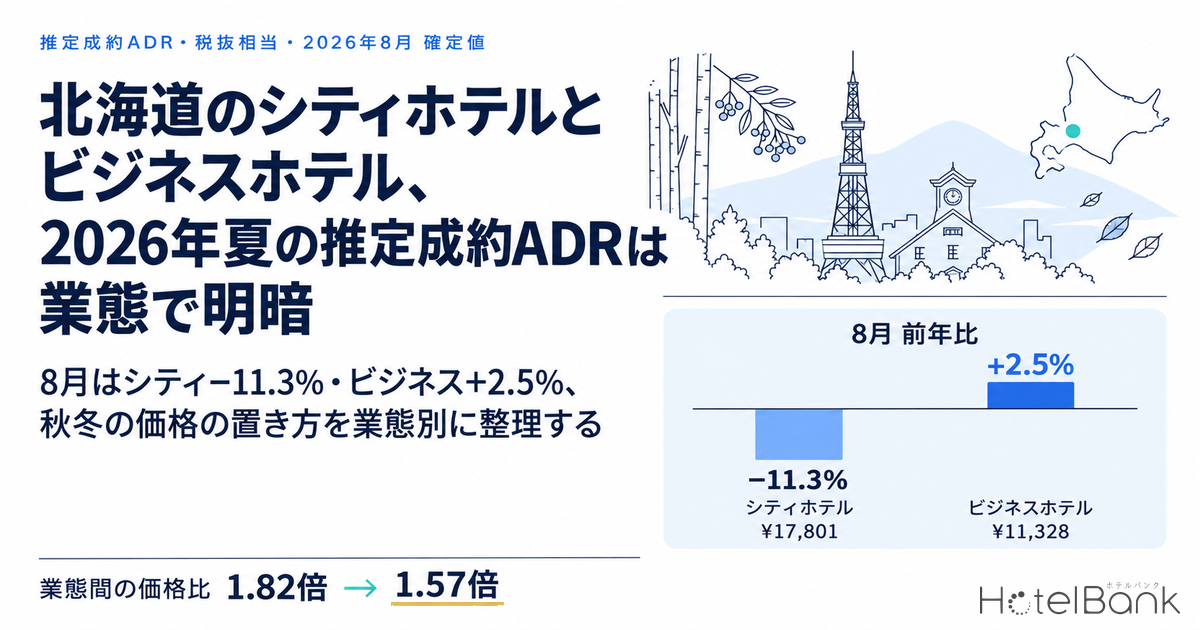
Hokkaido’s city hotels and business hotels posted contrasting results for estimated settled ADR (tax-exclusive equivalent) in summer 2026. Comparing finalized monthly figures with the finalized figures for the same month a year earlier, city hotels (N=75) came in at ¥17,800 in July, down 5.7% YoY, and ¥17,800 in August, down 11.3% — well below the prior year in the peak months. Business hotels (N=438), by contrast, stayed above the prior year at ¥11,200 in July (+4.1%), ¥11,300 in August (+2.5%) and ¥10,800 in September (+8.9%). City hotels returned to the prior-year level in September at ¥16,500 (+0.1%), but the price gap between the two hotel types had narrowed from 1.82x a year earlier to 1.57x. This article sorts out this “summer split by hotel type” using finalized months only, and considers how each hotel type should position its prices heading into autumn and winter.
About the data in this article — Coverage: Hokkaido city hotels N=75 properties and business hotels N=438 properties (as of August 2026). The price metric in this article is estimated settled ADR (the transacted price level estimated from OTA and other sales data, tax-exclusive equivalent); occupancy is an estimate based on OTA-listed inventory. Both are defined at the end of the article. YoY comparisons are made between finalized months only. Data as of: October 12, 2026.
- — Estimated settled ADR for Hokkaido city hotels in August 2026 was ¥17,801 (N=75), down 11.3% YoY. It stayed below the prior year for five straight months from April, then returned to the prior-year level in September at ¥16,485 (+0.1%).
- — Business hotels posted ¥11,328 in August (N=438), up 2.5%, and ¥10,842 in September, up 8.9%. All nine months from January to September 2026 were at or above the prior year.
- — The price ratio between the two hotel types (city ÷ business) narrowed from 1.82x to 1.57x in August and from 1.65x to 1.52x in September. The ratio has been below the prior year for six consecutive months since April.
- — The drop from August to September became shallower: from 17.9% to 7.4% for city hotels and from 9.8% to 4.3% for business hotels. Whether to start autumn price cuts later than last year is an issue for both hotel types.
- — Monthly average estimated OCC (OTA-listed inventory basis, observed just before the stay date) for August and September 2026 was 90–93% for both hotel types. In the five-day September holiday, the 20th–21st reached 96–98%, while the final day, the 23rd, was 78–80%.
YoY for January–September 2026 — Both Hotel Types Up Through Spring, Only City Hotels Down in Summer
We start by lining up the nine finalized months and tracing the YoY path of each hotel type. Hokkaido city hotels were above the prior year through winter — ¥14,700 in January (+29.4% YoY), ¥18,200 in February (+4.4%) and ¥11,900 in March (+8.4%) — but turned negative from April (¥9,700, −0.9%), and the decline widened month by month: −1.4% in May, −3.6% in June, −5.7% in July and −11.3% in August. September came back to almost the same level as a year earlier at ¥16,500 (+0.1% YoY). How the sign flipped around April is traced from the finalized first-half figures in Hokkaido ADR H1 2026: City −5.7%, Business +4.1%, April the Turn.
Business hotels, by contrast, were at or above the prior year in all nine months, from ¥8,100 in January (+14.4%) to ¥10,800 in September (+8.9%). April’s +0.3% was the smallest gain, and although the increase narrowed in summer to +4.1% in July and +2.5% in August, not a single month fell into negative territory. September deserves attention: at the same time as city hotels returned to ±0, business hotels recorded +8.9%, the second-largest gain of the year. The summer decline can be read as a phenomenon specific to city hotels, with price formation for business demand on a separate track.
Source: MetroEngines Research, compiled by the HotelBank Editorial Team (estimated settled ADR, YoY between finalized months. City N=75, Business N=438)
| Stay month | City 2026 | City 2025 | YoY | Business 2026 | Business 2025 | YoY |
|---|---|---|---|---|---|---|
| Jan | ¥14,658 | ¥11,324 | +29.4% | ¥8,074 | ¥7,057 | +14.4% |
| Feb | ¥18,171 | ¥17,410 | +4.4% | ¥8,769 | ¥8,112 | +8.1% |
| Mar | ¥11,858 | ¥10,939 | +8.4% | ¥7,593 | ¥7,018 | +8.2% |
| Apr | ¥9,728 | ¥9,820 | −0.9% | ¥7,142 | ¥7,120 | +0.3% |
| May | ¥13,551 | ¥13,738 | −1.4% | ¥8,857 | ¥8,440 | +4.9% |
| Jun | ¥14,796 | ¥15,356 | −3.6% | ¥9,545 | ¥9,298 | +2.7% |
| Jul | ¥17,819 | ¥18,891 | −5.7% | ¥11,154 | ¥10,712 | +4.1% |
| Aug | ¥17,801 | ¥20,078 | −11.3% | ¥11,328 | ¥11,048 | +2.5% |
| Sep | ¥16,485 | ¥16,476 | +0.1% | ¥10,842 | ¥9,960 | +8.9% |
Source: MetroEngines Research, compiled by the HotelBank Editorial Team (estimated settled ADR, tax-exclusive equivalent, finalized. N = 73–76 city hotels and 417–441 business hotels, varying by month)
City Hotels Year over Year — A Lower August Peak and a Shallower Drop into September
Next, we overlay the monthly estimated settled ADR of city hotels for 2025 and 2026 and compare the shapes. 2025 was a “tall, sharp peak”: it topped out at ¥20,100 in August and fell 17.9% in one step to ¥16,500 in September. In 2026, July (¥17,800) and August (¥17,800) stand at almost the same height, and the drop from August to September is only 7.4%. The peak is ¥2,300 lower than the prior year, but the back side of the peak has become gentler — a year in which summer demand, rather than concentrating in July–August, spread out flat through September.
The start of winter, however, was higher than the prior year. January came in at ¥14,700, ¥3,300 above the prior year’s ¥11,300, and February at ¥18,200 also exceeded the prior year’s ¥17,400. 2026 can be summed up as a year in which the seasonal swing of Hokkaido city hotels flattened toward “a higher winter and a lower summer”. From October onward, the dotted line shows estimates based on current sales conditions — ¥14,500 for October, ¥12,000 for November and ¥14,500 for December — but these are not finalized figures, and a simple comparison with the prior year’s finalized figures has to wait until each month closes.
Source: MetroEngines Research, compiled by the HotelBank Editorial Team (Hokkaido city hotels, N=73–76 properties. Solid line = finalized, dotted line = estimate based on current sales conditions)
Business Hotels Year over Year — Same Shape as Last Year, Only the Level Moved Up a Step
The year-over-year overlay for business hotels gives a different picture from city hotels. The 2025 curve bottomed at ¥7,000 in March, rose to ¥11,000 in August, then stepped down to ¥10,000 in September, ¥8,700 in October, ¥7,900 in November and ¥7,500 in December. In 2026, every month from January (¥8,100) to September (¥10,800) runs above the 2025 line; the shape is almost identical, with only the level shifted upward in parallel. The August peak did not come down as it did for city hotels — at ¥11,300 it was ¥280 above the prior year — and the September drop was 4.3%, shallower than the prior year’s 9.8%.
As a result, the price gap between the two hotel types has visibly narrowed in one year. The ratio of city to business estimated settled ADR was 1.82x in August 2025 (a difference of ¥9,000), against 1.57x in August 2026 (a difference of ¥6,500); for September it narrowed from 1.65x to 1.52x (a difference of ¥5,600). With city hotels falling and business hotels rising, the price ranges of the “upper” and “lower” hotel types in Hokkaido are moving closer together. This narrowing is a fact that cannot be ignored when considering how far the two hotel types will compete for each other’s guests in autumn and winter pricing. The divergence was already visible when the August figures were finalized; this article layers the finalized September figures on top and re-measures the distance between the two hotel types.
Source: MetroEngines Research, compiled by the HotelBank Editorial Team (Hokkaido business hotels, N=417–441 properties. Solid line = finalized, dotted line = estimate based on current sales conditions)
Lining up this ratio for every month from January to September shows that the narrowing is not just a summer phenomenon. In January the ratio widened from 1.60x a year earlier to 1.82x, in February it narrowed from 2.15x to 2.07x, and in March it was unchanged at 1.56x, but from April (1.38x → 1.36x) through September it has been below the prior-year ratio for six consecutive months. April, when city hotels’ YoY turned negative, was also the month the distance between the two hotel types began to shrink. Even in September, when city hotels returned to the prior-year level, business hotels grew 8.9%, leaving the ratio at 1.52x, smaller than the prior year’s 1.65x.
| Stay month | Price ratio 2025 | Price ratio 2026 | Change in ratio | Difference 2025 | Difference 2026 |
|---|---|---|---|---|---|
| Jan | 1.60x | 1.82x | +0.22 | ¥4,267 | ¥6,584 |
| Feb | 2.15x | 2.07x | −0.08 | ¥9,298 | ¥9,402 |
| Mar | 1.56x | 1.56x | ±0.00 | ¥3,921 | ¥4,265 |
| Apr | 1.38x | 1.36x | −0.02 | ¥2,700 | ¥2,586 |
| May | 1.63x | 1.53x | −0.10 | ¥5,298 | ¥4,694 |
| Jun | 1.65x | 1.55x | −0.10 | ¥6,058 | ¥5,251 |
| Jul | 1.76x | 1.60x | −0.16 | ¥8,179 | ¥6,665 |
| Aug | 1.82x | 1.57x | −0.25 | ¥9,030 | ¥6,473 |
| Sep | 1.65x | 1.52x | −0.13 | ¥6,516 | ¥5,643 |
Source: MetroEngines Research, compiled by the HotelBank Editorial Team (calculated from the finalized estimated settled ADR in Table 1. Price ratio = city ÷ business; difference = city − business)
The Occupancy Side — Estimated OCC Was in the 90% Range for Both Hotel Types in August and September, So the Price Gap Was Not an Occupancy Gap
While prices split by hotel type, what about occupancy? Looking at estimated OCC (OTA-listed inventory basis) as observed just before the stay date, the August 2026 monthly average was almost the same for both: 91.4% for city hotels (33–35 properties, 8,150–8,550 rooms) and 90.9% for business hotels (215–222 properties, 25,477–25,989 rooms). September also held in the 90% range at 90.6% for city hotels (34–37 properties) and 92.8% for business hotels (219–231 properties, 25,308–27,296 rooms). At least from this metric, it is hard to say that weak occupancy lay behind city hotels giving up rate to −11.3% YoY in August.
The day-of-week shapes also differ. In August, city hotels had a nearly flat distribution from a Thursday peak of 94.4% down to 87.5% on Sunday, while business hotels showed a gap of about 11 points between Thursday (95.3%) and Sunday (84.4%), with demand leaning toward the middle of the week. In September, business hotels were uniformly at 92–96% from Monday to Thursday, and Saturday was also high at 94.5%. By day, Saturday, September 19 through Wednesday, September 23 (Autumnal Equinox Day) formed a five-day holiday (the 21st was Respect for the Aged Day and the 22nd a national holiday). In the first half, the 19th–21st, city hotels ran 91.4% → 96.9% → 96.3% and business hotels 95.2% → 97.8% → 97.2%, with both hotel types approaching full. On the 22nd, however, they slipped to 86.7% for city hotels and 92.3% for business hotels, and on the 23rd, the final day of the holiday, they hit the month’s lows at 77.9% for city hotels and 79.6% for business hotels. The fact that rooms were left open on the last night of the holiday, when the next day is a working day, bears on how prices should be positioned in autumn. The day-of-week shape of Hokkaido business hotels — thick from Tuesday to Thursday with a trough on Sunday and Monday — is examined in depth using June–July observations in Hokkaido Business Hotels Aren’t Weekend-Led: Thu 95.4% Ties Sat 95.4%.
| Estimated OCC by day of week (monthly avg.) | Mon | Tue | Wed | Thu | Fri | Sat | Sun | Monthly avg. |
|---|---|---|---|---|---|---|---|---|
| City, August 2026 (33–35 properties) | 88.9% | 92.1% | 92.2% | 94.4% | 92.7% | 93.2% | 87.5% | 91.4% |
| City, September 2026 (34–37 properties) | 91.0% | 91.7% | 90.7% | 92.4% | 88.1% | 91.7% | 88.7% | 90.6% |
| Business, August 2026 (215–222 properties) | 88.9% | 93.1% | 94.0% | 95.3% | 91.0% | 91.8% | 84.4% | 90.9% |
| Business, September 2026 (219–231 properties) | 93.7% | 94.2% | 92.1% | 95.7% | 91.1% | 94.5% | 88.3% | 92.8% |
Source: MetroEngines Research, compiled by the HotelBank Editorial Team (estimated OCC, OTA-listed inventory basis, observed just before the stay date. Coverage is a fixed cohort in Hokkaido; the number of properties varies by stay date within the ranges shown in the table)
For Revenue Managers Running City Hotels and Business Hotels in Hokkaido — Implications and Action Plan
1. Evaluate your property’s summer YoY only after setting it against the market’s “line by hotel type”. The finalized market figures for Hokkaido are −11.3% in August and +0.1% in September for city hotels, and +2.5% in August and +8.9% in September for business hotels. Even if your August ADR fell below the prior year, for a city hotel the whole market was moving in the same direction, so this should be separated from a pricing failure at the individual property. Conversely, a YoY decline at a business hotel is a decline while the market is rising, so there is room to review sales channels and room-type mix first.
2. For city hotels, designing to “lengthen the back of the peak” fits this year’s shape better than “raising the peak”. In the 2026 market, July (¥17,800) and August (¥17,800) were level, and the drop to September (¥16,500) became shallower, from 17.9% a year earlier to 7.4%. Building autumn prices on the premise that high rates concentrate in August alone means cutting too early in September. Given that September’s estimated OCC of 90.6% was almost the same as August’s 91.4%, it is worth considering holding early-to-mid September prices as an extension of August.
3. For business hotels, read the narrowing distance between hotel types as “room to move up”. The city-to-business ratio narrowed from 1.82x to 1.57x. The gap closed because business hotel rates rose, which also means the price band one step below city hotels is open. With weekday estimated OCC uniformly at 92–96% in September, there is little reason to leave Tuesday–Thursday prices unchanged from the same days of the week last year.
4. For autumn holidays, price the “first half and middle days” separately from the “final day”. In the five-day holiday of September 19–23, both hotel types filled to 96–98% on the 20th–21st, whereas the final day, the 23rd (Autumnal Equinox Day), posted the month’s lows at 77.9% for city hotels and 79.6% for business hotels. In November, Culture Day (Tuesday, November 3) is a stand-alone holiday separated from the weekend by a working day, and Labor Thanksgiving Day (Monday, November 23) is the final day of a three-day weekend. Both are nights followed by a working day, so rather than setting the same price as the first half of a holiday, decisions should be made separately for each calendar pattern.
| Time horizon | Action | Decision trigger (figures in this article) | Aim |
|---|---|---|---|
| Today to this week | Line up your property’s July–September ADR YoY against the market line for your hotel type and record the difference | Whether your property is below City: −11.3% in August, +0.1% in September / Business: +2.5% in August, +8.9% in September | Separate market factors from property-specific factors |
| Today to this week | Check the prices set for weekdays (Tue–Thu) in October against the finalized September figures | If your level for the same hotel type remains well below the September market figure of ¥10,842 for business hotels or ¥16,485 for city hotels | Avoid missing autumn weekday demand |
| Within two weeks | Split November holidays into “first half and middle days of a holiday” and “final days followed by a working day”, and set final-day prices in a separate bucket | The fact that estimated OCC on September 23, the final day of the five-day holiday, was 77.9% for city hotels and 79.6% for business hotels, far from the 96–98% of the 20th–21st | Avoid vacancies caused by over-expecting holiday demand |
| Within two weeks | City hotels: design the November floor price using the prior year’s finalized ¥12,305 as the yardstick | If the current November estimate of ¥12,017 looks to be below the prior-year finalized figure (a simple comparison with finalized figures has to wait until the month closes) | Keep the depth of the off-season trough in line with the prior year |
| Toward next month | Rebuild December–February winter prices starting from the January 2026 market increase (city +29.4%, business +14.4%) | If your property’s January–February 2026 YoY did not reach the market’s increase | Recover rate in the winter demand season |
| Toward next month | Track the price ratio between hotel types (1.57x) as a fixed reference point and check monthly which hotel type your property sits closer to | Whether the market ratio’s narrowing from 1.82x a year earlier to 1.57x continues | Redefine price bands in preparation for competition over guest segments |
Summary — Three Yardsticks for Autumn and Winter Pricing
To sum up, summer 2026 in Hokkaido was a summer in which “city hotels gave ground and business hotels grew”. The reusable yardsticks come down to three. The first is the YoY line by hotel type: −11.3% in August and +0.1% in September for city hotels, +2.5% in August and +8.9% in September for business hotels; evaluate your own property by its difference from this line. The second is the shape of the peak: the drop from August to September became shallower, from 17.9% to 7.4% for city hotels and from 9.8% to 4.3% for business hotels. Whether to start autumn price cuts later than last year is an issue common to both hotel types. The third is the price ratio between hotel types: the narrowing from 1.82x to 1.57x means the band just below city hotels and the band just above business hotels have begun to overlap, and autumn and winter will test where each draws the boundary of its price range.
The reason results split by hotel type cannot be pinned down to a single cause. Still, given that estimated OCC stayed in the 90% range for both hotel types over the same period, the most practical approach at this point is not to lower autumn and winter prices out of concern about occupancy, but to set them one month at a time against the finalized prior-year monthly levels.
Frequently Asked Questions
Q. Is estimated settled ADR the same as the listed rate?
A. No. Estimated settled ADR in this article is the transacted price level (tax-exclusive equivalent) estimated from OTA and other sales data; past months are finalized figures, and current and future months are estimates based on current sales conditions. This article does not cover the level of listed rates themselves.
Q. Why is no YoY shown for October onward?
A. Because October–December 2026 are estimates for months still on sale, on a different basis from the finalized prior-year monthly figures. YoY in this article is limited to finalized months (January–September 2026); October onward has to wait for each month to close before comparison.
Q. Are the figures in this article for Sapporo City?
A. No. They are aggregates for all of Hokkaido (prefecture level), not for Sapporo City alone. Estimated settled ADR covers N=73–76 city hotels and N=417–441 business hotels.
Q. Did city hotels’ August rate fall below the prior year because occupancy dropped?
A. That cannot be said from the metrics in this article. Estimated OCC on an OTA-listed inventory basis averaged in the 90% range for both hotel types in both August and September 2026. No YoY comparison of occupancy was made, and the reason results split by hotel type has not been identified.
Q. Why was estimated OCC on September 23, 2026 the lowest of the month?
A. In 2026, September 19–23 was a five-day holiday, and the 23rd was its final day (followed by a working day). On the middle days, the 20th–21st, both hotel types were at 96–98%, but on the 23rd city hotels were at 77.9% and business hotels at 79.6%. The cause has not been identified, but it is a reason to consider pricing the final day of a holiday separately from the first half.
About the Data
| Item | Description |
|---|---|
| Estimated settled ADR | The transacted price level (tax-exclusive equivalent) estimated from OTA and other sales data (lowest-plan level × hotel-type coefficient, ensemble of multiple channels). Past months are finalized figures; current and future months are estimates based on current sales conditions. Median error of 6.6% when checked against published operating results. YoY is calculated between finalized months only; estimates for October onward are not compared with prior-year finalized figures. |
| Estimated OCC (OTA-listed inventory basis) | Occupancy on an OTA-listed inventory basis = 100 − 100 × rooms remaining on OTAs ÷ total rooms. Coverage is a fixed cohort of properties that list at least 30% of their total rooms on OTAs (the same set of properties for each stay date; the number of properties varies by stay date within the ranges shown in the tables). It is an estimate based on the take-up of inventory sold on OTAs and is defined differently from actual room occupancy (it reads high because unlisted rooms are counted as sold). This article uses values observed just before the stay date for August and September 2026. |
| Booking curve | Based on observations from 45 days before the stay date up to the most recent. |
| Coverage | All of Hokkaido (prefecture-level aggregates, not figures for Sapporo City alone). Estimated settled ADR covers N=73–76 city hotels (N=75 in August 2026) and N=417–441 business hotels (N=438 in August 2026). Estimated OCC covers a fixed cohort of 33–37 city hotels with 8,150–8,831 rooms and 215–231 business hotels with 25,308–27,296 rooms (based on listings on major booking sites). |
| Data date | October 12, 2026. Sales conditions and inventory change daily, so the figures in this article are a snapshot as of the time of retrieval. |
Source: MetroEngines Research, compiled by the HotelBank Editorial Team
References and Sources
■ Data sources
Aggregated data from MetroEngines Research (monthly estimated settled ADR for Hokkaido city hotels and business hotels, January 2025–December 2026; daily estimated OCC observed just before the stay date, August–September 2026). Dates of public holidays are as published by the Cabinet Office. Data as of October 12, 2026.
■ Calculation assumptions
Estimated settled ADR is an estimate on a tax-exclusive equivalent basis, and YoY was calculated between finalized months only (January–September for 2026). The price ratio between hotel types is city ÷ business and the difference is city − business, both derived from values for the same month. The August-to-September drop is the ratio of monthly values within the same year. October–December 2026 are estimates based on current sales conditions and were not used to calculate YoY. Estimated OCC by day of week is a simple average of daily values for each day of the week.
■ Limitations and notes
These are prefecture-level aggregates and do not show levels for individual cities such as Sapporo. Estimated OCC is an estimate based on the take-up of listed inventory and is defined differently from actual room occupancy. It covers fewer properties than estimated settled ADR (33–37 city hotels, 215–231 business hotels), and no YoY comparison of occupancy was made. The reason YoY split by hotel type, and the cause of the occupancy movement on the final day of the holiday, have not been identified.
・Cabinet Office, “National Holidays” (国民の祝日について) (September 21, 2026 Respect for the Aged Day; September 22 national holiday; September 23 Autumnal Equinox Day; November 3 Culture Day; November 23 Labor Thanksgiving Day): https://www8.cao.go.jp/chosei/shukujitsu/gaiyou.html