

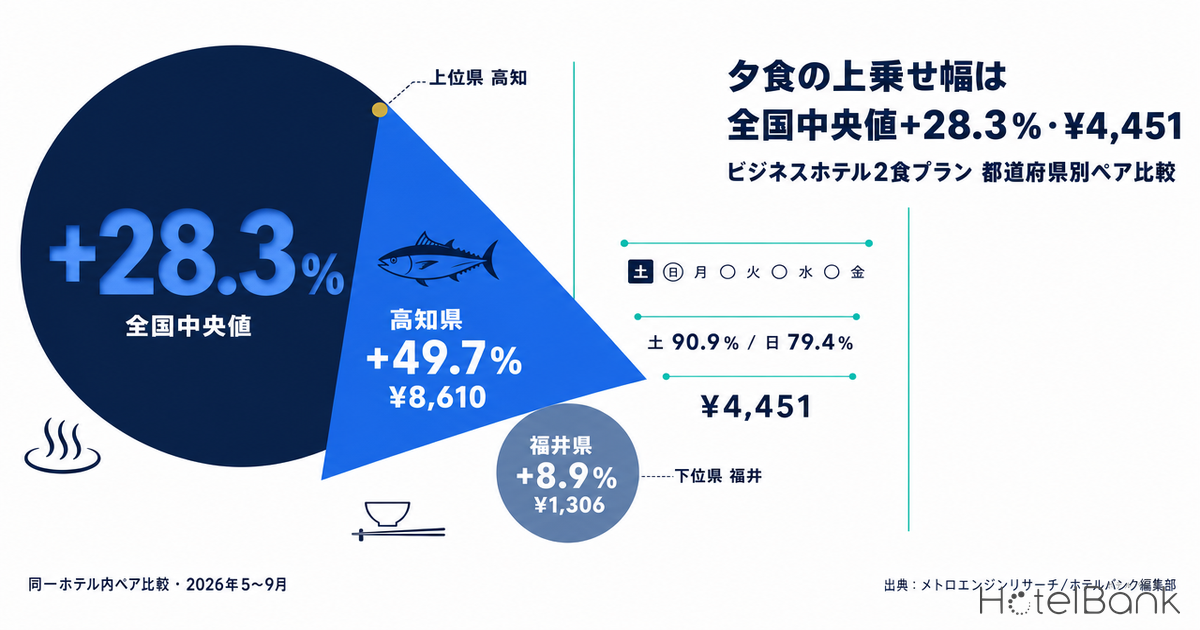
We aggregated the differential between the “breakfast-included” and “dinner-included (two-meal)” plans sold by the same hotel, across the business hotel segment in all 47 prefectures. The national median is +28.3% / a ¥4,451 differential (monthly average for May–September 2026, N=5 or more in every cell). Ranked by prefecture, however, the top is Kochi at +49.7% (¥8,610, N=11–13) and the bottom is Fukui at +8.9% (¥1,306, N=8–9) — a spread of more than five times in premium rate. The same single move, adding a dinner, generates completely different amounts depending on location. This article uses same-property pair data to trace where that gap shows up, how it moves month by month, and which day of the week a two-meal plan should be launched on.
Scope: the business hotel segment across all 47 prefectures (a pair comparison restricted to properties that sell both a “breakfast-included” and a “two-meal” plan within the same hotel), N=5–51 properties per prefecture. The price metric in this article is estimated settled ADR (the transaction price level inferred from OTA and other sales data, pre-tax equivalent); occupancy is an estimate on an OTA-listed-inventory basis. The meal premium is a differential from a same-property pair comparison and is a separate series from estimated settled ADR. Definitions for both are at the end of the article. Data as of September 2, 2026.
- — The national median is +28.3% / ¥4,451. Kochi at the top runs +49.7% / ¥8,610 and Fukui at the bottom +8.9% / ¥1,306 — a spread of more than five times in premium rate.
- — Rate and amount are two different yardsticks. Tokyo sits low nationally on rate at +17.0%, yet its ¥4,137 in yen terms is close to the national median of ¥4,451. When the breakfast-included price level in the denominator differs, the rate ranking flips easily.
- — The national figure barely moves; prefectures do. The national median held flat at +27.3% to +29.9% through May–September 2026. Kochi, meanwhile, widened from +40.4% to +56.5%, while Oita narrowed from +44.4% to +28.4%.
- — Launch on the occupancy trough. Across the four prefectures with the thickest premiums, estimated OCC by day of week runs 90.9% on Saturday against 79.4% on Sunday and 80.6% on Monday. A two-meal plan on a trough day is large enough to be compared directly against discounting the room rate.
- — The breakfast-only premium is +10.6% / ¥1,549 at the national median. Adding dinner is roughly 2.9 times that in yen terms, but food cost and same-day labor also jump, so the differential does not flow straight through to margin.
The dinner premium runs +28.3% at the national median, with the top prefectures in the high +40s
First, a word on the premise. The “premium” handled here is the differential between a breakfast-included plan and a two-meal plan within the same hotel. If you average hotels that sell two-meal plans separately from hotels that sell room-only and then compare the two, the difference in property grade turns straight into the differential. So we extract only properties that sell both meal types under the same roof and take the difference inside each of them. The same pair-comparison method underlies our analysis of Ibaraki’s meal-ancillary differential (breakfast +5.8%, two-meal +52.3%). The population is the business hotel segment in each prefecture; the ryokan segment is out of scope. For ryokan, a two-meal stay is the standard product rather than a case of “adding dinner to a room-only rate,” so it cannot be placed on the same yardstick.
The chart below ranks the monthly average for May–September 2026 by prefecture on that yardstick. All of the top 15 prefectures exceed the national median of +28.3%, and Kochi leads at +49.7%. Tokushima follows at +44.5% (N=6), Mie at +43.2% (N=15–17) and Kyoto at +43.1% (N=14–17), with Wakayama, Nara, Shimane, Hyogo, Gifu and Toyama filling out the list. The pattern reads as a concentration at the top of food-tourism destinations that can put seafood and mountain produce front and centre, and of areas with hot-spring resorts inside the prefecture.
Source: MetroEngines Research; compiled by the HotelBank Editorial Team
That said, looking only at the rate leads to the wrong call. Re-sort the premium by amount and Kyoto takes the lead at ¥9,042, followed by Kochi at ¥8,610 — while Tokyo, low nationally on rate at +17.0%, comes in at ¥4,137 in yen, close to the national median of ¥4,451. The rate is low because the breakfast-included price level in the denominator is high, not because the amount being captured on dinner is small. Conversely, prefectures with a high rate have a lighter denominator, so the rate jumps more easily. When you measure where your own property stands, read both the rate and the amount — that is the first yardstick.
| Prefecture | Premium rate | Differential | Paired properties |
|---|---|---|---|
| Kochi | +49.7% | ¥8,610 | N=11–13 |
| Tokushima | +44.5% | ¥7,426 | N=6 |
| Mie | +43.2% | ¥6,793 | N=15–17 |
| Kyoto | +43.1% | ¥9,042 | N=14–17 |
| Wakayama | +39.2% | ¥6,325 | N=5–6 |
| Nara | +37.3% | ¥6,948 | N=8 |
| Shimane | +36.4% | ¥6,124 | N=6–7 |
| Hyogo | +35.9% | ¥6,148 | N=18–20 |
| Gifu | +35.7% | ¥6,666 | N=11–12 |
| Oita | +34.5% | ¥4,533 | N=19–21 |
| National median (47 prefectures) | +28.3% | ¥4,451 | N=5–51 |
| Osaka | +32.3% | ¥5,872 | N=23–24 |
| Fukuoka | +27.0% | ¥4,451 | N=46–51 |
| Hokkaido | +23.8% | ¥4,919 | N=42–50 |
| Aichi | +20.2% | ¥3,960 | N=37–39 |
| Tokyo | +17.0% | ¥4,137 | N=35–38 |
| Fukui | +8.9% | ¥1,306 | N=8–9 |
Monthly average for May–September 2026. Business hotel segment, same-property pair comparison. Source: MetroEngines Research; compiled by the HotelBank Editorial Team
The number of paired properties (N) also deserves attention. Fukuoka runs N=46–51 and Hokkaido N=42–50, both thick, while Tokushima, Wakayama and Shimane — all in the top group — sit at N=5–7. Cells with a small N move sharply when just a few properties revise their products, so the values for the top prefectures are best read as an indication that “cases of dinner commanding a high price do exist in that area,” not as a guarantee that every property in the prefecture can capture the same premium. No cell with N below 5 is cited anywhere in this article.
The premium moves month to month — it widens in peak demand and narrows in the off-season
The premium is not a fixed value. Followed by stay month, some prefectures show a clear seasonal shape. Kochi expanded from +40.4% in May 2026 (¥6,560, N=11) to +55.0% in June and +56.5% in July (¥9,402, N=13), then stayed high at +47.2% in August and +49.5% in September. Kyoto also widened from +30.2% in May (¥7,156, N=14) to +48.5% in July (¥9,775, N=17). The reading is that pricing on the dinner add-on turns aggressive during the summer demand peak.
Some prefectures moved the other way. Oita posted +44.4% in June (¥5,724, N=21), then narrowed to +28.4% in July (¥3,681, N=20) and ran at +27.9% in August and +31.0% in September. The number of paired properties shifted from 21 to 20, so the comparison set itself may have changed. The monthly premium is an internal average of “the group of properties that were selling both meal types that month,” and it is worth remembering that products going on and off sale are reflected in the number. The national median came in at +27.8% in May, +29.9% in June, +29.1% in July, +27.3% in August and +27.3% in September — stable within a range of one to two points. In other words, nothing moves nationally while individual prefectures move by ten points at a time — and that is exactly why it is worth looking prefecture by prefecture.
Source: MetroEngines Research; compiled by the HotelBank Editorial Team
For reference, comparing the estimated settled ADR of business hotels in each of these prefectures over the same period on a finalized-month basis: in July 2026 Kochi ran ¥7,137 (N=67 properties), up 4.3% from ¥6,846 a year earlier (N=67 properties); Mie ¥7,065 (N=94 properties), up 1.2% from ¥6,983 (N=96 properties); Oita ¥6,110 (N=91 properties), up 1.1% from ¥6,046 (N=92 properties); and Kyoto ¥10,230 (N=325 properties), down 13.0% from ¥11,752 (N=318 properties), a break in early summer that we have broken down separately by segment. In prefectures where the year-on-year move in room rate is confined to a marginal one to four percent, the dinner premium is moving on the order of thousands of yen. That can be read as follows: the tighter the headroom for raising room rates, the more it pays to rebuild the total take per room-night with meals included. Note that the premium is a pair comparison under conditions that include meals for two guests, while estimated settled ADR is a room rate; the two rest on different bases and cannot simply be added together. What is being compared here is only the size of the movement.
Nearly three times the breakfast premium — but the cost to serve is heavy too
Applying the same pair-comparison method to the “room-only to breakfast-included” premium, the national median stops at +10.6% / ¥1,549. Against +28.3% / ¥4,451 for the version that includes dinner, that is a gap of roughly 2.9 times in yen terms. Taking Kochi and cutting out the single month of July 2026: room-only to breakfast-included runs +14.1% (¥1,894, N=35 properties), breakfast-included to two-meal +56.5% (¥9,402, N=13 properties), and room-only all the way to two-meal +77.9% (¥10,895, N=14 properties). The headroom to add on per room-night is in a different league for dinner than for breakfast.
Those figures cannot, however, be read straight across as “profit.” Breakfast can absorb swings in covers through a buffet or a fixed menu, whereas dinner sends both food cost and the labor for cooking and service sharply higher. In an environment where ingredient and labor costs keep climbing, there is no guarantee that the premium flows through to margin. What matters here is one thing: by how much the level the market is paying for dinner — a national median of ¥4,451, and ¥6,000 to ¥9,000 in the top prefectures — exceeds your own built-up cost per dinner cover. If your differential is set close to Fukui’s ¥1,306 at the bottom of the national range, that is barely different from a single breakfast (national median ¥1,549), and it is worth re-checking whether serving dinner pays at all.
And there is one more constraint on a dinner product that rooms do not have: a ceiling on capacity to serve. Selling every room as a two-meal plan on a sold-out night is unrealistic on both the kitchen and the staffing side. That is precisely why the design question for a two-meal plan is “when to sell it.”
Launch on the occupancy trough — Sunday and Monday sit 11 points below
The chart below averages by day of week the daily estimated OCC (OTA-listed-inventory basis) for June–July 2026 at business hotels in the four prefectures with the thickest premiums (Kochi, Kyoto, Mie and Oita). Saturday is highest at 90.9%, followed by Thursday at 87.0%, Friday at 86.2% and Wednesday at 85.1%. Against that, Sunday runs 79.4% and Monday 80.6%, gaps of 11.5 points and 10.3 points versus Saturday. There is a clear trough within the week. Day-of-week troughs are not confined to the four prefectures covered here: at business hotels in Hokkaido the same shape appears, with Tuesday through Thursday running thick and Sunday and Monday forming the trough, and a gap of more than ten points between Saturday and Sunday has also been observed at business hotels in Aichi.
Business hotels in Kochi, Kyoto, Mie and Oita, daily observations for June–July 2026 (244 property-days in total), averaged by day of week. Source: MetroEngines Research; compiled by the HotelBank Editorial Team
This is where the design room for a two-meal plan sits. On a day like Saturday, when inventory is thin, rooms move on room-only or breakfast-included alone. There is little need to load up two-meal plans at the cost of straining the kitchen. Conversely, Sunday and Monday are the days on which the choice between cutting the room rate to fill and holding the rate while building the take per room-night through meals genuinely matters. A premium median of ¥4,451 nationally, and ¥6,000 to ¥9,000 in the top prefectures, is large enough to be set head-to-head against a decision to cut the room rate by several thousand yen on a trough day. Lose the same few thousand yen to a discount, or take it in as dinner — the launch day for a two-meal plan is that comparison itself.
Concentrating the launch on trough days also solves the capacity problem. Pulling dinner service onto specific days of the week makes both ingredient purchasing and staff rostering easier to read, and frees the high-occupancy days for room operations. “All at once on the trough days” beats “a little every day” for controlling food and labor cost. Note that the position of the trough varies by market, so always confirm the day-of-week shape at your own property against your actuals.
For revenue managers at regional and tourism-located business hotels that sell two-meal plans — implications and an action plan
1. Hold your own differential against the prefecture figure on both “rate” and “amount.” Against Kochi at +49.7% / ¥8,610 and Kyoto at +43.1% / ¥9,042, Tokyo runs +17.0% but ¥4,137 in yen — close to the national median of ¥4,451. A location that looks low on rate may well be capturing the amount, and the reverse also happens. Reduce the differential between your breakfast-included and two-meal plans to a single number, then hold it against both the prefecture figure and the national median. That is the first task.
2. Copy the seasonal shape of the premium into your pricing calendar. Kochi widened from +40.4% in May to +56.5% in July, while Oita narrowed from +44.4% in June to +28.4% in July. Given that the national median barely moves within a +27.3% to +29.9% band, that swing comes from demand context specific to the prefecture. Line up how your own two-meal plans have sold month by month and check whether the shape matches the prefecture’s or diverges from it.
3. Work the premium back from the floor that covers cost. The breakfast-only premium is +10.6% / ¥1,549 at the national median. If adding dinner leaves your differential anywhere near that level, you need to re-check whether it covers ingredients and same-day labor. The ¥4,451 median the market pays for dinner is not a ceiling for pricing but a reference point: “this level is accepted by the market.”
4. Launch on the occupancy trough. In the four prefectures with thick premiums, Sunday runs 79.4% and Monday 80.6% against Saturday’s 90.9% — a gap of more than ten points. Cut the room rate to fill the trough, or hold the rate and build it back through dinner. The level of the premium is large enough to be compared directly against that discount.
| Time horizon | Move | Decision trigger | Objective |
|---|---|---|---|
| Today to this week | Calculate the differential between your breakfast-included and two-meal plans and hold it against the prefecture figure and the national median | If your differential still sits below the national median of +28.3% / ¥4,451 | Make the headroom visible |
| Today to this week | Line up the past two months of your own occupancy by day of week and identify the trough day | If Sunday and Monday run around ten points below Saturday (90.9% across the four prefectures) at your property too | Narrow down the launch days for the two-meal plan |
| Within two weeks | Build up food cost per dinner cover plus the extra same-day labor, and take the difference against your current differential | If your differential sits near the breakfast-only national median of ¥1,549 | Confirm the break-even line for serving dinner |
| Within two weeks | Build one two-meal plan restricted to trough days, fixing the cap on covers before it goes on sale | If cutting the room rate on trough days has become routine | Secure the take in place of a discount |
| Toward next month | Reflect the monthly shape of the premium in your own pricing calendar | If your month-by-month differential moves opposite to the prefecture’s shape (Kochi May +40.4% to July +56.5%, and so on) | Avoid leaving money on the table in peak demand |
| Toward next month | Prioritize room-only and breakfast-included on high-occupancy days and pull dinner service onto trough days | If Saturday occupancy is running around 90% | Concentrate and then level out the load on kitchen and staff |
Source: MetroEngines Research; compiled by the HotelBank Editorial Team
Conclusion — three yardsticks
1. Measure your property on “rate and amount,” not on rate alone. The national median is +28.3% / ¥4,451. Kochi, at the top on rate (+49.7% / ¥8,610), and Tokyo, low on rate but at the median in yen (+17.0% / ¥4,137), mean entirely different things. When the breakfast-included level in the denominator differs, the rate ranking flips easily.
2. Read the seasonal shape at the prefecture level. The national median held roughly flat at +27.3% to +29.9% through May–September, yet Kochi widened from +40.4% to +56.5% and Oita narrowed from +44.4% to +28.4%. The national figure is no reference for your own calendar. What you use is the shape of the prefecture.
3. Work the launch day back from the occupancy trough. Even in the four prefectures with the thickest premiums, there is a gap of more than ten points between Sunday at 79.4% and Monday at 80.6% on one side and Saturday at 90.9% on the other. Because dinner is a product with a ceiling on capacity, bunching it onto trough days gives better control over food and labor cost than spreading it thinly across every day. The level of the premium (a national median of ¥4,451, and ¥6,000 to ¥9,000 in the top prefectures) is large enough to be set directly alongside the size of a trough-day discount.
Dinner is one of the few levers that moves the take per room-night without touching the room rate. In a period when the year-on-year move in estimated settled ADR is confined to a few percent in either direction in many prefectures, the meal premium varies by thousands of yen from prefecture to prefecture. Start by reducing your own differential to a single number and holding it against the yardsticks in this article.
About the Data
■ Data sources
・The figures in this article are based on accommodation price and room inventory data collected and aggregated by MetroEngines Research, re-aggregated for editorial use by the HotelBank Editorial Team. The meal premium, estimated settled ADR and estimated OCC all come from the same aggregation base.
・Breakdown of N: the meal premium covers the business hotel segment in all 47 prefectures, with N=5–51 paired properties per prefecture (the monthly total of paired properties was 875 properties as of July 2026). Cells with N below 5 are not cited. The aggregation period is the five months from May to September 2026. Estimated settled ADR is the finalized value for July 2026, covering N=67 properties in Kochi, N=325 in Kyoto, N=94 in Mie and N=91 in Oita. The estimated OCC by day of week is based on daily observations across the four prefectures for June–July 2026, 244 property-days in total.
・Data as of September 2, 2026. Selling conditions and inventory change daily, so the figures in this article are a snapshot at the time of retrieval.
■ Calculation assumptions
・Definition of the meal premium: the differential from a pair comparison covering only properties that sell both a “breakfast-included” and a “two-meal (breakfast and dinner included)” plan within the same hotel. A simple average that mixes in properties selling only one of the two meal types would let differences in property grade contaminate the result, so only the within-property difference is aggregated. Aggregated under conditions that include meals for two guests. The ryokan segment is out of scope.
・Definition of estimated settled ADR: the transaction price level (pre-tax equivalent) inferred from OTA and other sales data (lowest-plan level × segment coefficient, ensembled across multiple channels). Past months are finalized values; current and future months are estimates based on current selling conditions. Median error against published operating results is 6.6%. Both July 2025 and July 2026, cited in this article, are finalized values, so the year-on-year comparison is between finalized months.
・Booking curve: based on observations from 45 days before the stay date up to the present.
■ Limitations and caveats
・Definition of estimated OCC (OTA-listed-inventory basis): occupancy on an OTA-listed-inventory basis = 100 − 100 × rooms remaining on OTA listings ÷ total rooms. It is an estimate based on how inventory sold on OTAs is being taken up, and is defined differently from actual room occupancy (it reads higher). The day-of-week aggregation in this article covers the business hotel segment in Kochi, Kyoto, Mie and Oita for June and July 2026.
・Prefectures with few paired properties (N=5–7) see their figures move sharply when just a few properties revise their products. Values for the top prefectures should be read as an indication that “cases of dinner commanding a high price exist in that area,” not as evidence that every property in the prefecture can capture the same premium. The monthly set of paired properties also changes from month to month, so a month-on-month comparison is not necessarily a comparison of the same group of properties.