

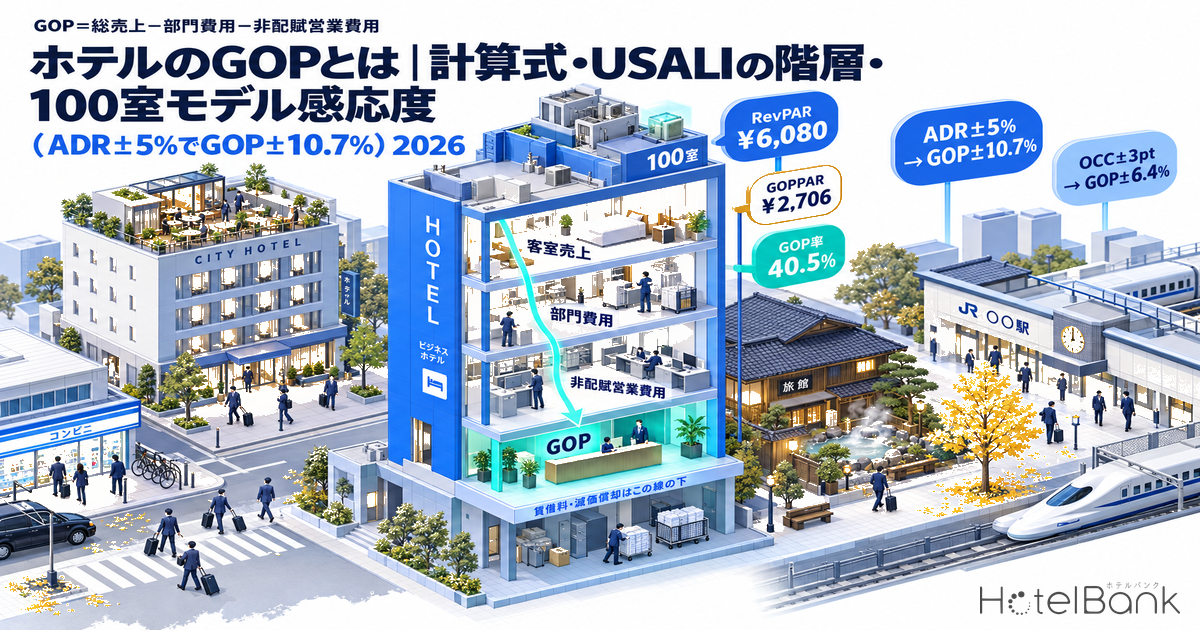
When measuring a hotel’s earning power, the common language shared by owners, investors and management companies is GOP (Gross Operating Profit). The reason to cut at this level, rather than at operating income on the income statement and before rent and depreciation are deducted, is to separate “the profit that can be explained by operating skill alone” from the terms of ownership. This article lays out the USALI (Uniform System of Accounts for the Lodging Industry) hierarchy in a single view, builds up in yen per room-night what is deducted on the way from RevPAR to GOPPAR, shows RevPAR ranges for three hotel types from MetroEngines Research’s estimated settled ADR and estimated occupancy, and then works through, in one piece, the sensitivity of a 100-room model to ADR ±5% and OCC ±3pt and the ADR lift needed to absorb rising labor and utility costs.
Metric Definitions Used in This Article
- ADR (average daily rate): calculated by applying a hotel-type-specific correction factor to the lowest-plan level each property publishes on OTAs and other channels (two guests per room, per-room rate, tax included), giving an estimated settled rate (tax-excluded equivalent). Checked against property-level results disclosed by listed hotel REITs (91 properties, most recent three months), the median error is about 7%. These are estimates and differ from each property’s actual settled prices and accounting figures. Area-level ADR is the median of the properties covered (the level of a typical property in the area).
- OCC (occupancy): the share of rooms sold out of total rooms in the area (an estimate based on OTA sales inventory; consistency checks against REIT monthly disclosures confirm accuracy of roughly a few points). This article writes it as “estimated occupancy” and treats it as a separate metric, with a different population and definition, from the room occupancy in the Japan Tourism Agency’s Overnight Travel Statistics Survey (written as “official occupancy”).
- RevPAR: rooms revenue ÷ available rooms = ADR × OCC. TRevPAR: total revenue ÷ available rooms.
- GOP: total revenue − departmental expenses − undistributed operating expenses. GOP margin: GOP ÷ total revenue. GOPPAR: GOP ÷ available rooms (rooms × days). AGOP: adjusted GOP, i.e. GOP after deducting the base management fee. NOI: net operating income attributable to the owner (in this article, EBITDA less the FF&E reserve).
- Where listed prices are mentioned, they are per-room rates for two guests per room (tax included).
- Data sources: MetroEngines Research / Japan Tourism Agency, Overnight Travel Statistics Survey / Japan Ryokan & Hotel Association, Business Conditions Statistical Survey / REIT financial results presentations
- — GOP = total revenue − departmental expenses − undistributed operating expenses. Rent, insurance, property tax, depreciation and interest are deducted below GOP. This line is the boundary of responsibility between ownership and operation.
- — About 60% disappears per room-night on the way from RevPAR to GOPPAR. In a 100-room business hotel model (ADR ¥7,600, OCC 80% assumed year-round), GOPPAR is ¥2,706 against rooms revenue of ¥6,080. GOP margin: 40.5%.
- — Estimated median RevPAR in September 2026: business hotels ¥6,700, city hotels ¥10,700, ryokan ¥10,300 (47 prefectures, estimated settled ADR × estimated occupancy). Ryokan and city hotels have similar RevPAR, yet their GOPPAR differs by nearly 2x.
- — ADR ±5% moves GOP ±10.7%; OCC ±3pt moves it ±6.4%. When both move at once, GOP swings within a range of −16.7% to +17.5%.
- — The ADR lift needed to absorb a +5% rise in labor costs is about 1.9%, and about 2.8% even with utilities up +10%. Even amid 2026’s wage increases, there is considerable room to respond on the pricing side.
Defining GOP — reading the USALI hierarchy in one view
GOP is one of the profit levels defined in USALI, the hotel industry’s accounting standard, and the formula is GOP = total operating revenue − departmental expenses − undistributed operating expenses. USALI is revised jointly by the American Hotel & Lodging Association (AHLA), HFTP and the Global Finance Committee; the current 12th Revised Edition was published in 2024, with an effective date of January 1, 2026. In Japan as well, hotel management contracts and J-REIT variable-rent contracts often use GOP as defined along this hierarchy as their benchmark.
First, the overall structure of the hierarchy. Moving down from the top: “departmental profit” is revenue by department (rooms, F&B, other) less direct costs; “GOP” deducts the indirect costs not allocated to departments; “AGOP (adjusted GOP)” deducts management fees; “EBITDA” deducts ownership-related costs such as rent, property tax and insurance; and “NOI” deducts the reserve for FF&E (furniture, fixtures and equipment). Depreciation, interest and corporate tax sit further below and are handled outside the USALI operating statement.
| Level | Calculation | Examples of costs deducted here | Whose responsibility |
|---|---|---|---|
| Total operating revenue | Rooms + F&B + other revenue | — | Operations |
| Departmental profit | Revenue − departmental expenses | Housekeeping, linen, amenities, distribution commissions, departmental payroll, F&B cost of sales | Operations |
| GOP (gross operating profit) | Departmental profit − undistributed operating expenses | Administration & general, information & telecommunications systems, sales & marketing, property operation & maintenance, utilities | Operations |
| AGOP (adjusted GOP) | GOP − base management fee | Base fee to the operator (typically a percentage of revenue) | Contract |
| EBITDA | AGOP − non-operating expenses | Rent, property tax, insurance premiums, incentive fees, etc. | Ownership |
| NOI | EBITDA − FF&E reserve | Reserve for capital replacement (3–5% of revenue as a guide) | Ownership |
| (Outside USALI) Net income | NOI − depreciation − interest − corporate tax | Depreciation, interest, corporate tax, etc. | Capital structure |
Source: Compiled by the HotelBank Editorial Team based on the operating statement structure of the USALI 11th and 12th Revised Editions (HFTP/AHLA). The boundary between EBITDA and NOI varies with contract and valuation practice.
The point to take from this table is that what is not included in GOP is clearly defined. Rent, insurance premiums, property tax, depreciation and interest are all deducted below GOP. These are costs that change with who owns the building and how (owned or leased, and at what loan-to-value), so even if the same operating team delivers the same occupancy and ADR, a different ownership structure produces a different operating income. GOP can be described as the yardstick for comparing operating results alone, with that difference removed.
On the other hand, there is practical latitude in what goes into “undistributed operating expenses.” Under USALI, utilities belong to undistributed expenses, but in Japanese ryokan accounting they are often included in “operating costs” and treated like departmental expenses. The income statement in the Japan Ryokan & Hotel Association’s FY2024 Business Conditions Statistical Survey (167 valid responses) also has a “GOP” line, but in that survey it is presented as operating income after deducting total expenses (including depreciation), with depreciation added back, which makes it a figure one level below USALI GOP, close to operating income before depreciation. This is why the calculation scope must first be aligned before comparing your own GOP margin with other companies’ figures or industry statistics.
Breaking down the formula — building from RevPAR to GOPPAR in yen per room-night
Rooms-department metrics start with RevPAR = ADR × OCC. ADR is the rate “per room sold” and OCC is “the share of sellable rooms that sold”; multiplying the two gives rooms revenue “per sellable room.” Adding F&B and other revenue and dividing by available rooms gives TRevPAR, and deducting costs and dividing GOP by available rooms gives GOPPAR = GOP ÷ (rooms × days). While GOP margin is “a ratio to revenue,” GOPPAR is “the absolute profit a room earns in one night,” which makes GOPPAR better suited to comparisons across hotel types and to investment decisions. Invincible Investment Corporation’s results presentation for the period ended June 2026 also states explicitly that its operators pursue a “strategy to maximize GOPPAR (GOP per available room).”
From here, let’s look in concrete yen. The model is a 100-room business hotel with ADR ¥7,600 (September 2026 estimated settled ADR, the 47-prefecture median of ¥7,633, rounded) and OCC 80% (an assumption placed midway between our estimated occupancy median of 85.8% and the Japan Tourism Agency’s official business hotel occupancy of 75.7% (August 2026, first preliminary)). Cost ratios reference published figures such as the 29.7% labor cost ratio in the Japan Ryokan & Hotel Association survey and GOP margins of 33.6–38.4% disclosed by a listed REIT, but they are model assumptions set independently for this article (the full list of assumptions is in the table below).
Source: Compiled by MetroEngines Inc. and the HotelBank Editorial Team (100-room business hotel model; yen per available room-night. ADR is an assumed value based on the September 2026 estimated settled ADR, 47-prefecture median)
Adding ¥608 of F&B and other revenue such as breakfast to rooms revenue of ¥6,080 gives total revenue of ¥6,688. Deducting rooms department expenses of ¥2,258 (housekeeping, linen and amenities, distribution commissions, rooms department payroll) and F&B department expenses of ¥389 leaves departmental profit of ¥4,041, or 60% of total revenue. Then, deducting ¥1,335 of undistributed operating expenses for administration, marketing, IT, property maintenance and utilities, GOP comes to ¥2,706, a GOP margin of 40.5%. Measured against RevPAR of ¥6,080, GOPPAR is 44%; in other words, about 60% of rooms revenue per room-night goes to operating costs.
Below GOP, deducting the base management fee (2% of total revenue = ¥134) gives AGOP of ¥2,572; deducting property tax, insurance, etc. of ¥250 gives EBITDA of ¥2,322; and deducting a 3% FF&E reserve (¥200) gives NOI of ¥2,122. Converted to 100 rooms for a year, GOP is about ¥98.8 million and NOI about ¥77.5 million, so for every ¥1 of RevPAR, about ¥0.35 of NOI remains with the owner. Under a lease structure, rent sits at this EBITDA position, and the owner’s figures are replaced by the rental income itself (discussed later).
| Model assumption (set by us) | Value | Published figures referenced (separate series, not mixed) |
|---|---|---|
| ADR | ¥7,600 | Estimated settled ADR, business hotels, 47-prefecture median ¥7,633 (September 2026, N=7,427 properties) / Tokyo Shoko Research, 9 listed business hotel brands, FY2025 ¥14,463 |
| OCC | 80% | Estimated occupancy median 85.8% (September 2026, based on OTA-listed inventory) / Japan Tourism Agency, business hotels 75.7% (August 2026, first preliminary) |
| F&B and other revenue | 10% of rooms revenue | Assumes breakfast, parking, etc. at a limited-service hotel |
| Housekeeping, linen, amenities | ¥1,200 / room sold | Variable cost |
| Distribution commissions | 10% of rooms revenue | Variable cost assuming OTA and similar commission rates |
| Payroll (fixed portion) | ¥1,150 / available room-night | Total labor cost including outsourced housekeeping is 31.5% of total revenue, in line with the 29.7% labor cost ratio in the Japan Ryokan & Hotel Association survey (FY2024) |
| Utilities | Fixed ¥250 + variable ¥300 / room sold | 7.3% of total revenue in total |
| Property maintenance & repairs / marketing, IT, A&G | ¥250 each / available room-night | Fixed cost |
| Result: GOP margin | 40.5% | Invincible Investment Corporation, 101 domestic properties, GOP ratio 33.6% (period ended June 2026) and 38.4% (period ended December 2025) / guide in explanatory materials for limited-service hotels: 40–60% |
Source: Compiled by MetroEngines Research and the HotelBank Editorial Team. Published figures in the right column are references and are a separate series from the model values.
Building the framework from real data — RevPAR ranges for three hotel types (September 2026, 47 prefectures)
The starting point for GOPPAR is RevPAR. We multiplied MetroEngines Research’s estimated settled ADR (September 2026, a finalized month) by estimated occupancy based on OTA-listed inventory for the same month, prefecture by hotel type, and took the distribution across the 47 prefectures. The estimated occupancy covers a fixed cohort of properties listing 30% or more of their total rooms on OTAs; note in advance that, because unlisted rooms are counted on the sold side, it runs higher than official occupancy (for business hotels, our estimate is 85.8% versus 75.7% in the Japan Tourism Agency’s August preliminary figures).
| Hotel type | Estimated settled ADR 25th pct / median / 75th pct | Estimated occupancy (Sep 2026) 25th pct / median / 75th pct | Estimated RevPAR 25th pct / median / 75th pct | Coverage |
|---|---|---|---|---|
| Business hotels | ¥6,881 / ¥7,633 / ¥8,668 | 82.7 / 85.8 / 88.8% | ¥5,598 / ¥6,725 / ¥7,658 | 47 prefectures ADR N=7,427 properties Occupancy: 3,722 properties / 449,969 rooms |
| City hotels | ¥8,473 / ¥9,714 / ¥13,184 | 83.2 / 85.8 / 90.0% | ¥9,140 / ¥10,723 / ¥12,767 | ADR: 47 prefectures, N=1,134 properties Occupancy: 21 prefectures, 428 properties / 77,786 rooms |
| Ryokan | ¥11,155 / ¥12,545 / ¥15,320 | 79.6 / 83.5 / 85.9% | ¥9,185 / ¥10,313 / ¥13,043 | ADR: 47 prefectures, N=6,814 properties Occupancy: 46 prefectures, 3,382 properties / 94,636 rooms |
Source: Compiled by MetroEngines Research and the HotelBank Editorial Team (September 2026; distribution of prefecture medians. RevPAR = estimated settled ADR × estimated occupancy. City hotel occupancy covers only the 21 prefectures where an estimation cohort could be formed. Property and room counts for occupancy are the counts covered as of September 1, 2026; for some hotel types the number of covered properties increases during the month.)
Source: Compiled by MetroEngines Research and the HotelBank Editorial Team (bars show the 25–75% range of the prefecture distribution; points are medians. September 2026)
The median business hotel RevPAR is ¥6,700, and only three prefectures exceeded ¥10,000: Tokyo (ADR ¥13,400 × occupancy 90.3% ≈ ¥12,100), Aichi (¥10,700) and Hokkaido (¥10,100). Aichi hosted an international sporting event in September, and its estimated settled ADR rose sharply year on year, so it should not be read as a steady-state level. Conversely, in Osaka, business hotel ADR fell by just over 30% from the same month last year, during the Expo, to ¥8,900, and RevPAR returned to ¥7,100, close to the national median.
What stands out is the relationship between ryokan and city hotels. Median RevPAR is nearly level, at ¥10,300 for ryokan and ¥10,700 for city hotels. But ryokan RevPAR is derived from rates that typically include two meals; in the Japan Ryokan & Hotel Association survey, accommodation-and-meal revenue accounts for 82.0% of total revenue, and food purchasing alone accounts for 14.1% of total revenue. Even at the same RevPAR, the structure of costs deducted on the way to GOP is completely different.
Source: Compiled by MetroEngines Research and the HotelBank Editorial Team (horizontal axis: estimated settled ADR; vertical axis: estimated occupancy. 1 point = 1 prefecture, September 2026. City hotels: 21 prefectures)
On a scatter plot, business hotels cluster in a narrow band of “ADR ¥6,000–9,000, occupancy 80–93%,” while ryokan stretch out horizontally across “ADR ¥7,000–21,000.” The three prefectures where ryokan RevPAR exceeded ¥15,000 were Kanagawa (including Hakone and Yugawara; ADR ¥20,800 × 83.7% ≈ ¥17,400), Hyogo (¥16,000) and Kyoto (¥16,900), all of which earn on the strength of high rates. This difference produces the gap in GOPPAR by hotel type that we look at next.
Let’s translate RevPAR into GOPPAR. For business hotels, rooms revenue is about 90% of total revenue; placing the GOP margin at 35–41%, between the REIT disclosure (33.6–38.4%) and our model (40.5%), GOPPAR against the median RevPAR of ¥6,700 comes to about ¥2,600–3,000. For city hotels, assuming rooms revenue is 60% of the total gives TRevPAR of about ¥17,900, and at a GOP margin of 20–30%, the guide for full-service hotels, GOPPAR is about ¥3,600–5,400. For ryokan, an 82% share of accommodation-and-meal revenue gives TRevPAR of about ¥12,600, and placing the GOP margin in a range from the 13.0% operating margin before depreciation in the Japan Ryokan & Hotel Association survey up to 20%, GOPPAR stays at about ¥1,600–2,500. Ryokan and city hotels, level on RevPAR, are roughly 2x apart on GOPPAR. Looking at this translation process makes it clear why comparing hotel types on GOP margin alone means little.
| Published figures (reference; separate series from our estimates) | Ryokan | Resort hotels | Business hotels | City hotels |
|---|---|---|---|---|
| Japan Tourism Agency room occupancy, 2025 (final) | 38.2% | 56.9% | 75.3% | 74.1% |
| Japan Tourism Agency room occupancy, July 2026 (second preliminary) | 40.2% | 59.0% | 74.6% | 71.9% |
| Japan Tourism Agency room occupancy, August 2026 (first preliminary) | 47.4% | 66.9% | 75.7% | 72.3% |
| Tokyo Shoko Research, listed hotels FY2025 room rate / occupancy | — | — | ¥14,463 / 83.9% (9 brands) | ¥25,490 / 81.2% (3 brands) |
| Japan Ryokan & Hotel Association FY2024 survey, room occupancy (167 member ryokan and hotels) | 56.9% | (ryokan and hotels combined; accommodation rate ¥18,121 per person) | ||
Source: Compiled by the HotelBank Editorial Team from the Japan Tourism Agency, Overnight Travel Statistics Survey (August 2026 first preliminary, July 2026 second preliminary); Tokyo Shoko Research, “FY2025 Survey of Room Rates and Occupancy at Listed Business and City Hotels” (June 17, 2026); and the Japan Ryokan & Hotel Association, FY2024 Business Conditions Statistical Survey
Official occupancy is lower than our estimate because the Japan Tourism Agency survey is a full-population estimate that includes properties not on OTAs and properties centered on group and corporate contracts, whereas our estimate is limited to a cohort of properties moving inventory on OTAs. The fact that listed hotels’ room rates are higher than our prefecture medians likewise reflects listed chains’ concentration in major cities; the right reading is that the two are not in conflict but reflect different populations. That is also why this article’s model places its assumptions between them.
Sensitivity — how much GOP moves across four quadrants of ADR ±5% and OCC ±3pt (100-room model)
With definitions and levels in place, we use the same 100-room model to check how much GOP responds to what. A change in ADR flows almost straight through to GOP apart from distribution commissions (10%), and because in this model F&B revenue linked to rooms revenue also contributes, a ¥1 rise in ADR adds about ¥0.95 of GOP per room sold. A change in occupancy, by contrast, carries variable costs for housekeeping, linen and utilities and F&B cost of sales, so a 1pt rise in occupancy (365 room-nights a year at 100 rooms) adds about ¥58 to GOP per available room-night.
| 100-room model, annual GOP (baseline ¥98.8M) | OCC −3pt (77%) | OCC 80% (baseline, year-round assumption) | OCC +3pt (83%) |
|---|---|---|---|
| ADR +5% (¥7,980) | +¥3.9M (+3.9%) GOPPAR ¥2,813 | +¥10.6M (+10.7%) GOPPAR ¥2,997 | +¥17.3M (+17.5%) GOPPAR ¥3,180 |
| ADR ±0 (¥7,600) | −¥6.3M (−6.4%) GOPPAR ¥2,534 | Baseline ¥98.8M GOPPAR ¥2,706, GOP margin 40.5% | +¥6.3M (+6.4%) GOPPAR ¥2,879 |
| ADR −5% (¥7,220) | −¥16.5M (−16.7%) GOPPAR ¥2,254 | −¥10.6M (−10.7%) GOPPAR ¥2,416 | −¥4.7M (−4.7%) GOPPAR ¥2,578 |
Source: Compiled by MetroEngines Inc. and the HotelBank Editorial Team (estimates using the model assumptions above; costs recalculated according to the variable/fixed cost classification)
Source: Compiled by MetroEngines Inc. and the HotelBank Editorial Team (100-room model; change in annual GOP versus baseline, ¥ million)
The diagonal of the four quadrants spans ¥33.8 million of GOP, equivalent to 34% of the baseline. What deserves attention is the asymmetry: “ADR +5%, OCC −3pt” stays positive at +¥3.9 million, while “ADR −5%, OCC +3pt” turns negative at −¥4.7 million. Cutting rates by 5% and winning back 3pt of occupancy does not restore GOP. Rooms filled through discounting bring variable costs for housekeeping, linen and utilities with them; with a contribution margin of ¥5,758 per room sold, the GOP breakeven occupancy needed to recover fixed costs of ¥1,900 (per available room-night) is a low 33%. The table shows a structure in which, in an occupancy band well above breakeven, rate rather than occupancy determines GOP.
So how far can the 2026 cost environment be absorbed through ADR? Rengo’s final tally for the 2026 spring wage offensive put the wage increase at 5.01% (4.69% at small and medium-sized companies); the minimum wage for FY2026 was raised by ¥56 on a national weighted average to ¥1,177; and in the Ministry of Health, Labour and Welfare’s Monthly Labour Survey preliminary results for July 2026, total cash earnings of part-time workers in accommodation and food services were up 5.6% year on year. If the model’s labor costs (31.5% of total revenue including outsourced housekeeping) rise 5%, that is an additional cost of about ¥106 per available room-night. To absorb this through room rates, relative to rooms revenue after commissions, it is enough to raise ADR by 1.9% (about ¥150). On utilities, the FY2026 renewable energy power promotion surcharge was set at a record ¥4.18/kWh, but even if the model’s utilities (7.3%) rise 10%, the required ADR lift is 0.9% (about ¥70), and combining both, the lift stays within 2.8% (about ¥220).
| Cost increase scenario (100-room model) | Additional cost (per available room-night) | Annual (100 rooms) | ADR lift needed to absorb |
|---|---|---|---|
| Labor +3% | ¥63 | About ¥2.3M | +1.2% (about ¥90) |
| Labor +5% | ¥106 | About ¥3.9M | +1.9% (about ¥150) |
| Utilities +10% | ¥49 | About ¥1.8M | +0.9% (about ¥70) |
| Labor +5% and utilities +10% | ¥154 | About ¥5.6M | +2.8% (about ¥220) |
Source: Compiled by MetroEngines Inc. and the HotelBank Editorial Team (required ADR lift = additional cost ÷ rooms revenue after commissions; occupancy assumed constant)
In September 2026, estimated settled ADR was up year on year by +7.9% for the 47-prefecture median of business hotels and +4.5% for ryokan. The 2–3% lift needed to absorb rising costs lies within the increases the market has actually been achieving. On the numbers, ample room for rate revisions remains, and the focus shifts to design: where to capture it across seasons, days of the week and lead times.
Common misreadings — confusing GOP and NOI, cross-type comparisons, and how lease contracts look
Finally, we set out the misreadings about GOP that recur in practice. None stem from the definition itself; all arise from confusing “which level’s figure is being viewed, and from whose standpoint.”
| Misreading | What is happening | Correct reading |
|---|---|---|
| Thinking GOP and NOI are the same profit | GOP is after operating costs; NOI is after rent, property tax, insurance and the FF&E reserve as well. In the model, GOP is ¥2,706 versus NOI of ¥2,122, a gap of ¥584 per room-night. Real estate yields are expressed in NOI; the results of a management contract are expressed in GOP. | For yield on acquisition price, use NOI. To evaluate an operator, use GOP (or AGOP). |
| Comparing hotel types side by side on GOP margin | Ryokan and city hotels, with high F&B shares, have inflated total revenue in the denominator, so their GOP margins come out structurally lower. That is why ryokan and city hotels, level on RevPAR, are roughly 2x apart on GOPPAR. | Across hotel types, use GOPPAR (profit per room-night). Use GOP margin within the same type and contract structure. |
| Treating “GOP” in statistics as identical to USALI GOP | GOP in the Japan Ryokan & Hotel Association survey (13.0% overall) is operating income of 6.0% plus 6.9% of depreciation added back, i.e. operating income before depreciation, a figure after management costs have been deducted. Its calculation scope differs from the GOP ratio in REIT disclosures (Invincible 33.6%). | Before comparing, check whether depreciation, rent and property tax have been deducted. |
| Looking for GOP in the owner’s P&L under a lease contract | Under a lease structure, GOP appears in the P&L of the operator as tenant, and rent is an expense below it. Only rental income reaches the owner. Under variable-rent contracts, GOP is translated into rent in the form “rent = fixed rent + a variable portion linked to hotel GOP.” | Owners should pin down the contractual GOP definition (which costs are deducted) and the variable-rent formula. |
| Mistaking AGOP for GOP | Management contracts often calculate incentive fees and variable rent on AGOP (adjusted GOP), i.e. GOP less the base management fee. In the model with a 2% base fee, GOP is ¥2,706 versus AGOP of ¥2,572. | Check the definitions clause of the contract to see whether GOP or AGOP is the benchmark. |
Source: Compiled by the HotelBank Editorial Team. Figures are from the model above, the Japan Ryokan & Hotel Association FY2024 Business Conditions Statistical Survey, and Invincible Investment Corporation’s 46th period results briefing materials.
J-REIT disclosures make concrete how lease contracts look. Invincible Investment Corporation classifies its hotels into categories such as “variable-rent hotels” and “fixed-rent hotels,” and explains that for variable-rent hotels it receives, in addition to fixed rent, a variable portion linked to hotel GOP as rent. For the period ended June 2026, RevPAR at its 101 domestic properties was up 1.6% year on year and GOP up 0.4%, with the GOP ratio down 0.9pt to 33.6%; excluding the Kansai area, where Osaka-Kansai Expo demand fell away, the GOP ratio rose 0.2pt to 33.9%. Increases and decreases in GOP generated on the operating side flow straight through variable rent to the investment corporation’s distributable income. Those evaluating leased hotels need to read, rather than the GOP figure itself, which portions of GOP convert into rent, and at what ratios, under the contract.
Implications for operators and owners — aligning the conversation on GOPPAR
Putting it all together, the key points for using GOP in practice come down to three. First, establish which USALI level your property’s GOP sits at. Are utilities included in departmental expenses? Is a figure after rent being called GOP? Unless this is aligned, no comparison with REIT disclosures or industry statistics means anything. Second, for cross-type comparisons and investment decisions, speak in GOPPAR rather than GOP margin. A limited-service hotel earning ¥2,700 per room-night and a city hotel earning ¥4,500 but carrying F&B facilities and staff require different levels of investment and staffing. GOPPAR puts them on the same footing in a single unit: “the profit one room generates in one night.”
Third, put the asymmetry of sensitivity to work in pricing design. The difference in lever size, ADR +5% moving GOP +10.7% versus OCC +3pt moving it +6.4%, together with the structure that “winning back occupancy through discounts does not restore GOP,” supports decisions to capture rate on dates with strong demand: peak seasons, weekends and close-in. The estimate that an ADR lift of just 2.8% absorbs labor +5% and utilities +10% shows that the 2026 cost environment is within a range that can be handled through pricing. GOP is best used not as a diagnostic tool but as a tool that lets operators and owners discuss, in the same language, where the upside lies.
Frequently Asked Questions
Q. What is hotel GOP? What is the formula?
A. GOP (Gross Operating Profit) is the profit left after deducting departmental expenses (housekeeping, distribution commissions, F&B cost of sales, departmental payroll, etc.) and undistributed operating expenses (administration, marketing, IT and telecommunications, property maintenance, utilities) from total operating revenue. The formula is “GOP = total revenue − departmental expenses − undistributed operating expenses.” Rent, insurance premiums, property tax, depreciation and interest are deducted below GOP.
Q. What is the difference between GOPPAR and RevPAR?
A. RevPAR is a “revenue” metric, rooms revenue divided by available rooms, and equals ADR × OCC. GOPPAR is a “profit” metric, GOP divided by available rooms (rooms × days). In this article’s 100-room business hotel model, GOPPAR is ¥2,706 against RevPAR of ¥6,080, with about 60% of revenue going to operating costs.
Q. What is AGOP?
A. AGOP (Adjusted GOP) is the profit after deducting the base management fee paid to the operator from GOP. It is often used as the basis for incentive fees under management contracts and for variable rent at J-REITs and others, so you need to check in the contract whether GOP or AGOP is the benchmark.
Q. What is a typical GOP margin?
A. In listed REIT disclosures, Invincible Investment Corporation’s GOP ratio for its 101 domestic properties was 33.6% for the period ended June 2026 and 38.4% for the period ended December 2025. Explanatory materials cite ranges such as 40–60% for limited-service hotels and 10–30% for full-service hotels. However, because it varies greatly with calculation scope and F&B share, GOPPAR is better suited than GOP margin for comparisons across hotel types.
References and Sources
■ Data sources
Estimated settled ADR by hotel type is from MetroEngines Research’s prefecture × hotel type aggregation (September 2026, a finalized month; three types: business hotels, city hotels and ryokan), and estimated occupancy is the estimate for the same month based on OTA-listed inventory (a cohort of properties listing 30% or more of their total rooms on OTAs). Cost ratios, GOP margins and official occupancy are quoted as published from the Japan Ryokan & Hotel Association, listed REIT results presentations, the Japan Tourism Agency’s Overnight Travel Statistics Survey and Tokyo Shoko Research, and treated as a separate series from our estimates.
■ Model assumptions
The 100-room business hotel model assumes ADR ¥7,600 and OCC 80% (year-round); F&B and other revenue = 10% of rooms revenue; distribution commissions 10%; housekeeping, linen and amenities ¥1,200 per room sold; payroll (fixed portion) ¥1,150, property maintenance ¥250 and marketing/IT/A&G ¥250 per available room-night; utilities fixed ¥250 + variable ¥300 per room sold; F&B cost of sales about 45% of F&B revenue. The base management fee is 2% of total revenue, property tax, insurance, etc. ¥250, and the FF&E reserve 3% of total revenue. Sensitivities were recalculated keeping the variable/fixed cost classification, and ADR lift was calculated as “additional cost ÷ rooms revenue after commissions” (occupancy constant).
■ Limitations and caveats
Estimated settled ADR is an estimate (tax-excluded equivalent) obtained by applying a hotel-type factor to the lowest-plan level, and does not match each property’s accounting room rate. Estimated occupancy is based on OTA-listed inventory and therefore runs higher than official occupancy. GOPPAR ranges by hotel type are conversions based on assumed rooms revenue shares and GOP margins, not observed P&L values. The cost structure of the 100-room model is one example assuming a limited-service hotel; GOP margin and sensitivity vary greatly with location, contract structure and F&B share.
- HFTP / AHLA / GFC, release announcing the “Uniform System of Accounts for the Lodging Industry, 12th Revised Edition” (effective January 1, 2026)
- Invincible Investment Corporation, “46th Period (ended June 2026) Results Briefing Materials” — RevPAR, GOP and GOP ratio for 101 ICN properties; rent structure of variable-rent hotels
- Japan Ryokan & Hotel Association, “FY2024 Business Conditions Statistical Survey” (FY2023 financial statements, 167 valid responses, published December 27, 2024)
- Japan Tourism Agency, “Overnight Travel Statistics Survey (August 2026 first preliminary, July 2026 second preliminary)”
- Tokyo Shoko Research, “FY2025 Survey of Room Rates and Occupancy at Listed Business and City Hotels” (June 17, 2026)
- Ministry of Health, Labour and Welfare, “Monthly Labour Survey, Preliminary Results for July 2026,” Table 1: Monthly cash earnings
- nippon.com, “Minimum wage raised by ¥55 to a national average of ¥1,176 — MHLW council” (2026) / Japan Institute for Labour Policy and Training, Business Labor Trend, October 2026 issue (national weighted average ¥1,177 after prefectural recommendations)
- Rengo, “2026 Spring Wage Offensive Final Tally”: wage increase 5.01%, SMEs 4.69% (published July 3, 2026)
- Agency for Natural Resources and Energy, “Renewable Energy Power Promotion Surcharge”: FY2026 rate ¥4.18/kWh
- Relo Hotel Solutions, “What Is Hotel GOP?” — guide to GOP margins by hotel type
- MetroEngines Research — estimated settled ADR (prefecture × hotel type, September 2026, a finalized month; business hotels N=7,427 properties, city hotels N=1,134 properties, ryokan N=6,814 properties) and estimated occupancy based on OTA-listed inventory (September 2026; counts as of September 1: business hotels 3,722 properties / 449,969 rooms, city hotels 428 properties / 77,786 rooms, ryokan 3,382 properties / 94,636 rooms). Tracks about 168,000 properties in Japan, of which about 27,000 properties whose occupancy can be confirmed on OTAs are analyzed.